Medical Home for Children with Special Health
Care Needs in North Carolina
By
Savithri Nageswaran
A Master's Paper submitted to the faculty of
The University ofNorth Carolina at Chapel Hill
In partial fulfillment of the requirements for
The degree ofMaster ofPublic Health in
The Public Health Leadership Program.
Chapel Hill
ABSTRACT
Background: A medical home is a model of care defined by the American
Academy ofPediatrics as medical care for children that is accessible, continuous,
comprehensive, family-centered, coordinated and compassionate. North Carolina
uses the medical home concept as a model for providing high quality care to
children with special health care needs (CSHCN). However, information on
characteristics ofCSHCN, predictors of having a medical home and the impact of
having a medical home on outcomes ofCSHCN in North Carolina are not
available.
Methods: This study uses the data from the National Survey of Children with
Special Health Care Needs conducted between 2000 and 2002. A random sample
of parents or caregivers of CSHCN was surveyed in the United States.
Information on health status ofCSHCN, health care experiences and insurance
status was obtained. This study is limited to the data obtained from North
Carolina. The characteristics of children with special health care needs are
described. Bivariate analysis of socio-demographic factors with medical home
and its 5 components (family-centered care, effective care coordination, personal
doctor or nurse, usual source, referral problems) was carried out. Multivariate
analysis was conducted to identif'y the predictors of having a medical home. The
impact of having a medical home on the outcomes ofCSHCN and their families
was assessed.
Results: Fifty six percent ofCSHCN in North Carolina have a medical home.
of having a medical home in this population. White CSHCN have 1. 7 times the
odds of not having a medical home compared to non-White CSHCN and those
with no limitation of activities due to their condition have 1.6 times the odds of
having a medical home compared to those who have limitation of activities.
Children who have a medical home are less likely to have unmet health services
needs or to have delayed or foregone care, and respondents were more likely to
report that the health services were easy to use and to be satisfied with the
serv1ces.
Conclusions: This study provides comprehensive information about CSHCN in
North Carolina which can be used for needs assessment, and implementation and
evaluation of programs for CSHCN in North Carolina. Disparities among CSHCN
due to race/ethnicity and severity of their condition should be considered in
organizing services for CSHCN in North Carolina. Future studies are needed to
evaluate the 5 components of medical home and their impact on child health
BACKGROUND
Children with special health care needs (CSHCN) are those who have or are at
increased risk for a chronic physical, developmental, behavioral, or emotional
condition and who also require health and related services of a type or amount
beyond that required by children generally 1
Based on this definition, an estimated 9.3 million children in the United States
have special health care needs, accounting for 13% of all children in the United
States. 2 This estimate would be higher if children who are institutionalized and
children who are at increased risk of special needs were included.
CSHCN spend an additional 52 million days ill in bed and have an additional 58
million school absence days annually compared to children without special health
care needs3 Health ofCSHCN impacts not only the children, but their families as
well. Families of children with disabilities' incur significantly higher out-of
pocket expenses for providing health care for their children than those without
disabilities. 4 Approximately 21% of parents of CSHCN report financial problems
due to their child's health and 30% of parents had to decrease their hours of
employment or stop working altogether because of their child's condition2
CSHCN have higher health care utilization than their counterparts. In 1994,
CSHCN had more than twice as many physician contacts and 5 times as many
hospital days than other children3 According to the Medical Expenditure Panel
Survey (MEPS), in 1999-2000, children with disabilities had higher rates of
hospital admissions (97 vs. 23/1000 children), physician visits (5 vs. 2), and
emergency room visits (250 vs. 30/1000 children) and took more prescription
medications (6 vs. 2) compared to children without disabilities4 Though children
with disabilities comprised only 7% of children younger than 18 years in this
study, they accounted for 23% of total health care expenditures4
In spite of the higher utilization of health services, a larger proportion of
caregivers of CSHCN report that the health services needs of their children have
not been met (13%) compared to caregivers of those without special needs (6%)3
Satisfaction with care received was also lower among parents ofCSHCN (18%)
compared to parents of children without special needs (14%)3 A recent survey
shows 18% of all CSHCN in the United States had one or more of health care
services needs that were not met2
In order to improve the quality of care for CSHCN, the Maternal and Child Health Bureau (MCHB) has adopted the medical home concept as a model of care for
CSHCN. The MCHB uses having a medical home as one of the performance
measures to assess a state's progress in implementing services for CSHCN_s
Increasing the proportion of children with special health care needs with access to
a medical home is one of national Healthy People 2010 objectives (16-23)6 In
National Center of Medical Home Initiatives for Children with Special Health
Care Needs with a goal to ensure that all CSHCN have access to a medical home.
The term "medical home" was conceived by the AAP in 1967 7 In 1992, for the frrst time, the AAP defined the medical home in its policy statement: The AAP
believes that the medical care of infants, children and adolescents ideally should
be accessible, continuous, comprehensive, family centered, coordinated,
compassionate and culturally effective and be delivered or directed by
well-trained physicians who provide primary care and help to manage essentially all
aspects of pediatric care. The physician should be known to the child and the
family and should be able to develop a partnership of mutual responsibility and
trust with them. These characteristics define the medical home. 8 In 2002, the AAP
operationalized the medical home concept in its policy statement by describing 3 7
characteristics under 7 domains that constitute a medical home. 8
There is substantial empirical evidence for the effectiveness of individual
components of the medical home concept (i.e. continuity of care, comprehensive
care, coordinated care and usual source of care) in improving child-level and
family-level outcomes of children with special health care needs. Studies show
that comprehensive and coordinated disease management results in decreased
severity of illnesses, decreased school absences, decreased hospitalizations and
improved receipt of preventive care in children with chronic medical conditions
clinical outcomes of high-risk children as well. In a study of 887 very low birth
weight infants, children who received comprehensive care had Jess life
threatening illnesses and fewer intensive care admissions compared to children
who received routine care.16 A study of children with diabetes who lived in
low-income households showed that children who experienced high continuity of care
had lower hospitalizations due to diabetic ketoacidosis and better preventive care
than children who did not have continuity of care.17 Continuity of care is
associated with fewer emergency room visits and hospitalizations in children with
asthma.18 In a cross-sectional study of parents, there was a significant difference
in the satisfaction with care between the patients who had continuous care and
those who did not 19
However, there is limited literature evaluating the medical home concept as a
whole. Even among available studies, there is considerable variation in the way
the medical home concept is operationalized. This is because the medical home
concept is not a single entity but a composite of37 different characteristics.
Presence of after-hours care, usual source of care, comprehensive care,
coordinated care have all been used individually or in combination in different
studies as a measure of the medical home concept20-24 As a result, comparison of
these studies is difficult
Palfrey et al. (2004) evaluated a medical home model of care which consists of
individualized health plan for each CSHCN and providing continuing medical
education for practitioners. 21 They studied 117 CSHCN in 6 practices. With this
model of care, the authors observed a statistically significant decline in
hospitalizations among CSHCN and the need for parents to miss work. At the end
of intervention, a significantly higher percentage of parents reported that the
services were easy to use compared to the baseline estimation. Since the study
was limited to a group of practices in one geographical area, it is difficult to
generalize their results to other practice situations. The other limitation of this
study is that it cannot be compared to other studies because of lack of uniform
measurement criteria.
Strickland et al. (2004) conducted the first population-based evaluation of the
medical home concept using the National Survey of Children with Special Health
Care Needs data25 This survey does not address all the components of medical
home as defined by the AAP. But, by systematic evaluation, a set of items in this
survey has been identified to represent the medical home concept26 In this survey,
medical home was considered to be present if a CSHCN has all of the following 5
components: (I) a usual source of care, (2) a personal doctor or nurse, (3) no
difficulty in obtaining needed referrals, ( 4) care coordination when needed and ( 5)
- 25 27
family-centered care.,, ·
Using the criteria mentioned in the previous paragraph, 53% of CSHCN in the
income level and severity of the condition ofCSHCN to be statistically
significantly associated with not having a medical home25 Hispanic CSHCN had
1.9 times the odds of not having a medical home and Black CSHCN had 1.7 times
the odds of not having a medical home compared to White CSHCN. Children who
had severe limitations of their activities had 2. 7 times the odds of not having a
medical home compared to those who did not have any limitation of their
activities. The odds of not having a medical home decreased with increasing
income level of the family. Not having a medical home increased the odds of
having delayed or foregone care and having unmet needs for health services and
family support services, even after adjusting for socio-demographic factors25
i
Systems of care for CSHCN are developed and implemented through the states
I
with the help of Title V funds from the MCHB. The MCHB in tum requires the
states to report on the needs, services and performance measures on services for
CSHCN. 28 In North Carolina, the Women and Children's Health Section of the Division of Public Health collaborates with the North Carolina Pediatric Society,
private pediatric practices, Access II/III networks and the Family Support
Network in planning and implementing programs for CSHCN. 29 To provide a
comprehensive approach to the development of medical homes for CSHCN in
North Carolina, The Medical Home Initiative for Children with Special Health
Care Needs has been designed by the Division of Public Health29 Information on
characteristics of CSHCN, risk factors for having a medical home and the impact
information will be valuable in designing and implementing programs that are
tailored to the needs of CSHCN in North Carolina. This information will also
serve as a baseline for future evaluation of the state's performance.
Until recently, state-level data on CSHCN were not available. The National
Survey of Children with Special Health Care Needs was designed to obtain
state-level as well as national-state-level prevalence estimates, to describe the services this
population of children needs and to assess possible areas in need of improvement
in the systems of care for CSHCN. 2 The data has been collected in a manner that
allows comparison across the states and the nation30 The National Survey of
Children with Special Health Care Needs data was used in this study to obtain
estimates ofCSHCN in North Carolina that are necessary for program evaluation
and needs assessment.
The objectives of this stndy are (1) to describe the prevalence and characteristics
of CSHCN in North Carolina, (2) to assess the demographic risk factors
associated with having a medical home for CSHCN in North Carolina, and (3) to
evaluate the impact of having a medical home in the above population. The results
from this stndy will be compared with the national-level estimates on medical
home and its components reported in 2 previous studies using the same survey. 2' 25
METHODS Data Source:
The National Survey of Children with Special Health Care Needs was sponsored
by the MCHB and conducted by the National Center for Health Statistics (NCHS)
between October 2000 and April 2002. A random-digit-dial sample of households
with children under 18 years was selected from each of the 50 states and the
District of Columbia3
°
First, selected demographic information was obtained forall children in the household. Next, children were screened for special health care
needs using the screener questionnaire. When more than one child with special
health care needs was identified in the screener interview, one child was randomly
chosen. Finally, for each child with special health care needs chosen, detailed
information on health and functional status, access to and use of health services,
health insurance coverage, care coordination, satisfaction with care and impact on
the family of the child with special health care needs was collected.
The data were obtained through a complex sample design. Three sampling
weights were developed for the survey: (a) a household screener weight to
account for non-response and multiple telephone lines, (b) a child screener weight
to represent the demographics of the United States, and (3) a child interview
weight to account for multiple-child households. The weight adjusted sample will
represent the population characteristics of the United States as estimated by 2000
The survey has 4 files: (a) a screener file (b) an interview file (c) an insurance file
and (d) a household file. The screener file has information on each child with a
CSHCN screener interview. Information on health and functional status, access to
and use of health service, health insurance coverage, care coordination,
satisfaction with care and impact on the family is available on the interview file.
The household file has information at the household level regarding the household
size, state of residence, metropolitan status of residence, number of CSHCN in the
household and household income level. The insurance file has insurance
information on the children identified as CSHCN.
All the survey data are publicly available at the National Center for Health
Statistics website31 All the 4 files were merged prior to analysis. This study is
limited to the data from CSHCN in North Carolina.
Variable Description:
The study sample was CSHCN in North Carolina. A child was identified as
having a special need if he or she: (1) needs or uses more medical care, mental
health services, or educational services than is usual for most children of the same
age because of a medical, behavioral or health condition that is expected to last 12
months or longer; (2) needs or uses prescription medication because of a medical,
behavioral or health condition that is expected to last 12 months or longer; (3) has
a limitation in abilities to do the things that most children of the same age can do
months or longer; (4) needs or gets special therapy such as physical, occupational,
or speech therapy because of a medical, behavioral or health condition that is
expected to last 12 months or longer; or ( 5) has an emotional, developmental or
behavioral problem that is expected to last or lasted for 12 months or longer for
which he or she needs treatment or counseling.
Having a medical home is the outcome of interest. It is a dichotomous variable.
The medical home variable was derived from 5 variables (component variables)
which in tum were derived from multiple variables (sub-component variables).
The medical home variable was derived from a total of 12 variables as follows:
1. The child has a usual source of care.
i) The child has a usual source for sick care.
ii) The child has a usual source for preventive care.
2. The child has a personal doctor or nurse.
3. The child has no problems obtaining referrals when needed.
4. Effective care coordination is received when needed.
i) The child has professional care coordination when needed.
ii) Doctors communicate well with each other.
iii) Doctors communicate well with other programs.
5. The child receives family-centered care.
i) Doctors usually or always spend enough time.
iii) Doctors are usually or always sensitive to family's values and
customs.
iv) Doctors usually or always provide needed information.
v) Doctors usually or always make the family feel like a partner.
If a child did not meet any one of the sub-component variables, then the
component variables were considered to have not been met. If a child did not
meet any of the component criteria, then he or she was considered not to have met
the criteria for medical home. This strategy of deriving the medical variable was
based on the method described elsewhere27
Age, gender, race/ethnicity, impact of the child's condition on his or her activities,
metropolitan status of residence, income level of the household, mother's
education, type of insurance and adequacy of insurance were the independent
variables of interest. All of these variables were categorical variables. Age was
categorized into: (a) 0 to 5 years, (b) 6 to 11 years and (c) 12 to 17 years.
Race/ethnicity was categorized into 4 categories: (a) Hispanic, (b) Non-Hispanic
White, (c) Non-Hispanic Black and (d) Non-Hispanic other races and multiracial.
Education level of the mother ofCSHCN was categorized into 3 categories: (a)
less than high school education, (b) high school education and (c) more than high
school education. Metropolitan status had 2 values: (a) residence inside
metropolitan statistical area (MSA) and (b) residence outside MSA. Income level
Levelt (FPL) (b) 100 to 399% FPL and (c) more than 400% FPL. The impact of
the child's condition on his or her activities is an indirect measure of the severity
of the child's condition. It was derived from 2 variables and categorized into 3
categories: (a) CSHCN whose condition did not affect them in the previous 12
months, (b) CSHCN whose condition affected them sometimes in the previous
year or caused very little or some impairment of their activities, and (c) CSHCN
whose condition affected them usually or always in the previous year or caused a
great deal of impairment of ability. Insurance type had 4 categories: (a) uninsured
at the time or interview or had gaps in insurance in the year prior to the interview,
(b) private insurance, including insurance obtained through an employer or union,
(c) public insurance, which includes Medicaid, State Children's Health Insurance
Plan (SCRIP), military insurance, unspecified public insurance, comprehensive
insurance from a facility supported by the Indian Health Service or a Native
American Corporation, or Title V coverage, and (d) both public and private
insurance or an insurance that could not be classified as either private or public.
Adequacy of insurance was derived from 5 variables as described previously.27 To
be considered to have adequate health insurance, a child needed all of the
following:
1. The child has public or private insurance at the time of interview.
2. The child has no gaps in insurance coverage in the year prior to the
interview.
3. Insurance usually or always meets the child's needs.
t Based on Year 2000 Federal Poverty Guidelines published by the Department of Health aod
4. Costs not covered by insurance are usually or always reasonable.
5. Insurance usually or always permits child to see needed providers.
If the child did not meet any one of the criteria mentioned above, insurance was
considered inadequate.
The proportion of CSHCN needing health services was calculated for each of the
following services: routine preventive care, specialist care, dental care,
prescription medicines, therapy services, mental health care or substance abuse
treatment, home health care, vision care, hearing aids, mobility devices,
communication aids, medical supplies and medical equipment.
Finally, the impact of having a medical home on CSHCN and their families was
assessed. Six categorical variables were used as impact measures:
1. Family's satisfaction with services received by CSHCN (present or
absent)
2. Ease of use of health services (usually/ always easy to use or never/
sometimes)
3. Time spent by the caregiver on coordinating care for CSHCN (less than
an hour per week or more than an hour per week)
4. Unmet need for any needed health services listed above (present or
5. Unmet need for any needed family support services, which includes
respite care, genetic counseling and mental health care or counseling
(present or absent)
6. Delayed or forgone care ofCSHCN in the year prior to interview (yes or
no).
Statistical Methods:
First, univariate analysis was performed on the study population. Prevalence
estimates among the demographic factors were obtained. Then, the characteristics
of CSHCN were tabulated. Bivariate analysis was performed to determine the
association of each one of the independent variables to the presence of medical
home and its components. Pearson chi-square test was used to examine the
association between categorical variables.
Since the observations in certain categories of the variables were small, changes
to the variables were made in order to obtain valid population estimates of the
odds ratio of having a medical home. Age was used as a continuous variable.
Race/ethnicity was categorized into: (a) Non-Hispanic White and (b) all other
races and multiracial. Impairment in activities was changed into a 2-category
variable: (a) no impairment of activities and (b) some or severe impairment of
activities. Insurance type was categorized to: (a) uninsured or had gaps in
insurance in the previous years and (b) is currently insured with no gaps in
insurance in the previous year. Dummy variables were created for poverty status.
'
Education of the mother ofCSHCN was changed to 2 categories by combining
"more than high school education" and "high school education". Unadjusted odds
ratios for the presence of medical home were obtained for each one of these
independent variables.
Independent variables that had significant odds ratios for the presence of medical
home in bivariate analysis were included in multivariate analysis. All the
remaining variables were analyzed to determine if they confounded the
relationship of the independent variables to the outcome. If the variables were not
confounders, they were not included in the model. Pearson correlation coefficient
was used to examine correlation among the variables in the model. Logistic
regression model was used for multivariate analysis.
In order to obtain population-level estimates, appropriate survey weights were
used in the analysis. Survey statistics were used for all analysis. NCHS
recommends that attention be paid to standard errors (S.E) of the estimates in the
analysis. 30 According to NCHS, if the relative standard error of an estimate is
greater than or equal to 30, then the estimate is not a reliable or precise population
estimate. Relative standard error (RSE) was calculated as follows32:
RSE = (S.E/Estimate)*IOO
At each step of the analysis, relative standard error was calculated for the
estimate. When RSE was equal to or greater than 3 0, the estimate was considered
further analysis. A p value ofless than 0.05 was considered to be statistically
significant Stata Intercooled version 8.2 was used for statistical analysis.
Institutional Review Board approval was obtained for our study.
RESULTS
Using the National Survey of Children with Special Health Care Needs, there are
an estimated 280,770 children with special health care needs in North Carolina,
accounting for 14% all children less than 18 years of age. The prevalence is
higher among boys compared to girls (16% vs. 11%). The characteristics of
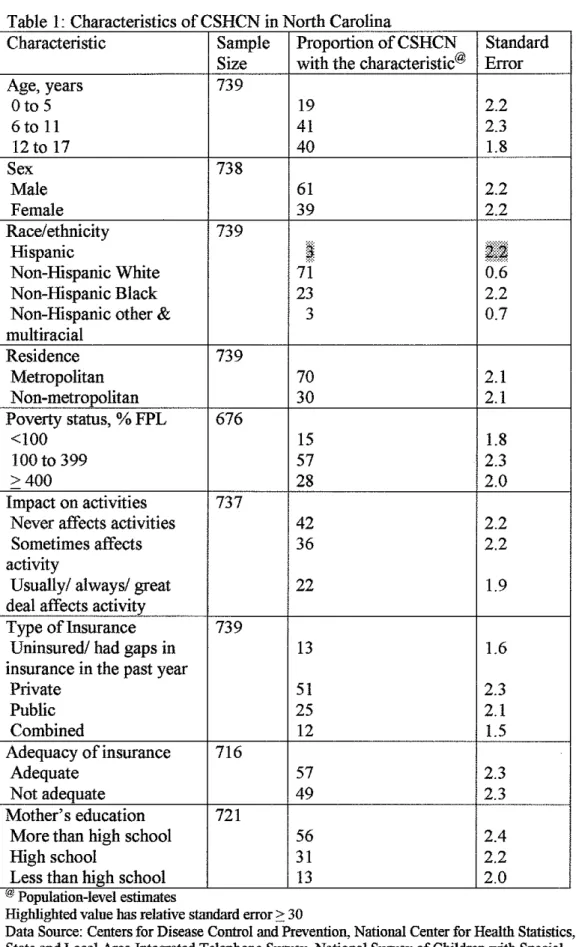
CSHCN in North Carolina are described in Table L A higher proportion of
CSHCN are boys (61%) and are non-Hispanic White (71%), live in a
metropolitan area (70%) and have private insurance (51%)_ Eighty one percent of
CSHCN are older than 5 years of age. The prevalence is 17% in this population
compared to 8% among children younger or equal to 5 years.
The health services needs of CSHCN are summarized in Figure I. The most
commonly needed health service for CSHCN was prescription medicines (91%)
followed by dental care (80%) and routine preventive care (74%). Valid estimates
for substance abuse treatment services and communication aids could not be
obtained because of the small number of children using these services. When
categorized by age, 85% of children younger than or equal to 5 years reported
needing routine preventive care. A smaller proportion of children in the 6 to II
routine services. Unmet needs for any type of health service was 14%. Unmet
needs for specific health services used by CSHCN could not be measured because
of the very small number ofCSHCN reporting an unmet need for a specific
serv1ce.
Among the CSHCN, 91% had a usual source of care, 86% had a personal doctor
or nurse, 78% received family-centered care, 48% received effective care
coordination, and 81% had no difficulty obtaining referrals. Fifty six percent of
the children met all the 5 components of medical home in North Carolina and an
additional29% met 4 of the 5 components. Of the 29% who met 4 components of
medical home, more than half lacked family-centered care.
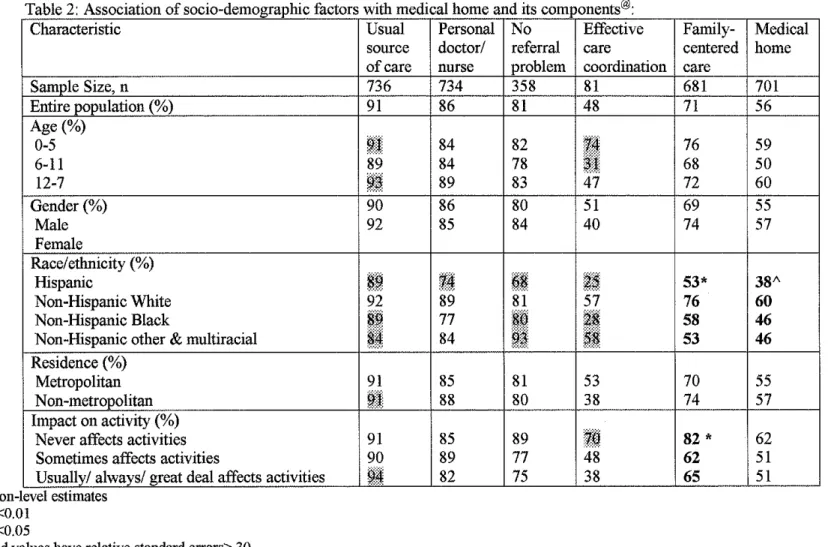
Results of bivariate analysis of the independent variables with medical home and
all of its components are presented in Tables 2 and 2a. There was significant
difference between the categories of race/ethnicity and the presence of medical
home (p= 0.02). While 60% of non-Hispanic White CSHCN had a medical home,
only 38% of Hispanic CSHCN had one. Forty-six percent of CSHCN who were
non-Hispanic Blacks and of other race had a medical home. A higher percentage
of children whose condition was reported to never have had an impact on their
activities ( 62%) had a medical home compared to those who reported that their
illness caused some impairment (51%) or severe impairment (51%). Poverty
status showed a significant association with the presence of medical home
FPL, a higher percentage of children living in households with income greater
than 400% FPL had a medical home ( 43% vs. 63% ). Though type of insurance
was not associated with medical home in this sample, a higher percentage of
children having adequate insurance ( 60%) had a medical home compared to those
who did not (49%). This association was statistically significant (p=0.02). Age,
gender, residence and mother's education were not significantly associated with
the presence of medical home by bivariate analysis.
Statistically significant differences were found among categories of some
demographic factors and certain components (family-centered care and having a
personal doctor or nurse) of medical home (Tables 2 and 2a). Income level of the
household was significantly associated with the presence of a personal doctor or
nurse (p=0.004). Seventy-one percent of children who lived in households with
income less than 100% FPL reported having a personal doctor or nurse. A higher
percentage of children living in households with income between 100 to 399"/o
and income more than 400% FPL reported having a personal doctor or nurse
(87% and 92% respectively). Receipt offamily-centered care was significantly
associated with race/ethnicity, type of insurance, adequacy of insurance and
limitation of activities of CSHCN.
Unadjusted odds ratios for each one of the independent variables to the presence
of medical home are summarized in Table 3. White children compared to
severe limitation of activities and children with adequate insurance compared to
those without adequate insurance had higher odds of having a medical home.
Though poverty was significantly associated with medical home in bivariate
analysis, only CSHCN who belonged to the highest income households (::0: 400
FPL) had significantly higher odds of having a medical home than CSHCN of the
poor household. There was no difference between CSHCN of higher-income
households (>400% FPL) and those of medium-income households (100% to
399% FPL). When household income level was collapsed to 2 categories of
<100% FPL and ::0: 100% FPL, no significant difference in the odds of having a
medical home was observed.
Race/ethnicity, impact on activities and adequacy of insurance were the
independent variables used in the logistic regression model. None of the other
variables (age, gender, residence, income status, type of insurance and mother's
education) confounded the relationship of the 3 independent variables and the
presence of medical home. Hence these variables were not included in the model.
There was no correlation among the three variables used in the model. The model
had 92% of observations of the study sample.
The results of multivariate analysis are presented in Table 4. The associations of
race/ethnicity and impact on activities with the presence of medical home
persisted even after adjusting for the other 2 variables in the model. However,
insurance was not associated with the presence of medical home. In North
Carolina, non-White CSHCN have 1. 7 times the odds of having a medical home
compared to White children, adjusted for impairment of activities and adequacy
of their insurance. For the same population, children with no impairment of
activities have 1.6 times the odds of having a medical home compared with
children who have some or severe impairment of activity.
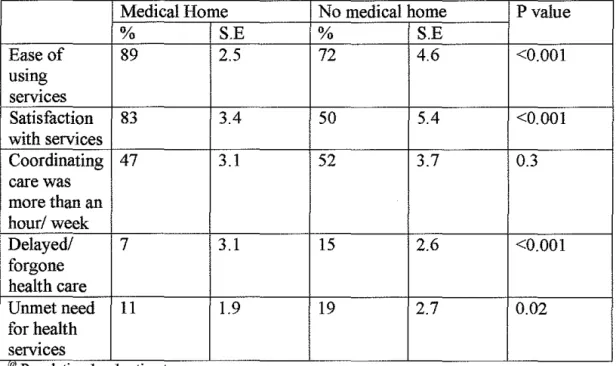
The results ofbivariate associations of having a medical home and each one of the
5 impact measures are summarized in Table 5. The percentages ofCSHCN who
reported ease of use of services and satisfaction with services were higher among
those who had a medical home. Children with a medical home had less delayed
care compared to those without (p=0.003). Children without a medical home had
more unmet needs for health services than children with a medical home (p=0.02).
The percentage of families who spent more than an hour coordinating care was
not different in the 2 groups. The association between unmet need for family
support services and having a medical home could not be examined because of
the small number of observations.
DISCUSSION
The objectives of this study are to describe the characteristics of CSHCN in North
Carolina, to identify the demographic factors associated with having a medical
home and to describe the impact of having a medical home on CSHCN and their
Children who belong to the minority groups and children whose conditions cause
limitation of their activities have significantly higher odds of not having a medical
home compared to their counterparts. Having a medical home is associated with
lower unmet health services needs and delayed or forgone care, and higher
parental satisfaction with health care services and parental perception of ease of
use of health services.
The prevalence of CSHCN in North Carolina is similar to the national estimate of
13%. Previous state-level estimates are not available for comparison. In the past,
prevalence estimates of children with special needs have ranged from 5% to 30%.
This huge variation in prevalence estimates is due to the various definitions used
to identify children with special health care needs. When condition lists were used
to describe children with special needs, the prevalence was higher because
conditions which were chronic, but did not require excessive use of services were
included33 When the study population was limited to disabling conditions, it
excluded children who did not have severe limitation of activities though they
needed more services because of their health condition. Hence the prevalence was
much lower when the study population was limited to disabling conditions34 To
alleviate the problems due to lack of a uniform definition, a new definition of
CSHCN was developed in 1998. Using this definition in the 1994 Health
Interview Survey, Newacheck et al estimated 18% of children in the United States
to have special health care needs3 However, the Health Interview Survey was not
retrospectively using the I 998 definition of CSHCN. On the other hand, the
screening tool to identifY CSHCN in the National Survey of Children with Special
Health Care Needs was developed based on the current CSHCN definition35
Hence there is a difference in the prevalence estimates in these 2 studies, although
the same definition was used. Our study did not include children who are
institutionalized and children who are at risk of a medical condition that will need
excess health services. Currently, there is not a single tool available to identifY
children who are at risk.
Similar to North Carolina, nationally, the prevalence of CSHCN among boys is
higher than among girls. The higher prevalence of CSHCN among boys, that is
observed in our study and other prior studies is probably due to the higher
prevalence of certain conditions in boys. 3• 5 A higher prevalence is also noted among children older than 5 years compared to those younger than 5 years. 2 This
difference is probably because conditions requiring special needs and services
manifest more often and are diagnosed more often as children grow older and
enter school. Though nationally, the prevalence of CSHCN is higher among
low-income populations (less than 100% FPL), this difference is not seen in North
Carolina2' 36
The prevalence ofCSHCN among Hispanic children in North Carolina is much
lower (7%) than other racial or ethnic groups. A similar trend is found nationally,
Commenting on this disparity, van Dyck et al. (2004) hypothesize that the low
prevalence is either due to a true difference in the health status, a diagnostic bias
due to poor access to health care, or language barrier in responding to the survey
instrument2 Past studies show similar low CSHCN prevalence among Hispanic
children, but this gap is not as wide as it is in the current survey: in 1994, 15% of
Hispanic children were identified or presumed to have special needs compared to
19% ofWhite children3 To assess if language was contributing to this disparity,
the prevalence of CSHCN among Hispanics who were interviewed in English was
determined. Interestingly, when the language of interview was accounted for in
the analysis, the gap narrowed: 15% ofHispanics in North Carolina who were
interviewed in English reported having a CSHCN. Hence it is unlikely that
Hispanic children are at lower risk of having a special health care need. Whether
the difference is due to underdetection of Hispanic CSHCN because of poor
access to care or due to misinterpretation of questions used in the survey because
oflanguage barrier, needs to be determined.
Prescription medicines, dental care, routine preventive care, specialist care and
vision care are the 5 most commonly needed health services for CSHCN in North
Carolina. The results are similar to that of the United States36 A higher
percentage ofCSHCN in North Carolina (91%) report needing prescription
medicines compared to the nation (88%). It is of concern that only 75% of all
CSHCN and just 70% of children in the 12 to I 7 year age group reported a need
Compared to the nation, a higher percentage of CSHCN in North Carolina had a
medical home (56% vs. 53%), received family-centered care (71% vs. 67%) and
effective care coordination (48% vs.40%) and had no difficulty obtaining referrals
(81% vs. 78%). While the percentage ofCSHCN with a usual source of care is
similar to the nation, only 86% of CSHCN in North Carolina had a personal
doctor or nurse compared to 89% in the nation. However, these differences in
results between North Carolina and the nation are small.
Bivariate analysis in our study showed statistically significant associations
between race/ethnicity, poverty status and adequacy of insurance and the presence
of medical home. The national study did not analyze bivariate associations of
socio-demographic factors and the presence of medical home. However, the
results of bivariate analysis of socio-demographic factors and the presence of the
5 medical home components in our study are similar to that of the nation for the
most part. Similar to our study, differences among categories of race/ethnicity
groups and limitation of activities in the receipt of family-centered care was noted
in the national study. Unlike the national study, statistically significant
associations between poverty status and age categories, and the presence of
family-centered care were not noted in our study. Poverty status was significantly
associated with the presence of having a personal doctor or nurse both in our
referral problems. We found statistically significant differences in the categories
of insurance type and adequacy of insurance in the receipt offamily-centered
care. Since insurance was not studied in the national study, we could not compare
North Carolina and national results. Bivariate analysis of medical home and its
components and socio-demographic factors in North Carolina were very similar to
the nation for most of the factors that could be compared. The reason for some of
the associations to be statistically significant at the national level but not
significant for North Carolina is likely because of the relatively small size of the
North Carolina sample. However, two associations showed a large difference
between North Carolina and the nation: the percentage of CSHCN who belong to
low-income household with a personal doctor was much lower in North Carolina
than the nation (71% vs. 82%); among the same population, the trend was
reversed with regards to family-centered care (62% and 50% in North Carolina
and the nation respectively).
The results of multivariate analysis from our study were compared with the results
of the studies of Strickland et al. and van Dyck et al2• 25 Strickland et al. used age,
gender, race/ethnicity, income level and limitation of activities as the independent
variables in their logistic regression model to predict the presence of medical
home among CSHCN. Insurance type, adequacy of insurance, metropolitan status
of residence and mother's education were not used in their model. van Dyck et a!.
used age, gender, race/ethnicity, income level, presence or absence of insurance,
regression models to predict receipt of family-centered care, difficulty in
obtaining referrals, presence of a personal physician or nurse and presence of a
usual source of care. Hence, the odds ratios obtained from our study and the
studies of Strickland et al and van Dyck et al should be interpreted in the context
of the other socio-demographic factors used in the model.
Similar to the national study, race/etlmicity was an important predictor for not
having a medical home in North Carolina25 CSHCN of the minority groups had
higher odds of not having a medical home compared to White CSHCN (aOR10=
1.5 for Hispanics, aOR=l.4 for Blacks and other races)25 Because of the small
number of the minority families surveyed, the odds for each minority group in
North Carolina could not be estimated. van Dyck et al. found racial disparities
among the components of medical home: compared to White CSHCN, Black and
Hispanic CSHCN had higher odds of not receiving family-centered care and
Hispanic CSHCN had higher odds of not having a usual source of care and having
problems in obtaining referrals. Previous studies show that children with special
health care needs who belong to the minority groups lack a usual source of care,
receive care outside the doctor's office and are hospitalized more often than
children who do not belong to the minority groups. 37• 38 The impact of children
with special needs on their families is more pronounced among minority
25 37 39 Ou d 'd fu h 'd f . I d' . . .
groups. · · r stu y provt es rt er ev1 ence o racm !Spartttes m access
to medical care among children with special health care needs. Attention should
be paid to racial disparities in organizing services for CSHCN.
Severity of the child's condition was another independent factor for not having a
medical home in this study. The same trend was seen in the national study25
Nationally, CSHCN with severe impairment of their activities had much higher
odds (aOR=2.7) of not having a medical home than those with no impairment of
their activities. Among the components of the medical home, children with severe
impairment had greater problems with obtaining referrals and received less
family-centered care compared to those without an impairment2 Disparities for
children with severe limitations of activities have been widely reported in the
literature. As the severity of the condition of CSHCN increases, the impact on the
children (school absences, hospitalizations and emergency room visits) and their
families (time spent on care and employment changes) becomes more
pronounced. 2• 25• 38• 39 However, disparities due to severity of children's condition
have not been the focus of previous studies. Future studies are needed to
understand the causes for disparities related to the severity of the condition of
children with special health care needs.
Type of insurance and adequacy of insurance were evaluated for their association
with the presence of medical home in this study. Our study showed no association
between the type of insurance and having a medical home. The national study did
predicting the presence of medical home. van Dyck et al found uninsured CSHCN
to have higher odds (aOR=1.8) of not receiving family-centered care, having
referral problems (aOR=l.3), not having a personal doctor (aOR=2.3) and not
having a usual source of care (aOR=2.1) compared to insured CSHCN.
Though adequacy of insurance was associated with having a medical home in the
bivariate analysis, the association was not significant after adjusting for limitation
of activities and race/ethnicity in a multivariate model. A larger percentage of
Whites reported having adequate insurance compared to non-Whites (60% vs.
51%). Similarly, a higher percentage of children who had no limitation of
activities reported having adequate insurance compared to those with limitation of
activities ( 61% vs. 54%). Though race/ethnicity and limitation of activities were
not significantly associated with adequacy of insurance individually, together they
acted as confounders in the relationship of adequacy of insurance. Hence,
according to our study, adequacy of insurance is not an important factor for
having a medical home in North Carolina after adjusting for race/ethnicity and
limitation of activities.
There is substantial evidence to show that being insured positively influences the
health care experiences ofCSHCN2'4'39'40 It is interesting that we did not find
insurance status to be associated with having a medical home in our study.
Insurance status is probably more critical for some components of medical home
Rosenbach et a!. compared children who participated in an expanded health
insurance program for low-income children to those who did not participate in the
program in 3 different states. All the 3 states in this study provided insurance
coverage to low-income children who participated in the program, but only one of
the states provided comprehensive care. The state which provided comprehensive
care to children showed a significant reduction in unmet needs and emergency
room visits compared to uninsured children in that state. On the contrary, no
difference in outcomes was noted in the states that did not provide comprehensive
care. 20 This study is limited to a certain group of children in 3 different states.
However, it illustrates how quality of health care delivery is important to achieve
better outcomes in children. The effect of insurance type and adequacy of
insurance on medical home should be investigated using the national data.
Nationally, children living in a household with an income level ofless than 100%
FPL had 2.4 times the odds of not having a medical home compared to those who
lived in a household with an income of more than 400% FPL. 25 The odds of having a medical home increased with increasing income level. Income level
could not be used in the logistic regression model in our study because only one
category of income level (<100% FPL) was significantly different from the other
(>400% FPL). However, bivariate analysis in our study showed a trend in
disparities among income groups that was similar to the nation. van Dyck et al
report CSHCN who live in households with an income less than 100% FPL to
personal doctor or nurse and not receiving family-centered care compared to
CSHCN who live in households with an income more than 400% FPL. The effect
of poverty on access to medical care of children with special health care needs is
well documented in the literature2' 25• 38• 39 The impact of having a child with
special needs on the family is more pronounced in low-income families. 2' 4' 25
Similar to the national study, age was not a significant factor for medical home in
our study. Among the components of medical home, children in the age group of
12 to 17 years had 1.3 times the odds of not receiving family-centered care. 2 Lack
of family-centered care and usual source of care might contribute to the fact that
only 70% of CSHCN in this age group report a need for routine care. Prior studies
report age associated differences in access to health care, health care utilization
and the outcomes ofCSHCN. Parents of younger children report spending more
time arranging and coordinating care of their children's condition and report
having to change employment because of their child's condition2 On the other
hand, older children have more unmet needs for health services and lack a usual
source of care more often than younger children. 2' 39 Services for CSHCN in the
older age group need to be strengthened.
Our study did not show association between gender and the presence of medical
home. The national study showed a slight increase in the odds of not having a
health services, utilization of health services and the outcomes of CSHCN are
reported in the literature.
The national study did not analyze mother's education and metropolitan status of
residence in their regression model. Our study did not find disparities in having a
medical a home due to mother's education or the place of residence. However,
there are disparities in receipt of health care services related to the education of
the parent and the metropolitan status of residence reported in the literature:
CSHCN whose parents have less than high school education use less physician
visits and utilize less therapeutic services compared to CSHCN whose parents
have college education; CSHCN from metropolitan areas are more likely to have
unmet needs for specialty care compared to their non-metropolitan counterparts38'
39
Our study demonstrated the benefits of having a medical home for CSHCN and
their families. Similar to the national study, significantly lower percentages of
parents of CSHCN who have a medical home reported that the care was delayed
or forgone and that they had unmet health care needs. In addition, our study also
showed higher satisfaction with services by parents of CSHCN who have medical
home. Since, effective care coordination is a component of the medical home
concept, one would expect that a lower percentage of families ofCSHCN who
have a medical home to spend time coordinating care of their children than those
our study. It is possible that there is no actual difference or the dichotomous variable we used was not a good measure of the impact of having a medical home.
The impact of having a medical home should be studied in longitudinal studies.
Limitations
There are certain limitations to our study. Although the National Survey of
CSHCN was designed to make it possible to perform state-level analyses, in depth
analysis could not be performed because the sample size for North Carolina was
small. Because of this reason, specific categories among the socio-demographic
factors could not be examined. The next limitation is that this survey did not
include institutionalized CSHCN and children who are at risk of developing
chronic conditions. Hence, this study cannot be generalized to these 2 populations
of CSHCN. The third limitation involves the measure of medical home in this
study. Though this survey has information that can be used to measure the
medical home concept, it does not include all the characteristics of the medical
home concept. If a different set of items is used to measure the presence of
medical home, the results may be different. Hence, the results of this study can be
compared only with other studies that use the same items to measure the medical
home concept. This point is important to know when comparing studies across the
states and the nation, and studies in the future. Recognizing the need for an
adequate measure of the medical home concept, a new measure has been used in
the National Children's Health Survey which has just been completed41 This
different from the current study. Because of cross-sectional nature of this study,
causality between the socio-demographic factors and the presence of medical
home, and between the presence of medical home and the impact measures cannot
be established. Longitudinal studies are needed to evaluate the impact of medical
home. Lastly, this measure of the medical home concept which is very helpful in
planning and evaluating the medical home concept at a population level is not
suitable for practice level interventions. Practice-level program implementation
requires a tool like the Medical Home Index that will help organize services at
• 23
practices.
Conclusions and Implications
This study provides comprehensive baseline information about characteristics and
health services needs of CSHCN in North Carolina. This information will be
useful for Title V needs assessment reporting by the state to the MCHB. CSHCN
belonging to the minority groups and CSHCN whose conditions cause severe
impairment of their activities were identified as vulnerable groups for low access
to a medical home. These disparities in access to a medical home should be
considered in program planning for CSHCN using the medical home model. Our
study can be used to compare the performance ofNorth Carolina with the nation
and with other states, and to evaluate the performance of North Carolina in the
Certain areas for future research are identified in this study. The effect of
insurance status in having a medical home should be evaluated using the national
sample. Language as a factor in access to a medical home deserves further
exploration. Research should be directed to understand the factors associated with
disparities due to severity of the condition of CSHCN. The differences between
the nation and North Carolina on disparities due to income level should be
evaluated further. It is important to understand if these differences are due to
variation in services among the states in providing care to low-income CSHCN.
Each component of the medical home model needs to be investigated further and
should be considered in planning, implementing and evaluating CSHCN programs
in the state. Among the components of medical home, increasing the proportion of
CSHCN who receive family-centered care will have the greatest impact on
achievement of medical home for CSHCN in North Carolina. Since our
performance is lowest in providing effective care coordination, strategies to
improve our performance in this area should be identified. In addition,
longitudinal studies are needed to assess the impact of having a medical home on
the outcomes of CSHCN and their families.
Finally, there appears to be a complex interaction of socio-demographic factors,
severity of the condition of CSHCN, utilization of health care services, access to
medical home (or the components), outcomes of CSHCN and impact on their
evaluate if care using a medical home model will not only improve outcomes of
CSHCN but also help decrease or eliminate disparities in the outcomes of
CSHCN.
North Carolina is performing better than the nation in providing care to CSHCN
using a medical home model. While we continue to maintain our success in
providing certain components of medical home such as usual source of care, we
need to work to improve effective care coordination and family-centered care in
order to achieve the Healthy People 2010 objective of providing medical home to
all CSHCN in North Carolina.
f
Table 1· Characteristics of CSHCN in North Carolina
Characteristic Sample Proportion of CSHCN Standard
Size with the characteristic@ Error
Age, years 739
Oto 5 19 2.2
6to 11 41 2.3
12 to 17 40 1.8
Sex 738
Male 61 2.2
Female 39 2.2
Race/ethnicity 739
Hispanic
~
~~-~
Non-Hispanic White 71 0.6
Non-Hispanic Black 23 2.2
Non-Hispanic other & 3 0.7
multiracial
Residence 739
Metropolitan 70 2.1
Non-metropolitan 30 2.1
Poverty status, % FPL 676
<100 15 1.8
100 to 399 57 2.3
>400 28 2.0
Impact on activities 737
Never affects activities 42 2.2
Sometimes affects 36 2.2
activity
Usually/ always/ great 22 1.9
deal affects activity
Type of Insurance 739
Uninsured/ had gaps in 13 1.6
insurance in the past year
Private 51 2.3
Public 25 2.1
Combined 12 1.5
Adequacy of insurance 716
Adequate 57 2.3
Not adequate 49 2.3
Mother's education 721
More than high school 56 2.4
High school 31 2.2
Less than high school 13 2.0
"'! Population level estimates
-Highlighted value has relative standard error?: 30
Figure 1: Health services needs ofCSHCN in North Carolina
Percent of CSHCN 11\ith Specific Health Services Needs
Ia
PercentI
Table 2: Association of socio-demographic factors with medical home and its components®· Characteristic
Sample Size, n Entire population (%) Age(%) 0-5 6-11 12-7 Gender(%) Male Female Race/ethoicity (%) Hispanic Non-Hispanic White Non-Hispanic Black
Non-Hispanic other & multiracial Residence(%)
Metropolitan Non-metropolitan Impact on activity(%)
Never affects activities Sometimes affects activities
Usually/ always/ great deal affects activities ® Population-level estimates
*
P value <0.01A P value <0.05
Highlighted values have relative standard errors::: 30
Usual Personal No Effective source doctor/ referral care
of care nurse problem coordination
736 734 358 81
91 86 81 48
~1 84 82
~~
89 84 78
~~ 89 83 47
90 86 80 51
92 85 84 40
$~ z~ ~~
g§
92 89 81 57
$~ 77 ~il
II
~~
84~~·
91 85 81 53
~~. 88 80 38
91 85 89
qij
90 89 77 48
~a 82 75 38
Family- Medical centered home care
681 701
71 56
76 59
68 50
72 60
69 55
74 57
53* 38A
76 60
58 46
53 46
70 55
74 57
82 * 62
62 51
65 51
Data Source: Centers for Disease Control aod Prevention, National Center for Health Statistics, State and Local Area Integrated Telephone Survey, National Survey of Children with Special Health Care Needs 2001.
Table 2a: A _________________________________________________________________________________ Its com ,f socio-d• hie fi · :h medical h .d'
Characteristic
Poverty status, % FPL <100
100 to 399 >400
Type of Insurance(%)
Uninsured/ had gaps in insurance in the past year
Private Public Combined
Adequacy of insurance Adequate
Not adequate
Mother's education(%) More than high school High school
Less than high school
@ Population-level estimates
*
Pvalue<O.OIA P value <0.05
Highlighted values have relative standard errors::: 30
Usual Personal No
source doctor/ referral
of care nurse problem
88 71*
~~
92 87 82
~! 92 87
~
~-~
6492 89 87
II
80 74~~
·~~
90 85 85
92 87 75
~~
!iil
~90 81
·~~
95 88 83
@ ponents" .
Effective Family- Medical
care centered home
coordination care i
!
... -~ 62 4JA
42 73 57
ij4
75 63~~ :-·.· 67A 55
52 78 59
50 62 52
4~ 65 55
36 77* 60A
55 61 49
46 62 44
43 70 57
48 74 ,58
Table 3: Unadjusted odds ratios of socio-demographic factors with medical home@
Characteristic (Referent group) Unadjusted S.E P value
Age
Sex (Female) Male
Race/ethnicity (All other races and multiracial) Non-Hispanic White
Residence (Non-metropolitan) Metropolitan
Poverty status (> 400), % federal poverty level) <100
100to399
Impact on activity (Sometimes/ usually/ always/ great deal affects activities)
Never affects activities
Type of Insurance (All other insurance) Uninsured/ had gaps in insurance in the past year
Adequacy of insurance (Not adequate) Adequate
Mother's education ( < High school)
2: High school
Highlighted value has relative standard errors :>: 30
@ Population-level estimates
Odds Ratio (95% C.I)
1.0(1.0,1.1) 0.02 0.4
0.9(0.6, 1.3) 0.2 0.6
1.8(1.2,2.8) 0.4 0.007
1.1(0.7,1.6) 0.2 0.8
0.4(0.2,0.9) 0.1 0.02 0.8(0.5, 1.2) 0.2 0.3
0.3 0.02
1.8(1.1,2.3)
~!l~!~l~l&-)
11,;$
0.91.6(1.1,2 3) 0.3 0.02
1.2(0.8,1.8) 0.2 0.3
Data Source: Centers for Disease Control and Prevention, National Center for Health Statistics, State and Local Area Integrated Telephone Survey, National Survey of Children with Special
Table 4: Adjusted odds ratios of socio-demographic factors with medical home in a logistic regression model* @
Characteristic (Referent group) Adjusted S.E Pvalue
Race/ethnicity (All other races and multiracial) Non-Hispanic white
Adequacy of insurance (Not adequate) Adequate
Impact on activities (Sometimes/ usually/ always/ great deal affects activities)
Never affects activities
*
Adjusted for other 2 vanables m the model@ Population-level estimates
Odds Ratio (95% C.I)
1.7(1.1,2. 7) 0.39 0.02
1.5(0.99,2.2) 0.29 0.06
0.32 0.03
1.6(1.1,2.3)
Data Source: Centers for Disease Control and Prevention, National Center for Health Statistics, State and Local Area Integrated Telephone Survey, National Survey of Children with Special Health Care Needs 2001.
Table 5: Bivariate analysis of presence and absence of medical home on outcome measures@
Medical Home No medical home P value
% S.E % S.E
Ease of 89 2.5 72 4.6 <0.001
usmg semces
Satisfaction 83 3.4 50 5.4 <0.001
with services
Coordinating 47 3.1 52 3.7 0.3
care was more than an hour/week
Delayed/ 7 3.1 15 2.6 <0.001
forgone health care
Unmetneed 11 1.9 19 2.7 0.02
for health services
....,.-Populanon-level esnmates
Data Sonrce: Centers for Disease Control and Prevention, National Center for Health Statistics,
State and Local Area Integrated Telephone Survey, National Survey of Children with Special Health Care Needs 2001.
Socio-demographic factors Age Gender Race/ethnicity Poverty Insurance Education (Parent) Residence Severity of the condition ' ' ' '
/ 1
CSHCNr'\-=-,---.... T ' ' , ...
,.,,.- 1 ' , ... ..- ...
,." I ' ' , ... ....-··
,...
'
... ......
..
'
~- ...-.. "'
-
;::,....
...-
... . ..., /' Health Services Needs - • - ' , ',../ /
Medical Care ':,., ... · ·... ' ' , ..
Physician visits _ _... ... · ' , .... -~ <~
ER visits ' , ___ ... -·· ··· ' ...
--, ... -···
~:~~~~~~~~~:~~~~---
---Non-physician visits ... ··· ' \ '
Medication use .. ·· .... ··· ' ,
Other ... ··· ' ,
Non medical needs Family Support Needs
Respite
.... '
---
--- ... ~L.:,ounseling
".::-{~
..
~...:··· _,./... ···· ··· --- -,., _ _._.-=;::....__---,
... --····/
, ... ..
...
Medical Home Usual Source of care Personal Doctor Comprehensive Care Continuity of care Coordinated care Family-centered care Referral
---
---':::'0:;;---'
,
:.,,
... . ---Child-Level Outcomes School absenteeism Limitation of activities Complications Hospitalizations Family Outcomes Financial Burden Employment Time for coordinating and caring Other Outcomes Delayed care Unmet health needs Satisfaction with careEase of use of services
References
1. McPherson M, Arango P, Fox H, et a!. A new definition of children with special health care needs. Pediatrics. Aug 1998;102(1 Pt 1):137-140. 2. van Dyck PC, McPherson M, Strickland BB, et al. The national survey of
children with special health care needs. Ambul Pediatr. Jan-Feb 2002;2(1):29-37.
3. Newacheck PW, Strickland B, Shonkoff JP, eta!. An epidemiologic profile of children with special health care needs. Pediatrics. Aug 1998;102(1 Pt 1):117-123.
4. Newacheck PW, Inkelas M, Kim SE. Health services use and health care expenditures for children with disabilities. Pediatrics. Aug
2004;114(1):79-85.
5. McPherson M, Weissman G, Strickland BB, van Dyck PC, Blumberg SJ, Newacheck PW. Implementing community-based systems of services for children and youths with special health care needs: how well are we doing? Pediatrics. Jun 2004;113(5 Suppl):1538-1544.
6. Healthy People 2010. Available at:
http://www.healthypeople.gov/Document/word/Volume2/16MICH.doc. Accessed 11/21/2004.
7. Sia C, Tonniges TF, Osterhus E, Taba S. History of the medical home concept. Pediatrics. Jun 2004;113(5 Suppl):1473-1478.
8. Policy statement: organizational principles to guide and define the child health care system and/or improve the health of all children. Pediatrics. Jun 2004;113(5 Suppl):1545-1547.
9. Camfield CS, Joseph M, Hurley T, Campbell K, Sanderson S, Camfield PR. Optimal management of phenylketonuria: a centralized expert team is more successful than a decentralized model of care. J Pediatr. Jul
2004; 145(1 ):53-57.
10. Drozda DJ, Dawson VA, Long DJ, Freson LS, Sperling MA. Assessment of the effect of a comprehensive diabetes management program on
hospital admission rates of children with diabetes mellitus. Diabetes Educ. Sep-Oct 1990;16(5):389-393.
11. Kelly CS, Morrow AL, Shults J, Nakas N, Strope GL, Adelman RD. Outcomes evaluation of a comprehensive intervention program for asthmatic children enrolled in medicaid. Pediatrics. May
2000; 1 05( 5): 1029-103 5.
12. Patel PH, Welsh C, Foggs MB. Improved asthma outcomes using a coordinated care approach in a large medical group. Dis Manag. Summer 2004;7(2): 102-111.
13. Schulte A, Musolf J, Meurer JR, Cohn JH, Kelly KJ. Pediatric asthma case management: a review of evidence and an experimental study design. J
Pediatr Nurs. Aug 2004;19(4):304-310.