1 Infant Mortality in the United States: Regions, Race, and Reasons
By
Jacintha N. McKoy
A Master‟s Paper submitted to the faculty of the University of North Carolina at Chapel Hill
In partial fulfillment of the requirements for the degree of Master of Public Health in
the Public Health Leadership Program.
Chapel Hill 2009
2 Abstract
The infant mortality rate is the number of infants per 1,000 live births who die in the first year of life. Worldwide, infant mortality is used an indicator of the health status of countries and states, as well as to gauge differences in health status among groups of people within a
population. While the United States has one of the most technologically advanced medical care systems among industrialized countries, it currently ranks 46th in infant mortality. At the
3 Introduction
Worldwide, infant mortality is used as an indicator of the health status of countries and states, as well as to gauge differences in health status among groups of people within a
population. The infant mortality rate serves as a barometer of the healthcare system and how access to healthcare affects women‟s health, prenatal care and screening, children‟s healthcare, and underlying health status. While the United States has one of the most technologically advanced medical care systems among industrialized countries, it currently ranks 46th in infant mortality (Central Intelligence Agency, 2008). Many factors contribute to the infant mortality rate in the United States, including a rise in prematurity and preterm birth seen since the mid-1980s. Obvious racial and geographic disparities persist despite various efforts to lower the overall infant mortality rate and reduce these disparities.
The infant mortality rate is the number of infants per 1,000 live births who die in the first year of life. The first year of life is often divided into the neonatal (within the first 28 days of life) and the post-neonatal (from 29-365 days of life) periods. The infant mortality rate in the United States, currently 6.83 per 1,000 live births, is influenced by many factors including race and ethnicity, the rate of preterm birth, and congenital conditions. Examining the leading causes of infant mortality can lead to research and interventions to prevent infant mortality and reduce disparities. For example, among these mothers an effective intervention might help reduce the burden of infant mortality due to potentially preventable causes, such as sudden infant death syndrome, infections, and injury. Many efforts to reduce infant mortality, discussed below, are targeted at these conditions.
4 Each year the Centers for Disease Control and Prevention (CDC) list the leading causes of infant mortality (Figure 1). In 2005, these conditions accounted for nearly 70% of all child deaths before one year of age, with congenital malformations, disorders related to short gestation and low birth weight, and sudden infant death syndrome accounting for 43%. Contrasts in causes of death exist between racial and ethnic groups. For example, the leading cause of infant death among Non-Hispanic whites was birth defects. However, among Non-Hispanic blacks the leading cause of death was low birth weight. In fact infants born to black mothers had a
mortality rate related to low birth weight over four times higher than low birth weight infants born to white mothers (304.9 vs. 75.7 per 100,000 live births). Disparities continue along this same trend when looking at the other top five causes of infant mortality (Figure 1). However, the smallest disparity related to causes of infant death are those due to birth defects, with the rate of among infants born to black mothers 34% higher than those infants born to white mothers.
5 Figure 1. Leading Causes of Infant Mortality, 2005
From Mathews, T. J., & MacDorman, M. F. (2008). Infant mortality statistics from the 2005 period linked birth/infant death data set. Natl Vital Stat Rep, 57(2), 1-32.
Complications due to short gestation and low birth weight are ranked as the first and second most common cause of infant mortality among infants born to black and white mothers respectively. In addition they are ranked as the second and third leading cause of infant mortality among infants born to American Indian/Alaska Native and Asian/Pacific Islander mothers. Among Hispanics they are the second most common cause of death among all groups, except among Puerto Rican Hispanics, among whom they are ranked first (Mathews &
MacDorman, 2008).
6 percent of all infant deaths. The CDC reports that between 1980 and 2000 the percentage of low birth weight infants rose by 11.8 percent and that of very low birth weight infants by 24.3
percent ("Infant mortality and low birth weight among black and white infants--United States, 1980-2000," 2002). A comparison of rates of very low birth weight by race shows that the rates of very low birth weight among African Americans has increased progressively since 1950. Rates of very low birth weight have also risen among whites, most notably with the growth of assisted reproductive technologies (Gage, Fang, O'Neill, & Stratton, 2009; "Infant mortality and low birth weight among black and white infants--United States, 1980-2000," 2002).
While the risk factors for some of the leading causes of infant mortality have yet to be elicited by research or evidence, others have been shown to be modifiable by preventive measures. These interventions have been the focus of many public health efforts in the last 20 years. For example, research by Pitkin has shown that the intake of folic acid both prior to and early in pregnancy can reduce the risk of spina bifida and other neural tube defects, one of the most common birth defects with an incidence of 1.90 per 10,000 live births (Pitkin, 2007; "Racial/ethnic differences in the birth prevalence of spina bifida - United States, 1995-2005," 2009; Williams et al., 2002). Research concerning other congenital conditions such as cardiac malformations, congenital diaphragmatic hernia and bronchopulmonary sequestration shows that these conditions are somewhat amenable to in utero repair (Bruner, 2003). To date there are few if any medical treatments for many of the most common chromosomal abnormalities, such as Trisomy 21 (Down syndrome), Dandy-Walker syndrome, or Trisomy 13. In the most serious cases, infant death is the expected outcome.
7 In 2002, health care spending in the United States represented 14.6 percent of the gross domestic product (GDP) (Anderson, Hussey, Frogner, & Waters, 2005). According to the National Coalition on Healthcare, by 2012, total health care spending in the United States will represent over 17 percent of the GDP (Heffler et al., 2003). The Organization for Economic Cooperation and Development reported that in 2005 Americans spent $6347 per capita on health care expenses, which is more than 46% higher than the country with the next highest per capita expenditure, Norway at $4328 (Organization for Economic Cooperation and Development, 2005). While Americans spend more than any other country for healthcare, the United States infant mortality ranking has fallen in recent years and continues to be higher than most other industrialized countries. For example, the United States‟ international ranking in infant mortality was 12th in 1960 and 23rd in 1990 (MacDorman & Mathews, 2008). The CIA World Factbook now estimates that the United States‟ ranking in 2009 will be 46th, well below other similarly industrialized nations like Japan, Sweden, the United Kingdom, and even Cuba (Central Intelligence Agency, 2008). The infant mortality rate among blacks in Shelby County,
Tennessee is 19.0 per 1,000 live births, which is similar to countries like the Solomon Islands, a group of islands in the South Pacific Ocean, east of Papua New Guinea, and Armenia, a member of the former Soviet Union (Central Intelligence Agency, 2008; Tennessee Department of Health, 2008). Oddly enough the infant mortality in the capital of the United States, the District of Columbia, is routinely ranked at the bottom of the list. The infant mortality rate there in 2005 among African Americans was approximately 17.2 per 1,000 live births, a rate comparable to the infant mortality in Thailand (Central Intelligence Agency, 2008; Mathews & MacDorman, 2008).
9 0 50 100 150 200 250
1850 1860 1870 1880 1890 1900 1910
1 9 1 5 -1 9 1 9 2 0 -2 4 1 9 2 5 -2 9 1 9 3 0 -3 4 1 9 3 5 -3 9
1940 1941 1942 1943 1944 1945 1946 1947 1948 1949 1950 1951 1952 1953 1954 1955 1956 1957 1958 1959 1960 1961 1962 1963
Year D e a th s p e r 1 ,0 0 0 l iv e b ir th
Overall Infant Mortality White Black/Non-White Figure 2. Infant Mortality 1850-1963
10 0 5 10 15 20 25
1980 1981 1982 1983 1984 1985 1986 1987 1988 1989 1990 1991 1992 1993 1994 1995 1996 1997 1998 1999 2000 2001 2002 2003 2004 2005 Year D e a th s p e r 1 ,0 0 0 l iv e b ir th s
Overall Infant Mortality White Black/Non-White
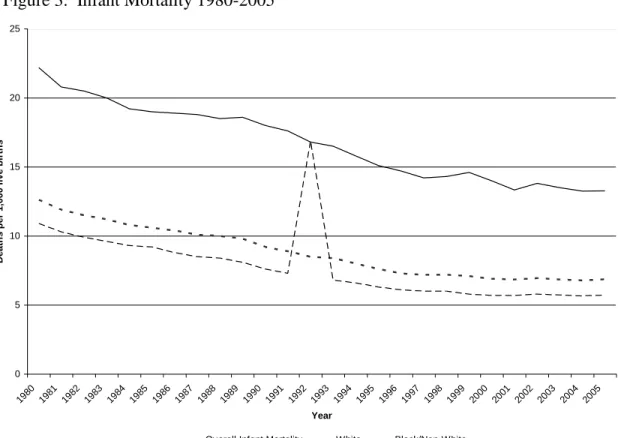
Figure 3. Infant Mortality 1980-2005
Figure 3. From Infant mortality and low birth weight among black and white infants--United States, 1980-2000. (2002). MMWR Morb Mortal Wkly Rep, 51(27), 589-592.
Burden of infant mortality across regions
11 states with various racial, ethnic, and socioeconomic characteristics. For example, when
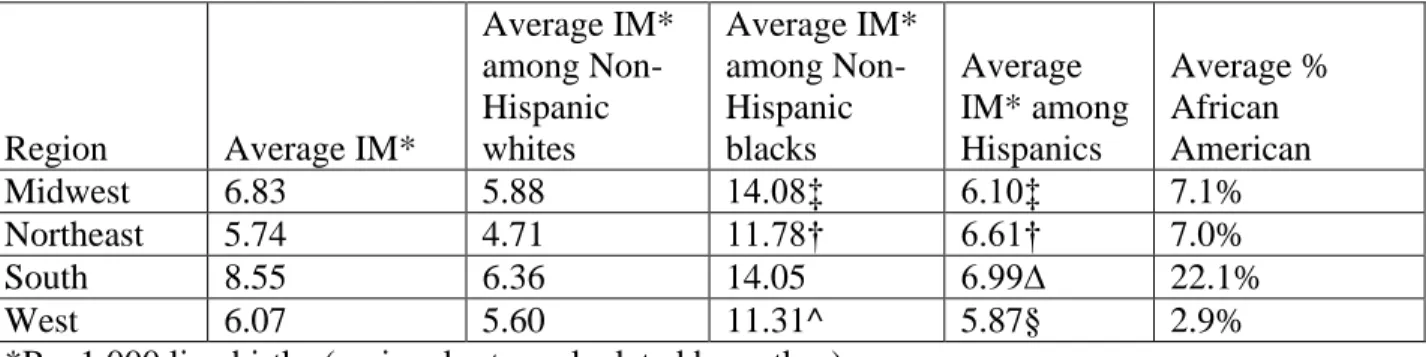
comparing the regional racial picture, the average proportion of the population that is African American varies from 2.9% in the West to 22.1% in the South. An analysis of infant mortality by region (Table 1) shows that these regional demographic differences also correlate to racial trends in infant mortality.
Table 1. Regional and Racial Differences in Infant Mortality (IM)
Region Average IM*
Average IM* among Non-Hispanic whites Average IM* among Non-Hispanic blacks Average IM* among Hispanics Average % African American
Midwest 6.83 5.88 14.08‡ 6.10‡ 7.1%
Northeast 5.74 4.71 11.78† 6.61† 7.0%
South 8.55 6.36 14.05 6.99∆ 22.1%
West 6.07 5.60 11.31^ 5.87§ 2.9%
*Per 1,000 live births (regional rates calculated by author)
From Mathews, T. J., & MacDorman, M. F. (2008). Infant mortality statistics from the 2005 period linked birth/infant death data set. Natl Vital Stat Rep, 57(2), 1-32.
‡ No data available from North Dakota and South Dakota due to less than 20 deaths † No data available from Maine, New Hampshire, and Vermont due to less than 20 deaths ∆ No data available from Delaware, Mississippi, and West Virginia due to less than 20 deaths ^ No data available from Alaska, Idaho, Montana, Utah, and Wyoming due to less than 20 deaths § No data available from Alaska, Montana, and Wyoming due to less than 20 deaths
12 than the national rate. Five of the 12 states (Iowa, Minnesota, Nebraska, North Dakota, and Wisconsin) that make up the Midwest have infant mortality rates lower than the national rate.
The Northeast. The Northeast has the lowest regional infant mortality rate at 5.74 per 1,000 live births. The infant mortality rates in this region range from 4.89 per 1,000 live births in Massachusetts to 7.30 per 1,000 live births in Pennsylvania. Of the nine states that make up the region, eight have infant mortality rates below 6.83 per 1,000 live births. Only Pennsylvania has a higher infant mortality rate.
The South. The South has the highest infant mortality compared to other regions, with an average infant mortality of 8.55 per 1,000 live births. Of the 17 Southern states, only two (Texas and Kentucky) have infant mortality rates lower than the national rate, at 6.45 and 6.79 per 1,000 live births, respectively. The District of Columbia and the state of Mississippi have the highest infant mortality rates, among the southern and all other states, at 12.22 and 10.74 per 1,000 live births, respectively.
The West. The West has the second lowest infant mortality compared to other regions,
with an average infant mortality of 6.07 per 1,000 live births. Of the 13 states that make up the West, only one state, Wyoming, has an infant mortality rate higher than national rate at 6.95 per 1,000 live births.
Racial and regional differences
13 states the proportion of the population that is African American ranges from 25% to 37%.
Conversely, the proportion of the population that is African American is approximately seven percent in the Northeast and Midwest regions. States in the West have the lowest proportion of African Americans with an average percentage of 2.9%. Nevada and California have the largest proportion of African Americans, with 7.3 and 6.3% respectively.
History of Regional Differences
The Great Migrations. The regional distribution of African Americans is a direct
reflection of the history of the United States. In 1787 Congress passed the Northwest Ordinance, written by Thomas Jefferson, which outlawed slavery and involuntary servitude in the territories north and west of the Ohio River, making the future states of Ohio, Michigan, Indiana, Illinois, and Wisconsin „free‟ states. Soon after, states in the Upper south -- Virginia, Maryland and North Carolina -- passed legislation making it easier for owners to free their slaves. Prior to the Civil War in 1860, the highest concentration of African Americans was in the South. Nearly 90 percent of the African American population lived in the South (Table 2), where they were mostly used as slaves for the agricultural economy, based on products like cotton, sugar cane, and tobacco (Franklin & Moss, 2000; U.S. Census Bureau, 1980). By the beginning of the 19th century there were rapidly growing communities of free blacks in most Northern states (Earle, 2000). In 1860, there were 155,983 free blacks in the Northeast, mostly in cities like New York and Philadelphia, both of which had well-established free black populations, where they most often worked as skilled laborers and household servants (Earle, 2000; Franklin & Moss, 2000; U.S. Census Bureau, 1980).
14 lived in the South. Around this time, however, large numbers of African Americans started migrating North and West looking for better job opportunities and living conditions and also to escape Jim Crow laws facing them in the South. Many found jobs in major cities in the Midwest and Northeast (Franklin & Moss, 2000; Mandle, 1992). From 1870-1930, over 1.6 million African Americans migrated from the South, with the greatest migration between 1920 and 1930 when 749,000 African Americans left the South (Shinagawa & Jang, 1998). These population trends remain now, with the greatest proportion of African Americans remaining in the South and the lowest proportion in the West.
While these population trends are the direct result of the history of each region and the United States as a whole, the healthcare trends that follow them are based on a racial health disparity that is seen in almost every health indicator collected and reported by agencies like the CDC and the Department of Health and Human Services. Some key health disparities include the following:
African Americans are two times more likely to die from diabetes mellitus
African Americans are five times more likely to die from assault (homicide)
African American men have a 30% higher rate of death from prostate cancer compared to
white men
The HIV death rate among African Americans is nine times higher than whites (18.0 per
100,000 vs. 2.2 per 100,000)
African Americans have a 60% higher rate of death due to essential hypertension and
15 Table 2. Regional historical population counts of African Americans, 1790-1900
Year U.S. (free/slave) Northeast South Midwest West
1790 59527/697681 27070/40354 32457/657327
1800 108435/893602 46696/36370 61329/857097 500/135 1810 186446/1191362 75156/27081 107660/1160977 3630/3304 1820 233634/1538022 92723/18001 133980/1508692 6931/11329 1830 319599/2009043 122434/2780 181501/1980384 15664/25879 1840 386293/2487355 141559/765 213991/2427986 30743/58604
1850 434495/3204313 149526/236 235569/3116629 48185/87422 1215/26 1860 488070/3953760 155983/18 258346/3838765 69291/114948 4450/29
1870 4880009 179738 4420811 273080 6380
1880 6580793 229417 5953903 385621 11852
1890 7488676 269906 6760577 431112 27081
1900 8833994 385020 7922969 495751 30254
From Gibson, C., & Jung, K. (2002). Historical Census Statistics on Population Totals By Race, 1790 to 1990, and By Hispanic Origin, 1970 to 1990, For The United States, Regions, Divisions, and States, Working Paper Series No. 56. Washington, DC: U.S. Census Bureau.
16 the Healthy People 2010 goal of 4.5 per 1,000 live births (U.S. Department of Health and Human Services, 2000).
The disparity is also seen in states with a low proportion of African Americans in the population. For example, in the state of Kansas, in which only about 6% of the population self-identifies as Black or African American, the infant mortality among African Americans is twice as high as that for non-Hispanic whites and Hispanics. The trend continues in southern states with smaller African American populations, like Tennessee, in which only 16% of the population is African American, but the infant mortality rate among this same group is nearly three times the national rate at 16.3 per 1,000 live births. Even more populous states like New York and California show this same pattern of disparity, with infant mortality rates among whites at 4.65 and 4.63 respectively, while the infant mortality among blacks in these states are 11.77 and 11.4. This disparity is exhibited in every state in which reliable data can be collected and reported. Impact of infant mortality on public health
The burden of infant mortality has substantial costs to both individuals and society as a whole. Not only are families and communities affected by the death of an infant, the loss of life represented by a high infant mortality also quantifies the way this country cares for its most vulnerable citizens, the infants who represent the future.
From 1980 to 2000, technological advances in neonatal intensive care pushed back the gestational age of viability. Now the majority of tertiary care neonatal intensive care units have the capacity to care for infants born as early as 23 weeks‟ gestation. While the technology is available to care for these tiny infants, the extraordinary cost of their care has become a burden to the healthcare system. The March of Dimes reports that a full-term delivery without
17 amount at $41,610. The care for many of these infants is paid for by Medicaid; approximately one-third of all births are paid for by Medicaid. Many of these costs are underreimbursed and represent uncollected costs to healthcare providers. In addition, of the infants that do survive to be discharged from the neonatal intensive care unit, many will have physical, mental, and emotional development delays that will require ongoing costs to the community and state in terms of medical and educational services, as well as loss of potential. Preventing prematurity and associated deaths is imperative both to improve the health and healthcare of women and children, and curtail the rising cost of medical care in the United States.
Theories for the disparity
In the past, researchers have often sought the magic bullet or one-stop solution to the problem of infant mortality in the United States and the racial and ethnic disparities that exist. There are many theories that attempt to identify the one or two risk factors that predict the chances of having an infant die before the age of one year. For example, Wilcox and Russell have hypothesized that maternal age, which can influence birth weight, directly affects infant mortality (Wilcox & Russell, 1990). Gage and colleagues report that infant mortality tended to decline with maternal age to a minimum and then increase again at older ages, resulting in a J-shaped curve in which the youngest and oldest mothers are at greatest risk (Gage et al., 2009).
18 African-born women were almost identical. US-born black women had birth weights averaging 357 and 244 grams less compared to United States-born white and African-born women,
respectively (David & Collins, 1997).
Lu and Halfon have introduced another model to explain the disparities in pregnancy outcomes between white and black women (Lu & Halfon, 2003). This model called the Life-Course Conceptual Model explains that the difference in low birth weight rates results from the higher rates of pre-pregnancy risk factors and the low rate of protective factors among African Americans compared to whites. Lu and Halfon explain that in this model pre-pregnancy risk factors work against protective factors to determine a woman‟s reproductive potential. In the case of African American women the risk factors, such as social stressors and discrimination, overpower the potential protective factors like high socioeconomic status. In addition, protective factors like high income have less of a protective effect in African-American women compared to white women. African American women may even choose to reside in neglected communities in exchange for the protective effect of community cohesiveness. Living in more affluent
communities, with the possibility of discrimination and isolation, may be less desirable among African Americans. In this model these life course factors affect pregnancy outcomes by fetal programming of reproductive potential and collective wear and tear known as weathering. Stress and the physiologic response to it are the underlying mechanism for both.
19 hormone and cortisol) when they experience stress. The presence of these hormones leads to greater risk of preterm labor. In addition this heightened response can lead to loss of the signal to terminate the stress response leading to long-term exposure to higher amounts of stress
hormone, called allostatic load (Lu & Halfon, 2003). Higher allostatic loads, commonly found in African Americans and/or lower social class populations, are related to other health conditions including ischemic heart and periodontal disease (Geronimus, Hicken, Keene, & Bound, 2006; Logan & Barksdale, 2008; Sabbah, Watt, Sheiham, & Tsakos, 2008).
Weathering is based on the hypothesis that there are physiologic responses and
consequences to social inequality and discrimination experienced throughout a woman‟s life. Geronimus and others have shown that among white women, being very young or over the age of 40 increases the chances of low birth weight (Geronimus, 1996; Geronimus et al., 2006). However, among African-American women, rates of low birth weight increase in their late twenties and early thirties (Collins, Simon, Jackson, & Drolet, 2006; Geronimus, 1996). Weathering coincides with life-long residence in low-income neighborhoods. The weathering phenomenon is not shown and low birth weight rates do not increase with maternal age among women who have lived their lives in high-income neighborhoods. In fact, African-American women in their early thirties with life-long residence in high-income neighborhoods had half the low birth weight rates of African-American women in their early thirties with life-long residence in low-income neighborhoods.
Collins and colleagues used the validated Perceived Racism Scale through an
20 very low birth weight infant were more likely to have experienced racial discrimination
compared to African-American women who had delivered a non-low birth weight infant
(Collins, David, Handler, Wall, & Andes, 2004). Discrimination appeared to have the strongest effect on women aged 20-29 years and was reduced or absent among teenaged women and women in their 30s. The adjusted odds ratio for very low birth weight associated to maternal exposure to racism in one or more and three or more domains were 1.7 (95% CI: 1.0,9.2) and 2.6 (95% CI: 1.2,5.3) respectively (Collins et al., 2004). Interestingly, discrimination was more strongly associated to very low birth weight among women with more than 12 years of
education. Collins and colleagues suggest that in order to truly close the racial gap in low birth weight and therefore infant mortality one must take “a life-course approach, addressing early life disadvantages in addition to lifelong exposure to neighborhood poverty, interpersonal racial discrimination, and job strain” (Collins & David, 2009).
Current interventions and their potential for reducing the disparity
Research on the use of tocolytics, to stop uterine contractions in an effort to prevent preterm birth, dates back to the 1960s. These medications have been used widely for nearly 40 years, but have not been associated with the expected reductions in preterm births or infant mortality. Clinically, tocolytics are effective at prolonging a pregnancy for up to 48 hours, in order to give steroids adequate time to mature fetal lung development but not beyond (Di Renzo, Al Saleh, Mattei, Koutras, & Clerici, 2006).
Medical research by Romero and colleagues has resulted in a theory termed a preterm parturition syndrome (Romero et al., 2006). This condition, while just a physiologic finding of full-term labor, is pathologic in preterm labor. This syndrome includes the following
21
Intrauterine infection/inflammation
Uterine ischemia
Abnormal allograft reaction (the woman‟s body tries to reject the fetus as foreign
tissue)
Allergy
Cervical insufficiency
Hormonal disorders
These conditions prepare a woman‟s body for full-term labor; however, when started
prematurely, this cascade often leads to premature labor and the birth of a low birth weight infant at much higher risk of infant mortality (Clark et al., 2006; Di Renzo et al., 2006; Hui et al., 2007; Simhan & Caritis, 2007).
As another strategy to prevent preterm birth, local and state governments, with financial support from federal government, have worked to improve access to prenatal care for poor and low-income women, by allowing pregnant women to have presumptive eligibility for Medicaid. However, in 2004, the state of Mississippi implemented more restrictive eligibility requirements, as well as requiring that Medicaid recipients have an annual in-person meeting with a Medicaid administrator. When interviewed by CBS News correspondent Kelly Wallace, local women in Hollandale, Mississippi, reported that the process of using the Medicaid benefit often requires completing several pages of documentation and travel to a central location or Medicaid office from rural areas, where there is no convenient mode of public transportation, which they often cannot afford.("Mississippi's Rising Infant Mortality Rate," 2007)
22 their health both prior to and during a pregnancy, the potential for poor birth outcomes is
increased (Poma, 1999; VanderWeele, Lantos, Siddique, & Lauderdale, 2009). In addition, genetic testing and ultrasounds that could detect congenital conditions, length of gestation, and amniotic fluid or growth abnormalities also will not happen. These deficits in prenatal care and screening therefore contribute to the first and second leading causes of infant mortality among white and black women, respectively. While many of these programs, that allow for the
expansion of care to low-income women are viewed as costly, they are often equal to or less than the cost of covering the care of infants in the neonatal intensive care units or the emotional costs of infant death.
Sudden Infant Death Syndrome (SIDS). Sudden infant death syndrome is defined as the unexpected death of an infant in the absence of a definitive cause of death (Willinger, James, & Catz, 1991). Studies have reported that African-American infants die more frequently from SIDS due to being placed on their stomachs rather than on their backs, as recommended by the National Institute of Child Health and Human Development‟s “Back to Sleep” campaign.
Evaluation of the public health campaigns that emphasize the need to place infants on their backs have reportedly reduced the incidence of SIDS by 56% (Hoyert, Heron, Murphy, & Kung, 2006; Malloy, 2002; Pollack & Frohna, 2002; Sullivan & Barlow, 2001; Willinger et al., 1998). Although these programs have had some success, SIDS still remains the leading cause of post-neonatal (>28 days) deaths. In addition, these programs appear to be least likely to change the infant sleep positioning practices among African Americans, who have a two-fold greater incidence of SIDS (Figure 3) than non-Hispanic whites.
Accidents and Unintentional Injury. Accidents and unintentional injury are the fifth and
23 respectively. Among these, there exists a subgroup of deaths termed accidental suffocation and strangulation in bed. These deaths are the leading cause of death among injury-related deaths. Shapiro-Mendoza and colleagues reported that the rate of accidental suffocation and
strangulation in bed appear to be increasing, by approximately 14 percent annually from 1996 to 2004 (Shapiro-Mendoza, Kimball, Tomashek, Anderson, & Blanding, 2009). These deaths are many times characterized as potentially preventable. The most common mechanisms of accidental suffocation and strangulation in bed include:
Soft bedding, pillows, or waterbeds
Rolling on top of or against infants while sleeping
Infants trapped between objects such as a mattress and wall or furniture
Asphyxiation when an infant‟s head and neck becoming lodged between crib railings
To date there have been few national campaigns on the scale of the “Back to Sleep” campaign to address these often preventable deaths. However, a potential intervention would need to raise awareness and provide information warning of the dangers of sleeping with infants and the purchase of and proper use of infant bedding and furniture.
Discussion and Recommendations for Action
While awareness of the problem of infant mortality has grown in recent years, so too have practices that appear to be counterproductive to making large reductions in the infant mortality rate. As previously mentioned, efforts to curtail budget deficits by adding restrictions to potential Medicaid-eligible individuals often reduces the numbers of people who use
24 Although, there was no follow-up story of the young woman interviewed for the CBS News piece in 2007, one can only hope that she did not arrive at a hospital in Mississippi, in preterm labor without having received even one prenatal visit.
The restrictions placed on Medicaid eligibility are politically and financially driven, however some issues related to infant mortality are related to the environment and geography of a location. Again, the CBS News piece points to the problem of rurality and how it affects access to care. Unlike many major metropolitan areas of the West, Northeast, and Midwest, the South, with the exception of very large cities like Atlanta, is lacking in widespread use of public transportation. Oftentimes residents without a personal means of transportation are forced to rely on the kindness of friends and family to get to doctors‟ and Medicaid appointments. Though not necessarily considered part of traditional public health, policies and infrastructure that take into account the tremendous complexities that exist in accessing health care services, may
complement public health strategies to reduce infant mortality. Measures should be taken to ensure not only the quality of the prenatal care, but also to guarantee that the women and their children have adequate transportation to and from their appointments. In addition efforts should be made to locate services, especially Medicaid enrollment and medical services, closer to the women who need them. For services that cannot be moved to accommodate the most women, transportation services should be implemented at little or no cost to allow these women to receive these services.
25 accidents, most often shaken baby or motor vehicle accidents, would reduce the number of infant deaths by over ten percent (Mathews & MacDorman, 2008). Other campaigns include car seat safety campaigns, often spearheaded by local fire and police departments, which seek to prevent infant and child injuries and deaths as a result of motor vehicle accidents. The success of these efforts ensures that communities receive information and assistance to protect their infants.
While there are many specific state and local initiatives that have been and will continue to be key drivers in the effort to reduce infant mortality overall and close the racial and ethnic disparities, there are three national efforts that through continued support and future expansion by the federal government and organizations such as the American College of Obstetricians and Gynecologists will one day help Americans reach the fast approaching Healthy People 2010 goal of reducing infant mortality to 4.5 per 1,000 live births.
The first effort is the National Institute of Child Health and Human Development‟s “Back to Sleep” campaign. This campaign started in the late 1990s after research pointed to the lower rate of SIDS deaths among infants who were placed on their backs to sleep. While this campaign has led to increased placement of infants on their backs, there is evidence that this practice is still seen as foreign and counterintuitive among some racial and ethnic groups, especially African Americans. Future efforts will need to focus on making the message of “back to sleep” relevant to African American mothers. Indeed, it is often the fact that this practice goes against
26 Similar to the “Back to Sleep” campaign, the National Center on Shaken Baby Syndrome (www.dontshake.org) has begun the “Period of PURPLE Crying”® program. This is an
evidence-based shaken baby syndrome prevention program that includes a booklet, available in nine languages, and a brief DVD, also available with closed captioning. Currently the booklet and DVD are part of a randomized controlled trial of over 4400 parents of new infants in Seattle, Washington and Vancouver, British Columbia in order to identify the signs of frustration that often result from what can seem like the incessant and unanswerable crying of an infant, that can lead to shaken baby syndrome. The results of this study are not currently available, as it is the first program of its kind, so the public health community waits to find out if this program can reduce the serious and often deadly consequences of shaken baby syndrome. If this program is shown to be a success, this information and its principles should initially be made available to all high-risk parents. Finally, a national campaign, on the scale of the “Back to Sleep” program should be undertaken by public health leaders at government institutions like the National Institute of Child Health and Human Development.
Finally the Fetal and Infant Mortality Review (FIMR) system is an innovative,
27 information gathering, 2) policy development, by using the FIMR results to influence local and even state policies, and 3) assurance, through open communication with FIMR participants about the results of the process. Currently local FIMR groups are started when the local public health leaders are interested in the topic. In the future, each state should implement a FIMR project, using similar principles so that the data collected across the nation will be able to be collected and compared. The knowledge gained through the analysis of this data can lead to more
concrete and specific initiatives that solve the problem of infant mortality in a more efficient and practical method.
Conclusion
28 References
Anderson, G. F., Hussey, P. S., Frogner, B. K., & Waters, H. R. (2005). Health spending in the United States and the rest of the industrialized world. Health Aff (Millwood), 24(4), 903-914.
Ansley, J., Zelnick, M., & Zelnick, C. (1963). New Estimates of Fertility and Population in the United States: Princeton University Press.
Bruner, J. P. (2003). In their footsteps: a brief history of maternal-fetal surgery. Clin Perinatol, 30(3), 439-447.
Central Intelligence Agency. (2008). World Factbook. Washington, DC: Central Intelligence Agency.
Clark, K., Ji, H., Feltovich, H., Janowski, J., Carroll, C., & Chien, E. K. (2006). Mifepristone-induced cervical ripening: structural, biomechanical, and molecular events. Am J Obstet
Gynecol, 194(5), 1391-1398.
Collins, J. W., Jr., & David, R. J. (2009). Racial disparity in low birth weight and infant mortality. Clin Perinatol, 36(1), 63-73.
Collins, J. W., Jr., David, R. J., Handler, A., Wall, S., & Andes, S. (2004). Very low birthweight in African American infants: the role of maternal exposure to interpersonal racial
discrimination. Am J Public Health, 94(12), 2132-2138.
Collins, J. W., Jr., Simon, D. M., Jackson, T. A., & Drolet, A. (2006). Advancing maternal age and infant birth weight among urban African Americans: the effect of neighborhood poverty. Ethn Dis, 16(1), 180-186.
29 Davidoff, M. J., Dias, T., Damus, K., Russell, R., Bettegowda, V. R., Dolan, S., et al. (2006).
Changes in the gestational age distribution among U.S. singleton births: impact on rates of late preterm birth, 1992 to 2002. Semin Perinatol, 30(1), 8-15.
Di Renzo, G. C., Al Saleh, E., Mattei, A., Koutras, I., & Clerici, G. (2006). Use of tocolytics: what is the benefit of gaining 48 hours for the fetus? BJOG, 113 Suppl 3, 72-77. Dizon-Townson, D. S. (2001). Preterm labour and delivery: a genetic predisposition. Paediatr
Perinat Epidemiol, 15 Suppl 2, 57-62.
Earle, J. H. (Ed.). (2000). The Routledge Atlas of African American History New York: Routledge.
Franklin, J. H., & Moss, A. A. (2000). From slavery to freedom: a history of African Americans
(8th ed.). New York: Alfred A. Knopf.
Gage, T. B., Fang, F., O'Neill, E., & Stratton, H. (2009). Maternal age and infant mortality: a test of the Wilcox-Russell hypothesis. Am J Epidemiol, 169(3), 294-303.
Geronimus, A. T. (1996). Black/white differences in the relationship of maternal age to birthweight: a population-based test of the weathering hypothesis. Soc Sci Med, 42(4), 589-597.
Geronimus, A. T., Hicken, M., Keene, D., & Bound, J. (2006). "Weathering" and age patterns of allostatic load scores among blacks and whites in the United States. Am J Public Health, 96(5), 826-833.
Hagberg, B., Hagberg, G., Beckung, E., & Uvebrant, P. (2001). Changing panorama of cerebral palsy in Sweden. VIII. Prevalence and origin in the birth year period 1991-1994. Acta
30 Hamilton, B. E., Martin, J. A., & Ventura, S. J. (2007). Births: preliminary data for 2006. Natl
Vital Stat Rep, 56(7), 1-18.
Heffler, S., Smith, S., Keehan, S., Clemens, M. K., Won, G., & Zezza, M. (2003). Health spending projections for 2002-2012. Health Aff (Millwood), Suppl Web Exclusives, W3-54-65.
Hoyert, D. L., Heron, M. P., Murphy, S. L., & Kung, H. C. (2006). Deaths: final data for 2003.
Natl Vital Stat Rep, 54(13), 1-120.
Hui, D., Liu, G., Kavuma, E., Hewson, S. A., McKay, D., & Hannah, M. E. (2007). Preterm labour and birth: a survey of clinical practice regarding use of tocolytics, antenatal corticosteroids, and progesterone. J Obstet Gynaecol Can, 29(2), 117-130.
Infant mortality and low birth weight among black and white infants--United States, 1980-2000. (2002). MMWR Morb Mortal Wkly Rep, 51(27), 589-592.
Krieger, N. (1990). Racial and gender discrimination: risk factors for high blood pressure? Soc
Sci Med, 30(12), 1273-1281.
Logan, J. G., & Barksdale, D. J. (2008). Allostasis and allostatic load: expanding the discourse on stress and cardiovascular disease. J Clin Nurs, 17(7B), 201-208.
Lu, M., & Halfon, N. (2003). Racial and ethnic disparities in birth outcomes: a life-coursee perspective. Matern Child Health J, 7(1), 13-30.
31 Malloy, M. H. (2002). Trends in postneonatal aspiration deaths and reclassification of sudden
infant death syndrome: impact of the "Back to Sleep" program. Pediatrics, 109(4), 661-665.
Mandle, J. R. (1992). Not slave, not free: the African American economic experience since the
Civil War. Durham: Duke University Press.
Mathews, T. J., & MacDorman, M. F. (2008). Infant mortality statistics from the 2005 period linked birth/infant death data set. Natl Vital Stat Rep, 57(2), 1-32.
McNeilly, M. D., Anderson, N. B., Armstead, C. A., Clark, R., Corbett, M., Robinson, E. L., et al. (1996). The perceived racism scale: a multidimensional assessment of the experience of white racism among African Americans. Ethn Dis, 6(1-2), 154-166.
Mississippi's Rising Infant Mortality Rate (2007). CBS Evening News. US: CBS News.
Organization for Economic Cooperation and Development. (2005). 2005 Total expenditure on health per capita (in U.S. dollars). Retrieved February 27, 2009, from
http://stats.oecd.org/WBOS/Index.aspx?DatasetCode=CSP2008
Pitkin, R. M. (2007). Folate and neural tube defects. Am J Clin Nutr, 85(1), 285S-288S.
Pollack, H. A., & Frohna, J. G. (2002). Infant sleep placement after the back to sleep campaign.
Pediatrics, 109(4), 608-614.
Poma, P. A. (1999). Effect of prenatal care on infant mortality rates according to birth-death certificate files. J Natl Med Assoc, 91(9), 515-520.
Racial/ethnic differences in the birth prevalence of spina bifida - United States, 1995-2005. (2009). MMWR Morb Mortal Wkly Rep, 57(53), 1409-1413.
32 Sabbah, W., Watt, R. G., Sheiham, A., & Tsakos, G. (2008). Effects of allostatic load on the
social gradient in ischaemic heart disease and periodontal disease: evidence from the Third National Health and Nutrition Examination Survey. J Epidemiol Community
Health, 62(5), 415-420.
Shapiro-Mendoza, C. K., Kimball, M., Tomashek, K. M., Anderson, R. N., & Blanding, S. (2009). US infant mortality trends attributable to accidental suffocation and strangulation in bed from 1984 through 2004: are rates increasing? Pediatrics, 123(2), 533-539.
Shinagawa, L. H., & Jang, M. (1998). Atlas of American Diversity. Walnut Creek, CA: AltaMira Press.
Simhan, H. N., & Caritis, S. N. (2007). Prevention of preterm delivery. N Engl J Med, 357(5), 477-487.
Sullivan, F. M., & Barlow, S. M. (2001). Review of risk factors for sudden infant death syndrome. Paediatr Perinat Epidemiol, 15(2), 144-200.
Tennessee Department of Health. (2008). Death Certificate Data (Tennessee Resident Data) Shelby County, TN. Retrieved February 27, 2009, from
http://hit.state.tn.us/InfMort10detail.aspx
U.S. Census Bureau. (1975). Historical Statistics of the United States: U.S. Government Printing Office.
U.S. Census Bureau. (1980). The Social and Economic Status of the Black Population in the United States: An Historical View, 1790-1978. Washington, DC: Government Printing Office.
33 U.S. Department of Health and Human Services. (2000). Healthy People 2010, With
Understanding and Improving Health and Objectives for Improving Health (2nd ed.).
Washington, DC: U.S. Government Printing Office.
van den Oord, E. J. (2006). Ethnic differences in birth weight: maternal effects emerge from an analysis involving mixed-race us couples. Ethn Dis, 16(3), 706-711.
VanderWeele, T. J., Lantos, J. D., Siddique, J., & Lauderdale, D. S. (2009). A comparison of four prenatal care indices in birth outcome models: comparable results for predicting small-for-gestational-age outcome but different results for preterm birth or infant mortality. J Clin Epidemiol, 62(4), 438-445.
Wilcox, A., & Russell, I. (1990). Why small black infants have a lower mortality rate than small white infants: the case for population-specific standards for birth weight. J Pediatr, 116(1), 7-10.
Williams, L. J., Mai, C. T., Edmonds, L. D., Shaw, G. M., Kirby, R. S., Hobbs, C. A., et al. (2002). Prevalence of spina bifida and anencephaly during the transition to mandatory folic acid fortification in the United States. Teratology, 66(1), 33-39.
Willinger, M., Hoffman, H. J., Wu, K. T., Hou, J. R., Kessler, R. C., Ward, S. L., et al. (1998). Factors associated with the transition to nonprone sleep positions of infants in the United States: the National Infant Sleep Position Study. JAMA, 280(4), 329-335.