Lauren R. Tomola. Alternatives to Email: Increasing Digital Teams’ Use of Collaborative Tools. A Master’s Paper for the M.S. in L.S degree. June, 2012. 76 pages. Advisor: Stephanie W. Haas
This study explores whether the combination of a structured wiki and a tagging
vocabulary create a more effective digital collaborative space than email communication, for both current collaboration needs and the retrieval of past collaboration information. To test this, I added a predefined tagging vocabulary and collaboration nodes to the North Carolina Area Health Education Centers’ underused wiki. The methods involved tracking the NC AHEC team’s email and wiki communication for two months after
implementation of the redesigned wiki and comparing this data to retroactively collected use of wiki and email for ten months prior to implementation. The study also included surveys before and after the study, addressing subjects’ attitudes towards wikis and tagging.
The subjects’ overall use of both communication tools decreased, but due to several potential factors, the cause could not be determined. The study results were inconclusive.
Headings:
Tags (Metadata)
Wikis (Computer science) -- Library applications E-mail
by
Lauren R. Tomola
A Master’s paper submitted to the faculty of the School of Information and Library Science of the University of North Carolina at Chapel Hill
in partial fulfillment of the requirements for the degree of Master of Science in
Library Science.
Chapel Hill, North Carolina June 2012
Approved by
Table of Contents
Alternatives to email: increasing digital teams’ use of collaborative tools ... 2
I. Introduction ... 3
II. Literature Review... 5
2.1 Digital collaboration ... 5
2.1.1 Knowledge management tools: underuse and overuse ... 5
2.1.2 Email and wikis... 6
2.1.3 Tags as an information retrieval method ... 8
2.2 NC AHEC and Electronic Health Records ... 10
III. Methods... 12
3.1 Study overview ... 13
3.2 Part A: Survey ... 17
3.3 Part B: Monitoring Data Logs ... 18
IV. Results ... 23
4.1 Adjustments to the data set prior to calculations... 23
4.1.1 Removal of researcher data ... 23
4.1.2 Shortened control period ... 24
4.1.3 Combination of categories ... 25
4.2 Data Monitoring Results ... 26
4.2.1 Type of use: tool ... 28
4.2.2 Type of use: collaborative or querying ... 30
4.2.3 Type of use: existing information ... 31
4.2.4 Type of use: overview ... 33
4.2.5 Action ... 34
4.2.6 Category ... 38
4.2.7 Pattern of use: all uses... 42
4.2.8 Pattern of use: unique users ... 43
4.3 Survey Results ... 46
4.3.1 Initial Survey ... 47
4.4 Summary of Results ... 50
V. Discussion ... 51
5.1 Inconclusive changes... 51
5.1.1 Data monitoring ... 51
5.1.2 Survey ... 55
5.2 Contributing factors... 57
5.2.1 Fluctuations in activity levels ... 57
5.2.2 Disinterest in active use of the wiki ... 58
5.2.3 Possible information retrieval improvements ... 59
VI. Conclusions ... 61
Bibliography ... 63
Appendices ... 65
7.1 Appendix 1: Surveys ... 65
7.1.1 Initial Survey ... 65
7.1.2 Concluding Survey... 68
7.2 Appendix 2: Emails sent to subjects ... 71
7.2.1 Introductory email and Initial Survey recruitment... 71
I.
Introduction
How can digital teams use collaboration tools more effectively? This question needs to be asked, not just by libraries orchestrating spaces for users to work, but by any organization that uses teams of people working electronically rather than in person. A variety of tools exist to allow users to communicate about a project, but collaboration requires more than ephemeral discussion. In order to collaborate successfully, team members need a single space in which all collaborative work can be gathered, stored, and made searchable.
Organizations may gravitate to the use of email for collaborative work, but collaboration via email presents serious problems. When working collaboratively, users need to be able to communicate with other team members without losing threads of conversation or ending up with multiple simultaneously-made versions of projects. Despite the fast-paced, flexible nature of collaborative work, a team’s efforts must be documented and accessible, so that future users can locate answers about past
collaboration without forcing the team to waste time redoing a work process. A true solution to improving digital collaboration must address both the collaborative and querying aspects of the process.
members’ own definitions (Golder & Huberman, 2006), while a wiki provides a digital
location for consistency in collaboration across geographic distance and different work schedules (Decker, Ras, Rech, Jaubert, & Rieth, 2007).
However, research also suggests that in order for users to embrace these tools for effective collaboration, structure must be imposed (Decker et al., 2007; Reinhold, 2006; Guy & Tonkin, 2006). Taking this need for organization into account, this study concerns the effect of applying a defined structure to an organization’s collaborative tools in order
to increase the members’ preference for tools other than email.
To test this theory, I redesigned a long-distance team’s wiki, making it a more effective digital collaborative space by adding an organization-specific tagging
vocabulary and clearly defined collaboration nodes to the existing material. This study compares the team’s use of email and the wiki before and after implementation of the
changes, in order to determine whether adding the tagging vocabulary and collaboration nodes moved collaborative activity from email to the wiki. In addition to tracking the team’s use of communication tools, this study also includes a survey asking users to
evaluate their skill with wikis and tagging, issued before and after implementation of the redesigned wiki. The combination of data tracking the use of the two communication tools and the surveys addressing users’ attitudes should show whether the study caused
II.
Literature Review
2.1
Digital collaboration
Although digital collaboration seems easier than ever with the wide variety of electronic communication options available to organizations, creating a virtual space for collaboration is not as simple as adding technology to a team. Schweitzer and Duxbury (2010) dissect the idea of a team’s “degree of virtuality,” defining it by the amount of
geographic distance between team members, the time team members spend working asynchronously, and the time team members spend working digitally (p. 281-3). As these factors come together to increase the degree of virtuality, the effectiveness of the team’s
success at meeting project goals decreases, even among teams of talented, technology-savvy professionals (p. 289). Even as Schweitzer and Duxbury (2010) describe this phenomenon, they also point out that numbers of virtual teams are likely to increase in spite of their problems (p. 268).
2.1.1 Knowledge management tools: underuse and overuse
such an approach if the employees are unwilling to accept the technology imposed on them (p. 28). Desouza points out that although having useful technology is important, the most crucial aspect of knowledge management is convincing the users in the community to share what they know (p. 26).
While teams can create problems by too little use of knowledge management tools, they can also find potential complications in overuse of technology.
Karr-Wisniewski and Lu (2010) discuss the phenomenon of “technology overload,” the tipping point at which adding further technology begins to decrease productivity levels (p. 1061). Their study shows that “for high levels of technology dependence, there was a strong and significant inverse relationship between technology overload and productivity,” although
this effect became less significant the less dependent a job was on technology use (p. 1068). To prevent users from reaching the technology overload threshold, Karr-Wisniewski and Lu advise managers to consider investing in less complex tools or to provide significant amounts of training for tools with a wide range of features (p. 1069).
In order to be effective, the tools associated with a digital collaborative space need to give users reasons to participate, without becoming complicated enough to
creates the problems associated with the overuse of technology. If presented with updated and improved versions of existing tools, rather than an entirely new communication system, users might be more willing to use new technology, while still finding the tools familiar enough that they would not be overwhelmed.
2.1.2 Email and wikis
often try to force email to act as a platform for collaborative tasks, simply because they already understand the technology (p. 22). Although Smith primarily argues for
expanding the functions of email to turn the inbox into a digital archive (p. 25), teams trying to operate digitally may find overhauling an organization’s entire email system a less than ideal option. Jackson and Culjak (2006) point out that simply altering the form email takes will not work, because many problems apparently coming from technology actually arise from the emails themselves (p. 2). Their study demonstrates that in a professional context, users often unnecessarily copy messages, omit vital information, or do not compose clear messages (p. 6).
Jackson and Culjak (2006) suggest that to solve email-related problems, organizations need to train users to use email more effectively (p. 3). Training might improve the quality of emails, but it would not assist users with the problem of locating information from previous email exchanges. In an alternative suggestion, Smith (2006) proposes creating a separate location for collaborative work, with email acting as a notification system of changes to the collaborative space (p. 23), an option that would allow more flexibility among different user groups rather than a single standardized set of changes imposed on an entire organization.
The question then becomes “what format should this space for digital collaboration take?” The factors established by Schweitzer and Duxbury (2010), a group’s geographic distance and the amount of time team members spend working
Decker et al. (2007) notes that wikis allow the key collaborative tasks of allowing multiple users to edit the same single document and of creating collections of resources stored in different locations (p. 29), tasks which email is especially ill-equipped to handle (Smith, 2006, 23).
Although wikis are best known for being user-created, Decker’s study (Decker et al., 2007) argues that wikis are most effective when they have a defined structure in which users can place their content (p. 29-30). Reinhold’s paper (2006) elaborates on this idea, stating that while wiki growth occurs by users adding their own content into a static structure (p. 48), wikis also need additional navigation options for optimal performance (p. 49). Thus, in order to work effectively as a collaborative space for a team working digitally, a wiki would need a structure offering specific locations for collaboration and a method of finding wiki resources separately from the static browsing website.
2.1.3 Tags as an information retrieval method
Tagging is an intuitive method of allowing users to find resources that are otherwise organized. Golder and Huberman’s study (2006) states:
Collaborative tagging is the practice of allowing anyone – especially consumers – to freely attach keywords or tags to content. Collaborative tagging is most useful when there is no one in the ‘librarian’ role or there is simply too much content for
a single authority to classify. (p. 198)
outside force would be flexible enough to combine well with a wiki to create a user-centered collaborative environment.
User-defined tags are a relatively new concept in information retrieval, and the ways they can be used effectively are still being debated (Golder & Huberman, 2006; Guy & Tonkin, 2006; Morrison, 2007; Moulaison, 2008; Tsui, Wang, Cheung, & Lau, 2010). Research shows that, expectations to the contrary, user-defined tags achieve high levels of stability (Guy & Tonkin, 2006; Golder & Huberman, 2006, p. 205), meaning that such a system has the potential to be an effective way to locate materials. The greatest barrier to using tagging as a community’s retrieval process is that user-defined
tags are frequently personal, focusing more on creating a way for the individual user to return to the document rather than marking a trail for the community at large (Guy & Tonkin, 2006).
In their recent study, Tsui, Wang, Cheung, and Lau proposed that a way of using the information from social tagging without the problems of personal tags would be to incorporate tagging information into the creation of a taxonomy (Tsui et al., 2010, p. 45). This approach emphasizes the information gathered from the tags but dismisses the process of tagging itself. Such an approach would be appropriate in an academic environment, where accuracy in retrieval is prized most highly, but in a collaborative space used by a team, the action of tagging would be more important. Morrison (2007) points out that tagging can even work as a method of interacting with a website, encouraging users to interact with the space in other ways (p. 13). Enforcing too much structure on a taxonomy would remove some of the team members’ ability to control
This study proposes the opposite arrangement – the use of a predefined tagging vocabulary to create a basis for users to tag new materials. Golder & Huberman (2006) point out that popular tags tend to be used more frequently (p. 206), and Morrison (2007) says that spaces where tags are fully integrated into the platform have a better chance of the tags being used (p. 14). Jackson and Smith (2011) found in their study that when faced with retrieval by tagging as an alternative to browsing a file structure, users preferred tagging, given that the tags were organized and logical (p. 12). If a tagging system is put into place on existing materials showing how tags should be used to define a resource, users are likely to continue the tagging patterns in adding new tags to new materials.
Creating a digital space with a strong structure and flexible retrieval capabilities would make that space a good replacement for email as a location for collaborative activity. A wiki that combines a structure defining spaces for user collaboration with a predefined tagging vocabulary for material retrieval would fill this function, increasing use of the collaborative space and decreasing email use.
2.2
NC AHEC and Electronic Health Records
upcoming federally mandated conversion to the use of electronic health records, or EHRs (Maxson, Jain, Kendall, Mostashari, & Blumenthal, 2010, p. 666).
Health records are part of all aspects of medical work, giving order to events and creating a single place for all information about a patient (Berg, 1996). The study by Halford, Obstfelder, and Lotherington (2010) points out that “changing the record—here,
from paper to electronic—may not only change what health-care professionals do but may also change their understandings of work and self” (p. 211). Halford et al. (2010) go on to describe an example of a failed EHR implementation, in which a clinic took on new technology that clashed with its workflow and destabilized the entire organization (p. 219-220). The RECs were established because flawed implementations are the main cause of EHR failures, and every EHR implementation must be different, depending on the structure and climate of the clinic (Maxson et al., 2010, p. 669).
III.
Methods
To act as an effective alternative to email, a digital collaborative space must provide ways for users to retrieve information related to past collaboration and to
participate in ongoing collaborative activities. I have defined the ability of users to locate relevant information as the “querying” aspect of digital communication, while interacting with the space to communicate information to others is the “collaborative” aspect of
digital communication.
“Querying” actions could involve asking a question to other users directly, either
by emailing the entire user community or by using a wiki tool, or attempting to locate information by other methods, such as using a search engine, browsing through files, referring to older materials, or downloading files. “Collaborative” actions would include any action meant to share information with others, such as emailing the user community or adding information to the wiki. Using these definitions, all a user’s actions with email or a wiki can be classified as either “querying” or “collaborative.”
Adding a tagging vocabulary and collaboration nodes to a digital space should make it a more effective tool for both the querying and collaborative aspects of communication. The improved information retrieval made possible by the tagging vocabulary would allow users to locate information more accurately, and the
collaboration nodes for each major topic would create a clear and inviting place for users to add their contributions to the space.
space or using a wiki tool to ask a question, and collaborative uses would include creating and editing wiki pages, uploading files, posting comments, or tagging materials. Any querying or collaborative action a user performs with one of the tools qualifies as a “use.” The effectiveness of a tool, either email or the wiki, is determined by the number of uses associated with it. A change in the effectiveness of a tool means that the number of uses performed with that tool has either increased or decreased.
To determine whether the tagging vocabulary and collaboration nodes cause an increase in the wiki’s effectiveness, I have compared the patterns of use for both the wiki and the email listserv before and after the implementation of the changes. Assuming that the user population’s level of communication remains consistent, if users begin
collaborating through the digital collaborative space, then as the number of querying and collaborative actions performed on the digital collaborative space increases, the number of querying and collaborative actions performed through email should decrease. This change would signify a shift from email to the wiki as the primary digital communication tool.
3.1
Study overview
This study concerns the internal collaboration of the nine offices of the North Carolina Area Health Education Centers program (NC AHEC), located throughout North Carolina. Prior to this study, collaboration was done primarily through an email listserv, with an existing wiki largely unused except as an unorganized holding space for shared documents and archived emails.
as part of the organization’s normal maintenance and improvement process: 1) a new
structure for the wiki, including collaboration nodes as central locations for discussion and teamwork, and 2) a tagging vocabulary.
This study consists of three overall phases, shown in Figure 1: Study Outline – the Control Data Monitoring Period, the Transition Period, and the Experimental Data Monitoring Period. The Control Data Monitoring Period covers the time during which NC AHEC used their existing wiki, referred to here as the Original Wiki, and the data collected about use of the wiki and email serves as a baseline of use of communication tools for collaborative work. To capture user attitudes about wiki tools and to provide some insight into why any changes might occur, the study also included two surveys asking users to assess their skills with wikis and tagging, one issued prior to the
implementation of the Experimental Wiki and one issued at the end of the Experimental Data Monitoring Period.
Figure 1: Study Outline
Experimental Wiki creation Original Wiki creation and implementation Control Data Monitoring begins (retroactive collection)Intro Email to Listserv
· Recruitment for Initial Survey. · Training
Documents distributed Initial Survey Control Data Monitoring ends Experimental Wiki implementation Transition Period
· Both Original Wiki and Experimental Wiki are accessible. · No data
collection Original Wiki closes Experimental Data Monitoring begins
Concluding Email to Listserv
· Recruitment for Concluding Survey
Experimental Data Monitoring ends
During the Control Data Monitoring Period, I created a new wiki, referred to here as the Experimental Wiki, using both the new structure and the tagging system. The Experimental Wiki contained all the information and materials from the Original Wiki, so that the only difference between the two was the format of the digital space. During the Control Data Monitoring Period, the incomplete Experimental Wiki was inaccessible to all subjects except myself, the Director of the NC AHEC Digital Library, and key users included in an advisory capacity. Because uses of the Experimental Wiki during the Control Data Monitoring Period reflect only my administrative work constructing the space rather than use of the wiki as a communication tool, the uses of the Experimental Wiki are not included in the data collected during the Control Data Monitoring Period.
I began preparations for the implementation of the Experimental Wiki one week before the end of the Control Data Monitoring Period, when I sent an introductory email to the listserv notifying users of the upcoming changes to the wiki and providing them with training materials to ensure they understood how to use the tagging system and the other wiki-related tools. The introductory email also recruited users to participate in the initial survey. This email can be viewed in Appendix 2: Emails sent to subjects.
When the Experimental Wiki was made accessible to the subjects, the Control Data Monitoring Period ended and the Transition Period began. During the three-week Transition Period, the users had access to both the Original Wiki and the Experimental Wiki, to encourage them to familiarize themselves with the differences between the two. No data collection occurred during the Transition Period.
Experimental Data Monitoring Period, during which data was collected about subjects’
use of the wiki and email in the process of collaboration. One week before the end of the Experimental Data Monitoring Period, the concluding email was sent to the listserv, recruiting participants for the concluding survey. The concluding survey closed the week after the Experimental Data Monitoring Period ended.
3.2
Part A: Survey
The survey in this study asked subjects to evaluate their skill with, and use of, the wiki and tagging tools. The initial survey, issued prior to the implementation of the Experimental Wiki, asked about subjects’ perceptions of their overall skill with wiki tools and their use of the wiki over the past month, to provide a baseline of their abilities with the unaltered Original Wiki. The concluding survey, issued at the end of the study, both repeated the questions on the initial survey and also asked subjects to compare their skill with the Experimental Wiki to their skill with the Original Wiki. The repetition of the questions from the initial survey was meant to show whether there was an actual change in how subjects perceived the two wikis, and the comparison questions would show whether the subjects believed there was a change.
3.3
Part B: Monitoring Data Logs
The bulk of information in this study came from data collected about the use of the NC AHEC wiki and the work-related emails sent on the NC AHEC email listserv. All members of the NC AHEC organization can access the email listserv and the wiki history function, meaning that all the email and wiki use data included in this research study was already available to me as a part of my graduate assistant position.
Part of the NC AHEC wiki, accessible to anyone with an NC AHEC wiki account, is the PBworks history function, which records all uses of the wiki, including uploading files, creating new materials, editing existing materials, making comments, and adding or changing tags. In addition to the history function, PBworks also generates weekly
statistics on each user’s wiki uses, such as page views, available to wiki administrators.
With the data from the PBworks history function and the weekly statistical reports dating back to the creation of the wiki in May 2010, I was able to recreate wiki use data for the entirety of the wiki’s existence.
Past emails sent on the NC AHEC listserv, from November 2010 to the present, have been archived on the NC AHEC wiki, accessible to anyone with an NC AHEC wiki account. These are work-related emails sent on a listserv that includes the entire NC AHEC organization, and it does not include any personal emails or emails sent as individual exchanges between employees. These emails provided a baseline of use statistics corresponding to the wiki use information available through PBworks.
Between the email listserv and the wiki, this study captures all the digital
collect data during the Experimental Data Monitoring Period, I included all emails sent on the NC AHEC listserv and all alterations to the Experimental Wiki between March 19, 2012 and May 18, 2012. This resulted in a control period of 394 days and an
experimental period of 61 days.
In order to collect the data used in this study, I created a coded data log, with users’ names replaced by randomly generated numeric pseudonyms. Every NC AHEC consultant or other employee with an account for the NC AHEC wiki was assigned a pseudonym. To create the pseudonyms, each subject was given a 4-digit number drawn from a random number set. The 4-digit numbers were arranged in ascending numerical order, and numbered from 01 – 90. These 2-digit numbers became the pseudonyms used in the study.
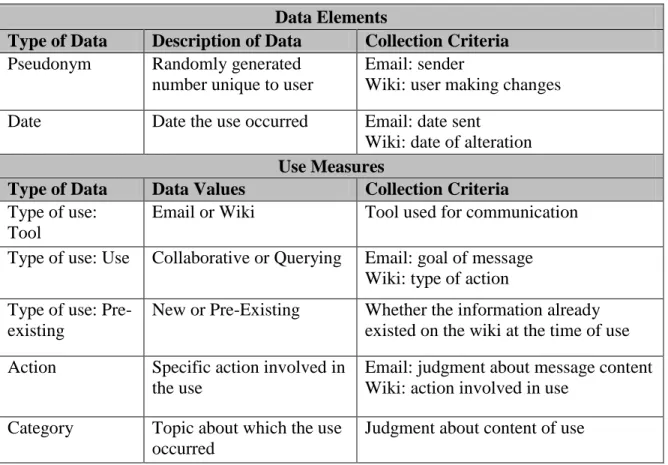
The data log included every email sent on the NC AHEC listserv and every alteration to the NC AHEC wiki. For every use of a communication tool, I created a separate entry in the data log, consisting of seven data elements. The first two data elements – the date the use occurred and the pseudonym of the user performing the use – serve as reference information for each use. The remaining five data elements, which will be called “use measures” here, represent the five ways I chose to describe use of
communication tools. The five use measures are 1) the communication tool used, 2) whether the use was primarily collaborative or querying, 3) whether the use provided or requested new information not previously existing on the wiki, 4) the specific action taken to perform the use, and 5) the category of information involved. Table 1: Data
I used predefined, specific terms, called “values” here, for every use measure, to
ensure consistency in the data collected. Every individual use recorded in the data log was labeled with a single value for each of the five use measures.
Table 1: Data collection
Data Elements
Type of Data Description of Data Collection Criteria
Pseudonym Randomly generated number unique to user
Email: sender
Wiki: user making changes Date Date the use occurred Email: date sent
Wiki: date of alteration
Use Measures
Type of Data Data Values Collection Criteria
Type of use: Tool
Email or Wiki Tool used for communication
Type of use: Use Collaborative or Querying Email: goal of message Wiki: type of action Type of use:
Pre-existing
New or Pre-Existing Whether the information already existed on the wiki at the time of use Action Specific action involved in
the use
Email: judgment about message content Wiki: action involved in use
Category Topic about which the use occurred
Judgment about content of use
The three binary use measures – the tool, the type of use, and whether the information already existed – show the overall type of collaboration occurring. The “tool” use measure shows whether the wiki or the email listserv is being used, providing
included in the specific use already existed on the wiki at the time the use occurred. This shows whether users consulted the wiki before attempting a more active type of use, either to answer their question on their own if their use was querying or to determine whether they would be repeating an existing communication if their use was
collaborative.
The “action” use measure shows the specific way in which the use occurred. For emails, possible actions were asking a question, sharing information, or replying to an ongoing email conversation. These actions show the types of emails being sent, and the number of email replies indicates the extent to which the users are actively working together. For the wiki, possible actions were creating a new page, editing an existing page, uploading a file, tagging any wiki material, or adding a comment. These actions show the way that users are interacting with the wiki and the wiki functions they find most useful. The wiki actions of creating new pages and uploading files correspond more closely to the emails sharing information, because both require a low level of interaction with other users. The wiki actions of tagging material, adding comments, or editing pages show more active collaboration because they require interaction with existing
information, as do email replies to a conversation.
Although viewing pages should be classified as an action, page views are not stored in a manner that allows them to be coded as the other uses are. PBworks records a user’s page views as a weekly aggregate, with no way to differentiate between pages
The “category of use” use measure shows the topics users were collaborating about. Based on the major topics of collaboration prior to the creation of the
Experimental Wiki, I defined the following 16 categories as topics of use: · Attestation Process
o Calculations
o Eligibility
o Payments
o Registration
o Timing
· Certified Technology and Vendors
o Product Selection and Recommendations · Finance
· Internal NC AHEC Operations · NC AHEC Practices
· Program Rules and Requirements
o Blue Cross Blue Shield
o CMS Incentive Programs for Electronic Health Records and E-Prescribing
o Patient-Centered Medical Home Standards · Other
Classifying each use according to category of information would show what topics users discussed most, determining whether the category of information discussed had any impact on the form in which collaboration occurred.
IV.
Results
Using the methods described, I collected data describing use patterns of the NC AHEC wiki and email listserv both before and after the implementation of the
Experimental Wiki. The Control Data Monitoring Period, prior to implementation, lasted from February 1, 2011 to February 29, 2012, and the Experimental Data Monitoring Period, after implementation, lasted from March 19, 2012 to May 18, 2012. Both data monitoring periods included a total of 93 users with access to the NC AHEC wiki and email listserv, including myself.
4.1
Adjustments to the data set prior to calculations
After completing the data collection process, certain factors came to light which might skew calculations done with the data. In order to reflect the patterns of the
subjects’ data usage more accurately, I have excluded or combined some portions of the original data set.
4.1.1 Removal of researcher data
As a graduate assistant employed by NC AHEC, I contributed to both the wiki and the email listserv during the data monitoring period. However, I used both tools in a primarily administrative capacity, with the majority of my uses including the creation of a wiki page for every email sent on the email listserv. My use of the tools represents
maintenance, rather than communication, and including my data would artificially inflate the amount of use apparently occurring on the wiki. The impact of my uses can be seen in
Chart 1: Impact of researcher data, showing the difference in activity levels with and
Chart 1: Impact of researcher data
In order to prevent these administrative or duplicative uses from affecting the study’s calculations and conclusions, I have excluded all uses associated with my
pseudonym from the study calculations. This means that the only users included in the data are the people who would use the wiki and email listserv as communication tools.
4.1.2 Shortened control period
The Control Data Monitoring Period was intended to capture use of the Original Wiki as a communication tool prior to the implementation of the study’s changes.
However, this period, from February 1, 2011 to February 29, 2012, included an early spike in wiki use, during which a small number of users populated the previously empty wiki with a large number of files about certified technology. Chart 2: Total uses with
full Control Data Monitoring Period shows a large spike of activity in the middle of
March 2011, when the number of uses tripled for the only time in the entire data monitoring period.
0 50 100 150 200 250
To
tal Wee
kl
y
Us
e
s
Weekly use with researcher
Chart 2: Total uses with full Control Data Monitoring Period
This spike of activity can be considered a part of the creation of the wiki as a repository for shared information, and as such it does not accurately reflect the pattern of collaborative wiki use. To ensure that tests involving the pattern of wiki use over time are not skewed by this initial period of file uploading, I have shortened the control period to include only the timeframe in which the wiki was used as a communication tool.
According to the revised timeline, the new Control Data Monitoring Period began on March 28, 2011, excluding all data collected prior to this date. All calculations and conclusions in this study are based on the revised Control Data Monitoring Period unless explicitly noted otherwise.
4.1.3 Combination of categories
During the Experimental Data Monitoring Period, some categories had very low levels of activity. In order to have sufficient numbers to run effective chi squared tests, the following categories have been combined:
0 50 100 150 200 250 300
To
tal Us
e
1. All of the Attestation subcategories – Calculations, Eligibility, Payments, Registration, Timing, and Other – have been combined into a single Attestation category.
2. The subcategory of Programs: Blue Cross Blue Shield has been combined with the Programs: Other category.
3. The category of Finance has been combined with the Other category.
All tests in this study that refer to a category use measure use the new, combined list of categories.
4.2
Data Monitoring Results
The following tables present the aggregate results of the data collected for each use measure. Within the results, the term “value” refers to each of the possible labels that could be assigned to a use for every use measure. The average, percentage of use, and standard deviation have been calculated for the value of each use measure, before and after implementation. The average was calculated as the total number of uses for a value divided by the number of days or weeks included in the monitoring period. The
percentage of all uses for a value was calculated as the number of times a value occurred during a period divided by the total number of uses during that period, showing how much of the total use during that period the specific value represented.
or the percentage of use for every value of a use measure before and after
implementation, to determine whether there was a significant change in the overall pattern of how a use measure’s values occurred.
Excluding my uses, there was a total of 3291 uses, 3062 before implementation and 229 after implementation. The uses before implementation included 987 email uses and 2075 wiki uses, and after implementation there were 141 email uses and 88 wiki uses. The amount of total uses of collaborative tools significantly decreased from 6.34 daily uses to 3.75 daily uses after implementation (p<0.01.) The standard deviation for the number of daily uses also decreased from 10.42 to 4.83 (p<0.01,) showing less fluctuation in the amount of uses after implementation. Although such significant differences did not occur in every use measure, they are important background for the other results.
Chart 3: Overall use
Chart 3: Overall use includes several key points of interest. The brackets at the
top and bottom of the plot area indicate the three-week Transition Period, during which the Experimental Wiki was implemented and no use data was collected. The brackets are repeated on all graphs showing a span of time, to indicate when the Transition Period falls. The chart also shows that uses occur in spikes rather than at steady levels, and three arrows on the chart mark the three largest spikes of use. These spikes occurred in mid-July, late August, and late October. The arrows are repeated on other graphs, showing when the spikes of overall use occurred so that a comparison may be made.
4.2.1 Type of use: tool
The tool used in the study was recorded as a binary use measure. The two possible values for the tool used were “wiki” or “email,” meaning that every use of a
communication tool involved either the wiki or the email listserv. This use measure shows the pattern of use for each of the two communication tools available to the users.
0 10 20 30 40 50 60 70 80 90 100
D
ai
ly
Us
e
s
Implementation July
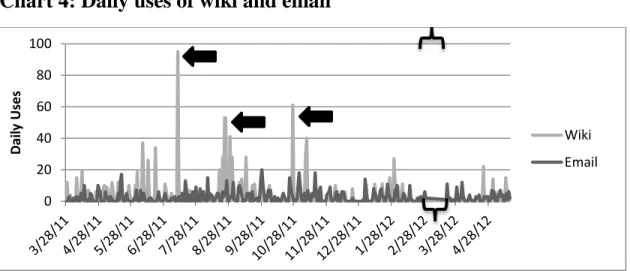
Chart 4: Daily uses of wiki and email
Chart 4: Daily uses of wiki and email shows many spikes in wiki activity prior
to implementation, which are not replicated after implementation. Although email use has some variation in daily levels, it remains within the same range both before and after implementation. The arrows indicating the three major points of use show that these spikes consist primarily of an increase of wiki activity.
Table 2: Type of use by tool
Average Uses per Day
Percentage of Use
Standard Deviation
t Test
Use measure Before After Before After Before After p Value
All Uses 6.34 3.75 –– –– 10.42 4.83 0.003
Emails 2.51 2.31 0.40 0.62 3.64 2.66 0.612
Wiki Uses 3.82 1.44 0.60 0.38 9.44 3.96 0.001
Chi Square Test
p Value 0.047 0.652 –– ––
These patterns are borne out in the calculations. The average number of daily communications using email remains fairly consistent, 2.51 before implementation and 2.31 after, with only a small decrease in the standard deviation for email use. Despite the steadiness of email uses, the average number of daily wiki uses dropped from 3.82 to 1.44, with the standard deviation decreasing more dramatically, from 9.44 to 3.96.
0 20 40 60 80 100
D
ai
ly
Us
e
s
Wiki
According to the t test, this decrease in wiki uses was significant at the p<0.001 level. The chi squared test comparing the change in the average values of all communications before and after implementation showed significance at the p<0.05 level.
The percentage of use that each value represented before and after
implementation almost directly reversed. The amount of all communication done using email increased from 40% to 62%, while the amount of communication done using the wiki dropped from 60% to 38%. However, the chi squared test for both values’
percentage of use did not show this change at a significant level.
4.2.2 Type of use: collaborative or querying
The motivation of each use was recorded as a binary use measure, with every use labeled as either “collaborative” or “querying.” This use measure shows the pattern of use related to the users’ motivations in communicating with one of the tools.
Chart 5: Daily use by collaborative or querying motivation
Chart 5: Daily use by collaborative or querying motivation shows that in both
periods there was significantly more collaborative use than querying use. The three major points of use show that the dramatic spikes of use occurred through an increase in
collaborative activity, with little change in the querying use of tools. 0
20 40 60 80 100
D
ai
ly
Us
e
s
Collaborative
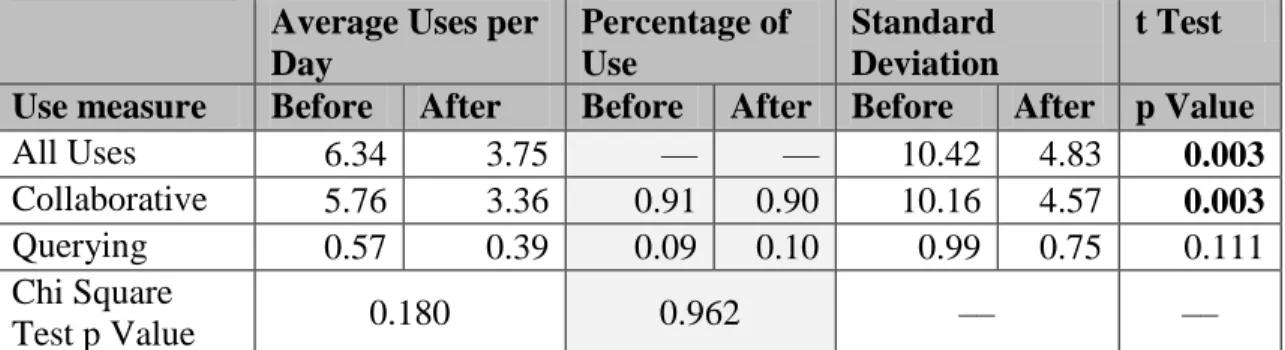
Table 3: Type of use by motivation
Average Uses per Day
Percentage of Use
Standard Deviation
t Test
Use measure Before After Before After Before After p Value
All Uses 6.34 3.75 –– –– 10.42 4.83 0.003
Collaborative 5.76 3.36 0.91 0.90 10.16 4.57 0.003
Querying 0.57 0.39 0.09 0.10 0.99 0.75 0.111
Chi Square
Test p Value 0.180 0.962 –– ––
The percentage of all uses that were collaborative remained constant at 90-91%, meaning that the percentage of all uses that were labeled querying also remained constant at 9-10%. The average daily number of collaborative uses did decrease from 5.76 to 3.36 after implementation, a change significant at the p<0.01 level. The daily average number of querying uses remained consistently low.
The chi squared test did not show any significant changes in the overall distribution of values before and after implementation for either the averages or the percentages of use.
4.2.3 Type of use: existing information
For every use, I determined whether or not the information involved in the use of a communication tool was available on the wiki at the time of the use. The use was then labeled either “new,” to indicate that the information in the use was new and not previous on the wiki, or “on wiki,” to indicate that either the information shared in a collaborative
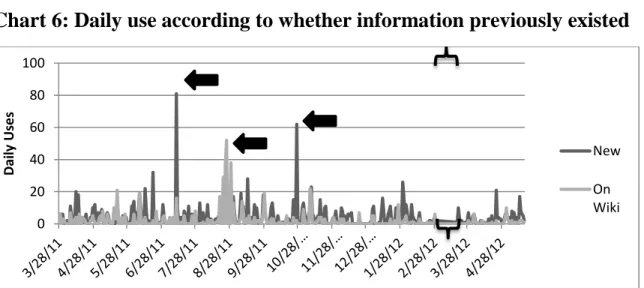
Chart 6: Daily use according to whether information previously existed
The overall pattern of daily use does not show a strong bias towards either new information or previously existing information, although the large spikes of activity are either wholly new information or wholly repeated information. Two of the major points of use consist of new information, but the August spike in use consists almost entirely of information already in existence on the wiki.
Table 4: Type of use by whether information previously existed
Average Uses per Day Percentage of Use Standard Deviation t Test
Use measure Before After Before After Before After p Value
All Uses 6.34 3.75 –– –– 10.42 4.83 0.003
New Info. 4.18 2.92 0.66 0.78 7.42 3.88 0.051 Previously
Existing Info. 2.15 0.84 0.34 0.22 5.31 1.64 0.000 Chi Square Test
p Value 0.105 0.778 –– ––
The average daily uses involving new information and previously existing information both decreased after implementation, with new information dropping from 4.18 to 2.92 and previously existing information decreasing from 2.15 to 0.84. Only the decrease in existing information showed as significant using the t test, at the p<0.001 level. Both values showed a decrease in standard deviation, with new information
decreasing from 7.42 to 3.88 and previously existing information dropping from 5.31 to 1.64.
The percentage of total use that each value represented did change to a certain extent, but new information continued to be 60-80% of the total use of the wiki in either period. The chi squared test did not show a significant pattern of change in either the averages or the percentages of use.
4.2.4 Type of use: overview
Chart 7: Changes in daily average use for all "type of use" binary use
measures
Chart 7: Changes in daily average use for all “type of use” binary use
measures shows the average daily type of use before and after implementation, for all
three of the use measures labeled with binary values. Each use measure, represented by its two possible values, includes all the data in the study. The average daily use before and after implementation for each pair of values shows a different way of viewing the change in the average number of all uses per day.
0 1 2 3 4 5 6 7
A
ve
rag
e
D
ai
ly
US
e
s
Before
This shows that the greatest difference between values is between the amount of collaborative or querying use. The greatest decreases in average daily uses came from use of the wiki and collaborative uses, while the average uses involving new information and existing information both decreased. Both the average number of emails sent and the average number of querying uses remained very consistent.
4.2.5 Action
The action use measure shows what specific task users performed with each use of a communication tool. The three tasks associated with using email are asking a question, sharing unsolicited information, or replying to an email conversation. The five actions associated with using the wiki are creating a new page, editing an existing page, uploading a file, tagging content, or posting a comment.
Chart 8: Actions taken over time
The overall pattern of actions taken shows that the large spikes of use are
generally associated with a single type of action, most often on the wiki. The large spikes in use all involve large numbers of files uploaded to the wiki.
Chart 9: Email-related actions
Chart 9: Email-related actions shows the pattern of collaboration using email.
The spikes of increased numbers of email replies show conversations, where
collaborative email activity occurred. This chart also shows that although the numbers of informational and querying emails remained at approximately the same levels over time, the number of email replies varied widely.
Although the arrows are placed on this chart when the spikes in overall use occurred, there are no corresponding usage spikes to show increased email use at those points. Despite dramatic increases in wiki activity in mid-July, late August, and late October, email use remained unaffected.
0 2 4 6 8 10 12 14 16 18
D
ai
ly
Us
e
s
Email: Reply
Email: Information
Chart 10: Wiki-related actions
Chart 10: Wiki-related actions shows the pattern of actions taken on the wiki
over time. A large part of wiki activity consists of uploading files, but this activity is concentrated into a few short spikes of activity. These spikes occur at the points of dramatic use increase, as noted by the arrows. The other wiki actions do not show particular increases at these points, and overall they remain at low levels.
0 10 20 30 40 50 60 70 80 90 100
D
ai
ly
Us
e
s
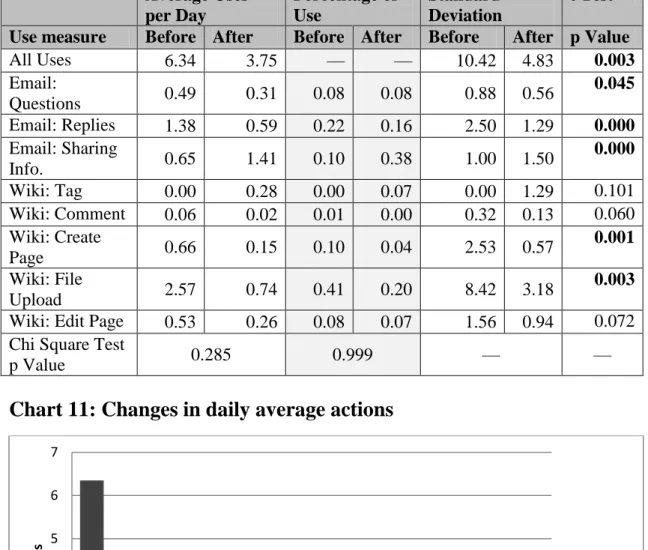
Table 5: Actions performed
Average Uses per Day Percentage of Use Standard Deviation t TestUse measure Before After Before After Before After p Value
All Uses 6.34 3.75 –– –– 10.42 4.83 0.003
Email:
Questions 0.49 0.31 0.08 0.08 0.88 0.56
0.045
Email: Replies 1.38 0.59 0.22 0.16 2.50 1.29 0.000
Email: Sharing
Info. 0.65 1.41 0.10 0.38 1.00 1.50
0.000
Wiki: Tag 0.00 0.28 0.00 0.07 0.00 1.29 0.101 Wiki: Comment 0.06 0.02 0.01 0.00 0.32 0.13 0.060 Wiki: Create
Page 0.66 0.15 0.10 0.04 2.53 0.57
0.001
Wiki: File
Upload 2.57 0.74 0.41 0.20 8.42 3.18
0.003
Wiki: Edit Page 0.53 0.26 0.08 0.07 1.56 0.94 0.072 Chi Square Test
p Value 0.285 0.999 –– ––
Chart 11: Changes in daily average actions
According to the t test, all three email-related actions showed a significant change in the pattern of use. While the average number of daily email questions and the average number of daily email replies both decreased – from 0.49 to 0.31 and from 1.38 to 0.59, respectively – the average number of daily emails sharing information increased, from 0.65 to 1.41. Emails sharing information also became a larger percentage of the overall actions performed, increasing from 10% to 38%.
For the wiki-related actions, only creating new pages and uploading files show significant amounts of change. The average daily number of pages created dropped from 0.66 to 0.15, and the average daily number of files uploaded dropped from 2.57 to 0.74. The number of files uploaded also became a much smaller percentage of the type of actions performed, dropping from 41% of the type of action to 20%. The average daily numbers of materials tagged, comments added, and pages edited all remained
consistently low, with no average rising above 0.5.
The chi squared tests do not show significant amounts of overall change in the types of actions performed, either by average daily action or by the percentage of use each value represented.
4.2.6 Category
Chart 12: Daily use by category of information
Chart 12: Daily uses by category of information shows the breakdown of topics
involved in digital communication. All of the spikes in use appear to be associated with a single category of information. The largest use spike in July was part of the patient-centered medical home program, while the August and October use spikes involved certified technology.
0 10 20 30 40 50 60 70 80 90 100
D
ai
ly
Us
e
s
Cert. Tech.
Programs: PCMH Attestation
Practices
Programs
Internal Ops.
Cert. Tech. Selection Other
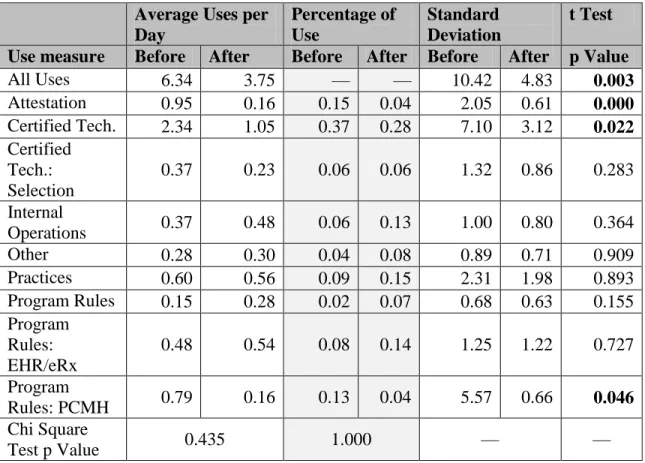
Table 6: Category of information
Average Uses per Day
Percentage of Use
Standard Deviation
t Test
Use measure Before After Before After Before After p Value
All Uses 6.34 3.75 –– –– 10.42 4.83 0.003
Attestation 0.95 0.16 0.15 0.04 2.05 0.61 0.000
Certified Tech. 2.34 1.05 0.37 0.28 7.10 3.12 0.022
Certified Tech.: Selection
0.37 0.23 0.06 0.06 1.32 0.86 0.283 Internal
Operations 0.37 0.48 0.06 0.13 1.00 0.80 0.364
Other 0.28 0.30 0.04 0.08 0.89 0.71 0.909
Practices 0.60 0.56 0.09 0.15 2.31 1.98 0.893 Program Rules 0.15 0.28 0.02 0.07 0.68 0.63 0.155 Program
Rules: EHR/eRx
0.48 0.54 0.08 0.14 1.25 1.22 0.727 Program
Rules: PCMH 0.79 0.16 0.13 0.04 5.57 0.66 0.046 Chi Square
Chart 13: Changes in daily average use by category of information
The three values that showed significant changes in use before and after implementation, according to the t test, are Attestation, Certified Technology, and
patient-centered medical homes (PCMH.) Prior to implementation, these three categories were also the three largest percentages of use. After implementation, attestation dropped from 15% to 4% and patient-centered medical homes decreased from 13% to 4%, making them the two smallest percentages of use after implementation. Certified technology remained the largest percentage of total use, only dropping from 37% to 28%, but the average number of certified technology uses per day dropped from 2.34 to 1.05.
The other six categories of information remained at consistently low levels before and after implementation, as shown in Chart 13: Changes in daily average use by
category of information. The chi squared tests reinforced this, showing no significant
0 1 2 3 4 5 6 7
A
ve
rag
e
D
ai
ly
Us
e
s
Before
change in the overall pattern of average uses by category of the distribution of percentage of use.
4.2.7 Pattern of use: all uses
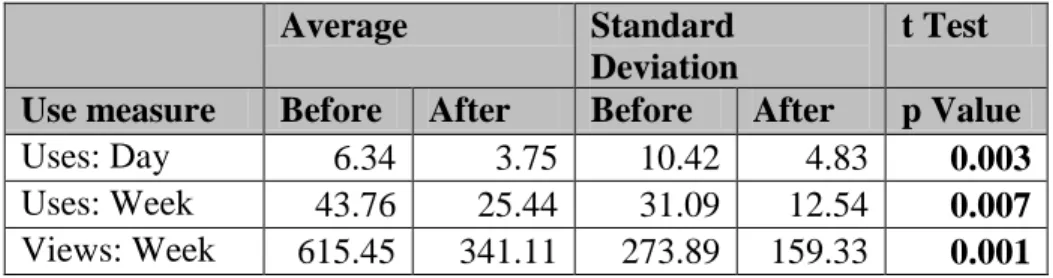
The pattern of use includes both the uses recorded in the study, without separating out specific instances by use measures, and the page views during the study period. Since the page view numbers were accessible only as a weekly total, the uses recorded in the study have been calculated by week as well as by day. This allows a more accurate comparison between the number of active uses of a communication tool and the number of times a page of the wiki was viewed.
Table 7: All uses or views over time
Average Standard
Deviation
t Test
Use measure Before After Before After p Value
Uses: Day 6.34 3.75 10.42 4.83 0.003
Uses: Week 43.76 25.44 31.09 12.54 0.007
Views: Week 615.45 341.11 273.89 159.33 0.001
Table 7: All uses or views over time shows the change in the number of daily
Chart 14: Weekly view and use totals over time
Chart 14: Weekly view and use totals over time shows the overall changes in
views and uses. It is important to note that even though the uses include the total numbers for actions related to both email and the wiki, the amount of active uses of a
communication tool is consistently far lower than the number of views of wiki pages. The points of high use do show some corresponding increase in the number of weekly views, but there are also some spikes in weekly views that do not have a corresponding increase in the number of uses, such as in early December or late January.
4.2.8 Pattern of use: unique users
Another way to measure the pattern of overall use is to determine how many different individuals are using communication tools. The “unique users” use measure
refers to the number of different users who interact with a tool over a given time period, and this total has been determined both for all uses of any communication tool and for uses solely of the wiki. Because page views are only tracked as a weekly total for each user, the numbers for active uses are calculated by week as well as day, to allow more accurate comparisons.
0 200 400 600 800 1000 1200 1400
Wee
kl
y
To
tals
Views
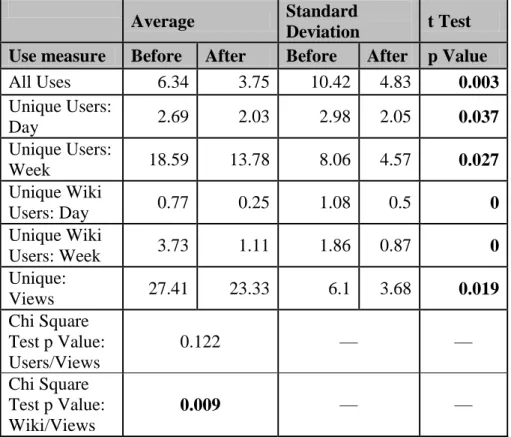
Table 8: Uses and views by unique individuals over time
Average Standard
Deviation t Test
Use measure Before After Before After p Value
All Uses 6.34 3.75 10.42 4.83 0.003
Unique Users:
Day 2.69 2.03 2.98 2.05 0.037
Unique Users:
Week 18.59 13.78 8.06 4.57 0.027
Unique Wiki
Users: Day 0.77 0.25 1.08 0.5 0
Unique Wiki
Users: Week 3.73 1.11 1.86 0.87 0
Unique:
Views 27.41 23.33 6.1 3.68 0.019
Chi Square Test p Value: Users/Views
0.122 –– ––
Chi Square Test p Value: Wiki/Views
0.009 –– ––
Table 8: Uses and views by unique individuals over time shows the changes in
the numbers of users interacting with a communication tool actively or passively. The t test shows that there were significant changes at the p<0.05 level in the number of active users per day and per week, as well as in the number of weekly wiki viewers. The
Chart 15: Weekly views and uses by unique users
Chart 15: Weekly views and uses by unique users shows the change in the
number of users interacting with communication tools actively, by taking actions recorded as uses, or passively, by viewing the wiki without changing it. Although the number of viewers overall is greater than the number of active users, the chart shows that before implementation, there were certain points when the number of active users spiked to exceed the number of viewers, with the two sets of totals following slightly different patterns. Although the number of unique wiki users follows the same general pattern as the number of total unique users, the number of unique wiki users is consistently far lower than the number of total users, only rising above five users at spikes of high use.
After implementation, the number of weekly viewers follows the number of weekly users very closely, with the weekly viewer total consistently a steady amount greater than the weekly user total. The three points of dramatic increase in usage are
marked, but while they do show minor increases in the numbers of unique users, these are not the points when the greatest numbers of unique users were active.
4.3
Survey Results
Responses to the two surveys did not reach high enough numbers to determine significance for the entire population of 93 users. 17 users completed the initial survey, and only 6 users completed the concluding survey.
4.3.1 Initial Survey
Table 9: Initial Survey results (Number of responses = 17)
1. How would you rate your current skill level with wiki technology?
Frequency Response Weight
Average Response
1.56 I find wiki technology very difficult to use. 2 0
I find wiki technology somewhat difficult to use. 6 1 I find wiki technology neither difficult nor easy to
use.
5 2
I find wiki technology somewhat easy to use. 3 3 I find wiki technology very easy to use. 0 4
2. How would you rate your ability to locate materials on the NC AHEC PBworks wiki?
Frequency Response Weight
Average
0.80 I can locate wiki materials with great difficulty. 5 0
I can locate wiki materials with some difficulty. 8 1 I can locate wiki materials with some ease. 2 2 I can locate wiki materials very easily. 0 3
3. How often did you use the NC AHEC PBworks wiki as a resource during the past month?
Frequency Response Weight
Average
1.19 I did not consult the NC AHEC wiki in the last
month
6 0
1-2 times 2 1
3-5 times 7 2
6-8 times 1 3
More than 8 times 0 4
On average, users responded that they found wiki technology between “somewhat difficult to use” and “neither difficult nor easy to use.” On average they replied that they could locate wiki materials “with some difficulty,” with more responses leaning towards
4.3.2 Concluding Survey
Table 10: Concluding Survey results (Number of responses = 6)
1. How would you rate your current skill level with wiki technology?
Frequency Response Weight
Average
2.67 I find wiki technology very difficult to use. 0 0
I find wiki technology somewhat difficult to use. 1 1 I find wiki technology neither difficult nor easy to
use.
1 2
I find wiki technology somewhat easy to use. 3 3 I find wiki technology very easy to use. 1 4
2. How has your skill level with wiki
technology changed since the implementation of the redesigned wiki?
Frequency Response Weight
Average
2.67 I feel that my skill level with wiki technology has
greatly decreased.
0 0
I feel that my skill level with wiki technology has slightly decreased.
1 1
I feel that my skill level with wiki technology has not changed.
2 2
I feel that my skill level with wiki technology has slightly increased.
1 3
I feel that my skill level with wiki technology has greatly increased.
2 4
3. How would you rate your ability to locate materials on the NC AHEC PBworks wiki?
Frequency Response Weight
Average
2.00 I can locate wiki materials with great difficulty. 0 0
4. How would you rate your ability to locate materials on the redesigned NC AHEC Collaborative Space wiki as compared to the original NC AHEC Practice Support wiki?
Frequency Response Weight
Average
3.67 I find it very much more difficult to locate
materials on the redesigned wiki.
0 0
I find it slightly more difficult to locate materials on the redesigned wiki.
0 1
I find it neither easier nor more difficult to locate materials on the redesigned wiki.
0 2
I find it slightly easier to locate materials on the redesigned wiki.
2 3
I find it very much easier to locate materials on the redesigned wiki.
4 4
5. How often did you use the NC AHEC PBworks wiki as a resource during the past month?
Frequency Response Weight
Average
1.67 I did not consult the NC AHEC wiki in the last
month
0 0
1-2 times 2 1
3-5 times 4 2
6-8 times 0 3
More than 8 times 0 4
6. How often do you use the redesigned NC AHEC Collaborative Space wiki as compared to the NC AHEC Practice Support wiki?
Frequency Response Weight
Average
2.83 I consult the redesigned wiki much less frequently
than I consulted the original wiki.
0 0
I consult the redesigned wiki slightly less frequently than I consulted the original wiki.
0 1
I consult the redesigned wiki with approximately the same frequency that I consulted the original wiki.
1 2
I consult the redesigned wiki slightly more frequently than I consulted the original wiki.
5 3
I consult the redesigned wiki much more frequently than I consulted the original wiki.
0 4
I have not consulted the redesigned wiki. 0 5
their current skill level with wiki technology to their skill level prior to the
implementation of the Experimental Wiki, their average response was between no change and “slightly increased.” On average, users reported that they could locate wiki materials “with some ease,” rating it between “slightly easier” and “very much easier” to locate
materials on the Experimental Wiki than on the Original Wiki. Users recalled consulting the wiki an average of 1-5 times in the past month, and they felt that they consulted the Experimental Wiki an average of “slightly more frequently” than the Original Wiki.
4.4
Summary of Results
Individual use measures that showed significant changes in types of use over time are the amount of collaborative uses, the amount of new information shared, the amount of existing information shared, and the amount of querying uses. Use measures showing significant changes in the type of actions taken over time are emails sharing information, emails asking questions, emails replying to threads, wiki comments, wiki pages created, wiki pages edited, and wiki files uploaded. Use measures showing significant changes in the category of use are attestation, certified technology, and patient-centered medical homes. Use measures showing significant changes in the pattern of overall usage are the number of total page views, the number of total uses, the number of unique active users, and the number of unique active wiki users.
V.
Discussion
5.1
Inconclusive changes
5.1.1 Data monitoring
One of the most important conclusions to draw from the data shown in the
Results section is that many of the use measures did not show a significant amount of
change. Only three of the six types of use, five of the eight actions, and three of the nine categories evaluated in the study showed any significant changes, suggesting that the majority of use measures seem to be unaffected by the implementation of a new wiki and a tagging system.
The most interesting change occurred in the overall patterns of use. Total use, across both the email listserv and the wiki, significantly decreased from an average of 43.8 uses per week before implementation to 25.4 uses per week after implementation (p<0.01.) This overall decrease can be seen in the decreased average uses in many other use measures, even the ones that were not determined to have changed at a significant level.
Since overall activity decreased significantly while only some of the use measures showed an equally significant decrease, the decrease in overall use seems to be comprised of only specific types of use.
information did not reflect an equivalent decrease. However, the collaborative uses, wiki uses, and uses related to pre-existing information all showed a significant decrease. Although the data collection methods required that every use be labeled with one of the two values from each pair, almost all the decreased overall use manifested in only one of the two values. Of these pairs of use measures, only the wiki/email pair showed a
significant pattern of change using a chi squared test, suggesting that for the other “type of use” use measure pairs, fluctuations in one value have little impact on the other value.
For indicators measuring the action taken during a use, all email-related actions showed significant change. Emails sharing information showed the only increase of average use. The average number of email questions sent per day decreased, but email questions did become a larger percentage of the total number of actions taken. However, the number of email replies, to either the questions or the information-sharing emails, decreased from a daily average of 1.4 to 0.6. Of the wiki-related actions, only creating pages and uploading files showed a significant change.
average for each category dropped considerably, with certified technology decreasing the most.
The use of the email listserv seems to have remained consistent, with the average number of emails sent per day decreasing from 2.5 to 2.3. This suggests that the
implementation of the Experimental Wiki only affected the use of the wiki as a
communication tool. The decrease in wiki activity seems to have occurred primarily in the actions related to sharing information, through fewer files being uploaded and fewer new pages being created, while the more collaborative actions, such as adding tags, editing pages, or writing comments, remained at their original low levels. This may be somewhat balanced by the increase in the number of emails sent sharing information, suggesting that users are shifting away from using the wiki as a repository of information, preferring instead to send that information via email.
Related to this shift in the methods of sharing information, users also showed less repetition in the information that they chose to share. The number of uses that replicated existing information – such as emailing a question already answered on the wiki or uploading a file already stored on the wiki – decreased significantly. Although the number of new uses also decreased, this did not occur at a level showing significance, suggesting that the decrease in new uses may only be a reflection of the overall decrease in communication. The decrease in the repetition of existing information, combined with the decrease in the wiki actions specifically related to sharing information, suggest that users have begun checking to see if information already exists before sharing it.