David O’Ferrell. Introducing an Enterprise Project Management Tool into an Agile Development Environment: Fit and Performance Impact. A Master’s Paper for the M.S. in I.S. degree. May, 2015. 68 pages. Advisor: Barbara Wildemuth
Abstract:
The principles of Agile software development promote interactions over tools, but practical application of Agile can demand a considerable amount of structure from software development teams. Vendor software solutions specifically designed for Agile work offer an alternative for many organizations still using manual methods or ill-fitted tools. In this study, we examined task-tool fit between functionality provided by a vetted Agile software solution, and tasks needing to be accomplished by software development teams practicing Agile Scrum methods. A high level of task-tool fit was determined for tasks within several Scrum summary activities. Also evaluated was task-tool fit impact on actual performance of Scrum teams. Quantitative metrics demonstrated an average
overall increase in performance after tool implementation for accomplishment of tasks within two Scrum summary activities being measured (Sprint Planning and Sprint Execution). It is suggested this performance improvement can be generally attributed to the determined high level of task-tool fit.
Headings:
Agile software development Computer software development Computer software developers Information technology projects Information technology software
INTRODUCING AN ENTERPRISE PROJECT MANAGEMENT TOOL INTO AN AGILE DEVELOPMENT ENVIRONMENT: FIT AND PERFORMANCE IMPACT
by David O’Ferrell
A Master’s paper submitted to the faculty of the School of Information and Library Science of the University of North Carolina at Chapel Hill
in partial fulfillment of the requirements for the degree of Master of Science in
Information Science.
Chapel Hill, North Carolina May 2015
Approved by
Table of Contents
1. INTRODUCTION ... 2
2. AGILE METHODOLOGIES FOR SOFTWARE DEVELOPMENT ... 4
2.1 EVOLUTION OF AGILE METHODOLOGIES ... 4
2.2 OBSERVED BENEFITS AND LIMITATIONS OF AN AGILE IMPLEMENTATION ... 7
2.3 ORGANIZATIONAL USE OF AGILE PROJECT MANAGEMENT TOOLS ... 10
2.4 SCRUM, AN AGILE SOFTWARE DEVELOPMENT FRAMEWORK ... 12
2.5 TASK-TECHNOLOGY FIT AND AGILE TEAM PERFORMANCE ... 15
3. CASE STUDY ... 17
3.1 CASE STUDY ENVIRONMENT... 17
3.1.1 Setting... 17
3.1.2 Specific Application of Agile Scrum Methods ... 18
3.1.3 Agile Tool Evaluation and Selection ... 19
3.2 SELECTED SOLUTION:EVALUATION OF FIT AND PERFORMANCE IMPACT ... 23
3.2.1 Fit of Tool Functionality to Applied Scrum Characteristics ... 23
3.2.2 Agile Team Data-Driven Performance Metrics ... 27
3.2.3 Impact of Implemented Tool on Measurable Team Performance ... 31
4. DISCUSSIONS, PRACTICAL IMPLICATIONS, AND CONCLUSION ... 36
5. BIBLIOGRAPHY ... 40
6. APPENDICES ... 43
6.1 APPENDIX A:SCRUM SUMMARY ACTIVITIES AND ASSOCIATED TASKS ... 43
6.2 APPENDIX B:VETTED AGILE SOFTWARE SOLUTION WEIGHTED SCORING ... 46
6.3 APPENDIX C:ESTIMATED PERCENTAGES OF TASK-TOOL FIT ... 51
6.4 APPENDIX D:SPRINT PLANNING PERFORMANCE MEASUREMENTS ... 65
1.
INTRODUCTION
Since the 1990’s, an extraordinary shift towards the use of Agile methodologies has been transforming the discipline of software development (Nerur, Moe, Dingsøyr & Balijepally, 2012). These more iterative and adaptive practices have provided organizations with what are seen as much more functional approaches towards the achievement of software project success. It has been acknowledged that the use of Agile methodologies can help software development teams better address constantly changing customer requirements, achieve increased customer involvement throughout the software development lifecycle, and promote more effective team and stakeholder communication and collaboration (Hneif, M. & Ow, S. 2009).
It is also maintained that the more customer-focused principles of Agile
methodologies have necessitated a shift in how software development project success should now be measured. Delivering more business value to customers is seen as the primary objective for the adoption of Agile methods, so adequately measuring Agile team performance and progress requires metrics that demonstrate how well customer
requirements are being satisfied and to what extent business value is actually being delivered in the form of working software (Dymond & Hartmann, 2006).
Many software organizations, seemingly in support of the Agile principles requiring more face-to-face communication and less documentation (http://Agilemanifesto.org/), have frequently chosen more manual, and less electronic, methods for the management of the Agile work being performed by development teams. Team progress in these organizations is frequently demonstrated through the use of sticky notes on walls and graphs drawn on flipcharts. A number of software organizations continue to leverage existing technologies, such as spreadsheet and scheduling applications, for the recording of Agile project and team information.
Many software teams have adopted the use of electronic tools for Agile project management. Based on the results of an annual survey of software development
organizations (Azizyan, et al., 2011), at least one quarter of surveyed organizations have purchased an enterprise project management application. These applications have been specifically developed by software vendors to support the work of Agile teams and organizations (Azizyan, et al., 2011).
How well the functionality provided by a specific technology supports the
accomplishment of activities required by a team has been well explored using the Task-Technology Fit Model, first introduced by Goodhue and Thompson (1995). Improved team and individual performance are often examined as potential benefits resulting from achievement of a significant fit between task and technology (Lai, 1999; Goodhue, Klein and March, 2000). Studies have also shown how a level of Task-Technology fit can contribute positively to organizational agility (Tiwari, et al., 2006).
This study will examine the Task-Technology Fit and performance impact provided by the implementation of an enterprise project management tool into a software
development environment practicing Agile methods, specifically teams practicing activities defined within the Scrum framework of the Agile methodology. This work intends to demonstrate that the functionality provided by the software technology has a good fit with these team requirements for the accomplishment of Scrum activities
detailed in the examined case study. Also, using specific metrics for evaluation of Scrum team performance, this study examines the amount of performance improvement,
2.
AGILE METHODOLOGIES FOR SOFTWARE
DEVELOPMENT
2.1
E
VOLUTION OFA
GILEM
ETHODOLOGIESBy the1960s, in response to a growing recognition and acknowledgement of software project failure, methodologies for software development began to emerge (Lyytinen, Shiv, & Thummadi, 2011). Royce (1970) first described what would become the foundation for a standard lifecycle approach to all processes involved in software development. The model eventually grew into the phased approach now known as the waterfall or traditional model of software development. Table 1 shows the summarized project lifecycle phases of a traditional waterfall model (Sommerville, 1996).
Table 1: The four distinct phases of the waterfall model for software development
Specification: Software functionality and constraints are detailed
Design & Implementation: Design of software structure/component identification
Integration & Testing: Integration and testing of all developed modules
Operation & Maintenance: Software Delivery/any needed modifications/repairs
Recognition of these limitations with use of a traditional waterfall model, along with the reality of rapidly changing requirements and accelerated delivery timelines, prompted the development and adoption of a number of iterative approaches for software
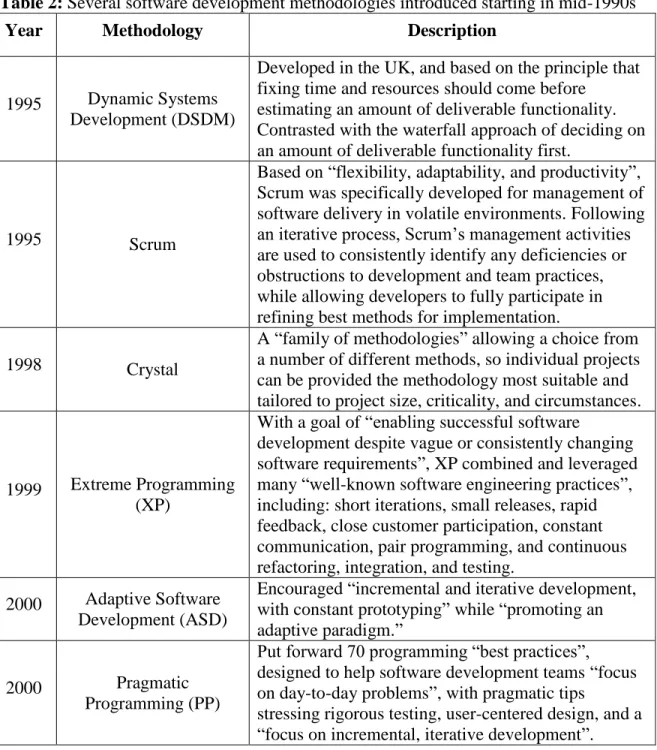
development teams and organizations. Table 2 details some of these early approaches (Abrahamsson, Warsta, Siponen & Ronkainen, 2003).
Table 2: Several software development methodologies introduced starting in mid-1990s
Year Methodology Description
1995 Dynamic Systems Development (DSDM)
Developed in the UK, and based on the principle that fixing time and resources should come before
estimating an amount of deliverable functionality. Contrasted with the waterfall approach of deciding on an amount of deliverable functionality first.
1995 Scrum
Based on “flexibility, adaptability, and productivity”, Scrum was specifically developed for management of software delivery in volatile environments. Following an iterative process, Scrum’s management activities are used to consistently identify any deficiencies or obstructions to development and team practices, while allowing developers to fully participate in refining best methods for implementation.
1998 Crystal
A “family of methodologies” allowing a choice from a number of different methods, so individual projects can be provided the methodology most suitable and tailored to project size, criticality, and circumstances.
1999 Extreme Programming (XP)
With a goal of “enabling successful software
development despite vague or consistently changing software requirements”, XP combined and leveraged many “well-known software engineering practices”, including: short iterations, small releases, rapid feedback, close customer participation, constant communication, pair programming, and continuous refactoring, integration, and testing.
2000 Adaptive Software Development (ASD)
Encouraged “incremental and iterative development, with constant prototyping” while “promoting an adaptive paradigm.”
2000 Pragmatic
Programming (PP)
Put forward 70 programming “best practices”, designed to help software development teams “focus on day-to-day problems”, with pragmatic tips
Representatives from all six of the methodologies outlined in Table 2 met in February of 2001, with a goal of discovering common ground between all of these recently
generated software development practices. They settled on the term “Agile” to represent a set of principles agreed necessary for this common approach to software development, and they subsequently dubbed themselves the “Agile Alliance.” After several days of collaboration, their meeting culminated in the introduction of the Agile Manifesto
(http://Agilemanifesto.org/). Table 3 lists the 12 principles advocated in Agile Manifesto.
Table 3: Twelve principles of Agile software prescribed by the Agile Manifesto 1. Our highest priority is to satisfy the customer through early and continuous
delivery of valuable software.
2. Welcome changing requirements, even late in development. Agile processes harness change for the customer's competitive advantage.
3. Deliver working software frequently, from a couple of weeks to a couple of months, with a preference to the shorter timescale.
4. Business people and developers must work together daily throughout the project. 5. Build projects around motivated individuals. Give them the environment and
support they need, and trust them to get the job done.
6. The most efficient and effective method of conveying information to and within a development team is face-to-face conversation.
7. Working software is the primary measure of progress.
8. Agile processes promote sustainable development. The sponsors, developers, and users should be able to maintain a constant pace indefinitely.
9. Continuous attention to technical excellence and good design enhances agility. 10.Simplicity--the art of maximizing the amount of work not done--is essential. 11.The best architectures, requirements, and designs emerge from self-organizing
teams.
As outlined in the manifesto, Agile methods make the creation of working software a primary goal, while attempting to remain responsive to the ever-changing nature of requirements. Agile methods follow an iterative approach, as opposed to a phased one, typically executing software development in iterations lasting no more than a few weeks, providing a set of deliverables after each. Adherence to an Agile methodology generally includes a preference for face to-face communication and a move towards individuals and interactions over processes and tools.
Agile practices also seek to reduce the traditional waterfall role of project manager from within software development, empowering the team with more influence over the determination of work, and customers with an environment structured to permit
continuous feedback and refinement of requirements.
The decade following the introduction of the Agile Manifesto has been described as one of “unparalleled growth”, with overwhelming acceptance of this new era in software development (Nerur, et al., 2012). Thousands of respondents to a recent global survey of software developers (Version One, 2015), representing hundreds of organizations across numerous industries, showed that 94% of responding organizations currently use Agile methods for software development.
Use of an Agile approach is represented by an ever-growing abundance of new Agile software methods, techniques, and tools (Nerur, et al., 2012). Several methodologies represented by members of the Agile Alliance at the time of the Agile Manifesto are still widely in use, including the most widely used Agile methodology, Scrum. Results from another global survey of 120 companies (Azizyan, et. al., 2011) showed that Scrum, or a version of Scrum, represented 86% of the Agile methodologies in use by software developers across the companies surveyed.
2.2
O
BSERVEDB
ENEFITS ANDL
IMITATIONS OF ANA
GILEI
MPLEMENTATIONAgile practices are widely seen as a genuine solution for helping software development teams avoid the pitfalls that lead to project failure. Agile software
development projects are shown to have three times the success rate of projects managed using traditional waterfall methods, and that success is attributed primarily to the more focused, and less rigid iterative process that allows for frequent inspection and greater team interaction (Standish Group, 2011).
From the nearly 4000 responses to the recent annual global survey of software
developers across multiple industries (Version One, 2015), the top three benefits of Agile development for the third year in a row were indicated as being:
1) Ability to manage changing priorities (87%); 2) Team productivity (84%); and
3) Project visibility (82%).
More than half of those responding also claimed that the majority of their Agile projects have been successful. When Agile projects did fail, the most frequently-cited reason for project failure was actually the lack of experience with Agile methods.
This data on the success of Agile practices is quite compelling, although it has been found that these demonstrated benefits of Agile methods may not be as impactful in every environment. An Agile organization has been defined as one that rapidly responds to change. Consequently, agility is sometimes found most beneficial within less predictable environments, where requirements are most varied and volatile. This view is supported by an examination of agility in Supply Chain Organizations (Tiwari, Agarwal, & Shankar, 2006), which stressed the need for the increased speed and flexibility Agile methods provide, but also demonstrated how these benefits were more prevalent within this specific environment when increased sensitivity to market changes required a rapid reaction to change.
Five government agencies using Agile methods reached consensus on the practices found most effective for successful Agile adoption. Their suggested Agile adoption practices are listed in Table 4.
Table 4: Practices used by and found in effective agencies Agile guidance and an Agile adoption strategy
Enhance migration to Agile concepts using Agile terms
Improve Agile adoption at both the project level and organization level Identify and address impediments at the organization and project levels Obtain stakeholder/customer feedback frequently
Empower small, cross-functional teams
Gain trust by demonstrating value at the end of each iteration Track progress daily using tools and metrics
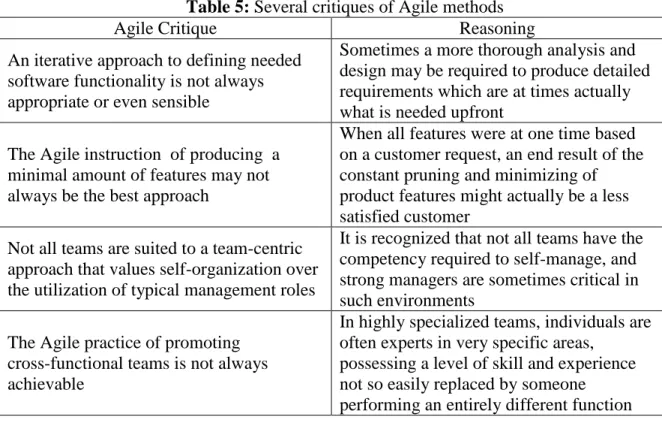
As these suggested practices indicate, the known benefits of using Agile methods might only be fully realized after a successful implementation and adoption of those methods, and that success can rely on a considerable and continuous effort that ensures adequate training, communication, teamwork, and organizational support. The
progressive gaining of Agile knowledge does seem crucial to adoption of Agile methods. As discovered in another analysis surveying software professionals (Young, 2013), it was again found that Agile methods worked well when teams had prior Agile experience and abundant technical expertise.
Table 5: Several critiques of Agile methods
Agile Critique Reasoning
An iterative approach to defining needed software functionality is not always appropriate or even sensible
Sometimes a more thorough analysis and design may be required to produce detailed requirements which are at times actually what is needed upfront
The Agile instruction of producing a minimal amount of features may not always be the best approach
When all features were at one time based on a customer request, an end result of the constant pruning and minimizing of product features might actually be a less satisfied customer
Not all teams are suited to a team-centric approach that values self-organization over the utilization of typical management roles
It is recognized that not all teams have the competency required to self-manage, and strong managers are sometimes critical in such environments
The Agile practice of promoting cross-functional teams is not always achievable
In highly specialized teams, individuals are often experts in very specific areas,
possessing a level of skill and experience not so easily replaced by someone performing an entirely different function
2.3
O
RGANIZATIONALU
SE OFA
GILEP
ROJECTM
ANAGEMENTT
OOLSThe use of software designed strictly for the management of projects has been prevalent in information technology for decades and continues to increase. The factor shown to have the greatest total effect on the usage, acceptance, and success of project management software has been information quality (Ali & Anbari, 2004).
For research on the management of Agile projects, surveys have been utilized to gather information on the many methods and tools currently in use within Agile
organizations, measuring levels of user satisfaction and perceptions of tool usefulness. Responses from one such survey, (Azizyan, et. al., 2011), compiled from 120 companies in 35 countries, showed the supporting technology and tools in use by the surveyed Agile teams falling under several distinct categories, each representing a currently settled-upon or deemed-acceptable approach for managing an Agile environment adopted within organizations.
management tool, and that a good percentage of those organizations were still making use of spreadsheets for data collection and analysis. Many other organizations were
continuing with the use of manual practices, such as planning and tracking Agile development work using paper and sticky notes on walls.
Figure 1 shows the percentage of responses for the 6 categories of Agile tools
communicated as being in use within the surveyed organizations. Table 6 describes each tool category.
Figure 1: Communicated categories of Agile tools being utilized
Table 6: Descriptions of Agile tool categories
Tools used to support Agile work Description
Vendor Agile tools Specially developed for managing Agile projects
Physical wall and paper
Basic tools used in Agile development. Examples include sticky notes used for putting up tasks on walls, and whiteboards and markers used for drawing charts
Spreadsheets All spreadsheet software, such as Microsoft Excel Traditional project management
tools
All tools used in traditional project management. One popular example is Microsoft Project Custom or in-house tools Tools created and maintained by an organization
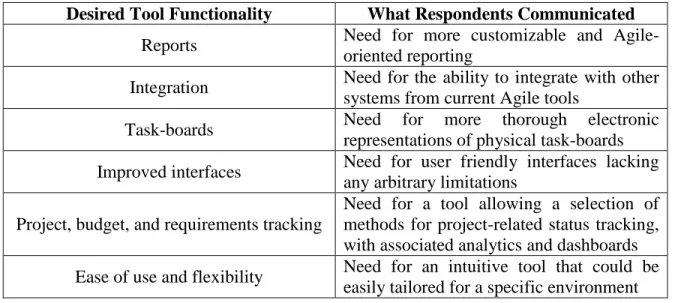
Survey results also describe the tool functionality perceived most positively or negatively by the teams. Table 7 details the requirements most frequently mentioned as desired Agile management tool functionality.
Table 7: Desired Agile tool functionality
Desired Tool Functionality What Respondents Communicated
Reports Need for more customizable and Agile-oriented reporting
Integration Need for the ability to integrate with other systems from current Agile tools
Task-boards Need for more thorough electronic
representations of physical task-boards Improved interfaces Need for user friendly interfaces lacking
any arbitrary limitations Project, budget, and requirements tracking
Need for a tool allowing a selection of methods for project-related status tracking, with associated analytics and dashboards Ease of use and flexibility Need for an intuitive tool that could be
easily tailored for a specific environment
2.4
S
CRUM,
ANA
GILES
OFTWARED
EVELOPMENTF
RAMEWORKScrum, a specific Agile methodology, will be described here, as it is the methodology in use by the Agile teams in the case study presented later in this analysis. As indicated, practitioners of the Scrum methodology became members of the Scrum Alliance, contributing to development of the principles outlined in the Agile Manifesto
(http://Agilemanifesto.org/). Scrum is a conceptual framework following those Agile principles. Scrum practices specifically focus on the simplifying of processes and documentation, and on the enhancement of team collaboration within an iterative environment (Hneif & Ow, 2009).
The development team is guided under a simplified project management model, and specific Scrum processes define the planning and delivery of iterative software releases within a prescribed cadence. Utilizing the concept of a backlog of work, the
requirements for a software product are typically broken down into distinct Features. Features are then further decomposed into User Stories. Agile teams define Stories by creating simple sentences to describe each requirement in the language of the user, in an attempt to better satisfy those requirements by approaching them from the customer’s perspective.
The list of User Stories ultimately produces the product backlog, from which work can then be relatively sized and prioritized before being selected for accomplishment within a particular iteration. Iterations for the accomplishment of Agile work are called Sprints in Scrum terminology, and the subset of the Product backlog created for a given Sprint is called the Sprint backlog. The User Stories added from the backlog to the given Sprint time-box (typically 1-3 weeks) represents a best estimate for the work considered accomplishable by the Scrum team.
For those directly participating on a team in a Scrum development environment, three primary roles exist:
A Product Owner represents the business perspective, and the associated stakeholders. This role will be instrumental in defining and translating business requirements into what ultimately becomes the product backlog of work
accomplished by a Scrum team, and determining whether the deliverables produced by the team are acceptably meeting customer requirements.
The Scrum team is made up of those doing the actual work that produces the software, such as developers and testers.
The ScrumMaster helps the team stay focused on the goals of the Sprint, serving as both a mentor and facilitator. Considered most critical among the
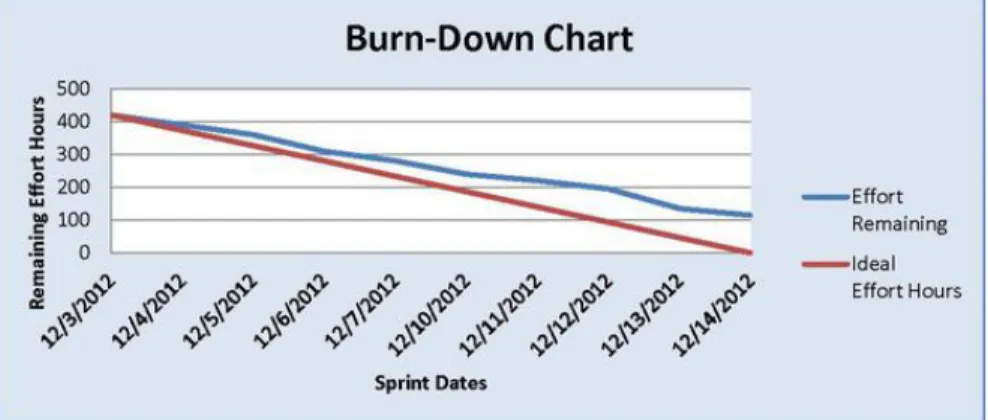
During the execution of a Sprint, the ScrumMaster facilitates a daily Scrum meeting with the team, examining the work accomplished during the previous day and within the Sprint to date, the work that’s remaining and planned for that day and the next few days, and any issues that might interfere with accomplishing the goals of the current Sprint. One of the standard tools used to evaluate the work accomplished during a Sprint is the daily updated Sprint burn-down chart, used to provide a visual depiction of the estimated and remaining work of the current Sprint. Figure 2 shows a typical burn-down chart. The chart compares the team’s estimate for effort remaining in the Sprint with an ideal burn-down of hours based upon original estimates (Mittal, 2013).
Figure 2: Typical burn-down chart used during daily Scrum meetings
At the end of each Sprint, all of the participants and relevant stakeholders conduct a review of the Sprint, examining their success at accomplishing the estimated goals and work of the Sprint, issues experienced, and lessons learned. This meeting is typically called the Sprint Review. Another prescribed meeting at the close of iterations within a Scrum environment is called the Sprint Retrospective, where the team examines the success of their methods and produces actionable commitments designed to improve the accomplishing of future Sprints.
2.5
T
ASK-T
ECHNOLOGYF
IT ANDA
GILET
EAMP
ERFORMANCEIn 1995, Goodhue and Thompson, building from earlier research that detailed a Technology-to-Performance Chain model (DeLone & McLean, 1992), introduced a now significant information technology theory of Task-Technology Fit (TTF). The theory generally proposed that there would be a positive impact on individual performance if organizations implemented technology that provided features useful to end users, i.e., fit the tasks users need to complete. Describing the relationship that exists between task requirements and system functionality, their research attempted to demonstrate how information technology, when both utilized by end users and determined to have a good functional fit for the tasks being performed, could have a positive impact on individual performance. With an abundance of research examining alternative variables and various methods for evaluating “fit”, there is not a single agreed upon definition of TTF among researchers. However, one formative study (Dishaw & Strong, 1998) succinctly defines it as "the matching of the functional capability of available software with the activity demands of the task."
Since the inception of TTF, many studies have utilized and expanded the theory into various contexts (McCarthy & Cane, 2009). A collection of distinctive research building from the original theory has produced frequent integrations with other technology
models. The most common model researchers tend to try integrating with TTF is the well-known Technology Acceptance Model (TAM). In subsequent research, Goodhue, Klein and March (2000) establish a clear differentiation between these two models, essentially clarifying that TAM can be applied to predicting use, and the TTF model can be applied to predicting performance.
Optimal usage of technology has been determined as vital to MIS organization success (Agarwal, Higgins, & Tanniru, 1991), and success of a technology
are mismatched (Goodhue, 1988; Huber, 1990; Sambamurthy, 1989; Vessey & Galleta, 1991). This concept was extensively explored in a study involving CASE technology (Lai, 1999), where it was successfully demonstrated that fit between technology and task greatly enhanced the performance of an IS workgroup.
The concept of using the fit between tasks and technology to improve organizational agility, along with performance, was examined as part of the development of an
organizational value framework in the study of Supply Chain networks (Tiwari, et al., 2006). This research demonstrated how greater agility could be achieved when Supply Chain systems had a better strategic and task fit. Existing ill-fitted technologies were leading to long delays, lost customer satisfaction, and delayed commitments. These systems were replaced with newer systems, described as having a superior and more natural fit. The results of the research were desired improvements to organizational agility through implementation of responsive systems that better facilitated the complex activities required of Supply Chain networks.
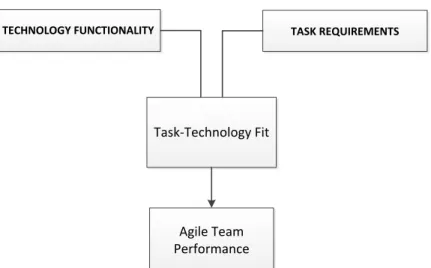
In our case study, task-technology fit will be similarly examined to evaluate how well the tasks of the Agile development team are supported by the functionality implemented through a specific Agile management technology solution, while we additionally seek to demonstrate a positive impact on team performance related to that fit and adoption of the new technology. These proposed relationships are illustrated in Figure 3.
Figure 3: Proposed relationship between TTF and Agile team performance
TECHNOLOGY FUNCTIONALITY
Task-Technology Fit
Agile Team Performance
3.
CASE STUDY
3.1
C
ASES
TUDYE
NVIRONMENT3.1.1
Setting
This case study will provide an examination of fit between the tasks performed within an Agile development environment and the functionality provided by an enterprise
project management software solution specifically developed to support the work of an Agile organization. The study will also evaluate the relationship between determined fit and team performance metrics.
This case study was conducted within a large regional banking institution that employs over 30,000 staff. The study examines the implementation and performance impact of an Agile-centric enterprise project management tool, deployed for use by the technical department responsible for the development, operation, and maintenance of the company’s customer-facing online financial applications and overall web presence.
The case study will specifically focus on the use of the tool by the five primary technical teams within this department. Each of these teams is dedicated to a specific product or responsibility area that encompasses the online offerings and web presence of the bank. The five teams examined in the study are:
Sales and Promotions
Online Banking and Mortgage Applications
Public Website Maintenance and Operations
Public Website Enhancements
Each of these teams practice Agile methods incorporating a Scrum framework. Starting in November, 2013, with the help of a dedicated Agile coach, the teams have evolved from use of a traditional waterfall approach in the accomplishment of all work to iterative Scrum practices, with the intended goals of Scrum.
3.1.2
Specific Application of Agile Scrum Methods
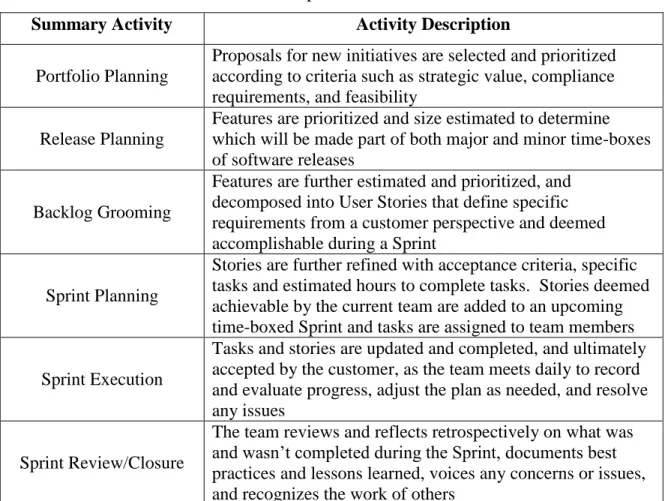
All of the Agile Scrum teams being evaluated as part of this case study perform a sequence of traditional Scrum activities aligned to a shared cadence for planning and execution of work. Before work is determined and accomplished at the Scrum team level, it is first created, selected, prioritized, and decomposed at several levels within the prescribed process of the organization, categorized by the six top-level summary
activities detailed in Table 8.
Table 8: Top level Scrum activities
Summary Activity Activity Description
Portfolio Planning
Proposals for new initiatives are selected and prioritized according to criteria such as strategic value, compliance requirements, and feasibility
Release Planning
Features are prioritized and size estimated to determine which will be made part of both major and minor time-boxes of software releases
Backlog Grooming
Features are further estimated and prioritized, and decomposed into User Stories that define specific requirements from a customer perspective and deemed accomplishable during a Sprint
Sprint Planning
Stories are further refined with acceptance criteria, specific tasks and estimated hours to complete tasks. Stories deemed achievable by the current team are added to an upcoming time-boxed Sprint and tasks are assigned to team members
Sprint Execution
Tasks and stories are updated and completed, and ultimately accepted by the customer, as the team meets daily to record and evaluate progress, adjust the plan as needed, and resolve any issues
Sprint Review/Closure
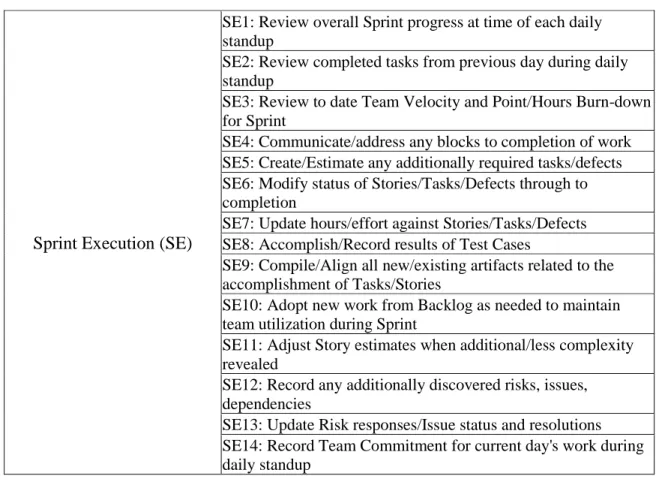
Each of these top-level summary activities is made up of a number of other activities, requirements, and specific tasks. Table 9 provides an example of the tasks accomplished during the summary activity, Sprint Execution (see Appendix A for the complete list of activities contained within each summary activity).
Table 9: Specific tasks for accomplishing Sprint Execution
Sprint Execution (SE)
SE1: Review overall Sprint progress at time of each daily standup
SE2: Review completed tasks from previous day during daily standup
SE3: Review to date Team Velocity and Point/Hours Burn-down for Sprint
SE4: Communicate/address any blocks to completion of work SE5: Create/Estimate any additionally required tasks/defects SE6: Modify status of Stories/Tasks/Defects through to completion
SE7: Update hours/effort against Stories/Tasks/Defects SE8: Accomplish/Record results of Test Cases
SE9: Compile/Align all new/existing artifacts related to the accomplishment of Tasks/Stories
SE10: Adopt new work from Backlog as needed to maintain team utilization during Sprint
SE11: Adjust Story estimates when additional/less complexity revealed
SE12: Record any additionally discovered risks, issues, dependencies
SE13: Update Risk responses/Issue status and resolutions SE14: Record Team Commitment for current day's work during daily standup
3.1.3
Agile Tool Evaluation and Selection
Project Server software was also used extensively to deliver executive-level reporting on the state of the project portfolio, the effectiveness of the teams, and whether future team capacity could meet the forecasted demand for upcoming project work. The ability to continue providing this now-expected level of visibility for senior management posed a challenge for the department as plans to adopt Agile methods proceeded, leading to thoughtful consideration of what would be required from the Agile software solution that would replace Project Server.
An Agile coach was contracted in November, 2013 to aid management and the technical teams through an Agile conversion. Over the following six months, dedicated teams were evaluated, restructured, trained and transitioned to the use of Agile practices. The Scrum framework, along with a Sprint and release cadence, was adopted, and individuals were selected and trained to fulfill their required roles as Product Owners, ScrumMasters, or Scrum team members. Eventually, by June, 2014, all teams were delivering software features from within frequent time-boxed iterations, planning and tracking work using traditional and prescribed Scrum methods, and collaborating and reviewing team progress within scheduled reviews and retrospectives.
During this transition, teams adopted mostly manual methods for planning and tracking work, including extensive use of such methods as sticky notes on a wall, used to show the estimated and current state of stories, tasks, and defects within a Sprint, the teams growing backlog of work, and the items from within that backlog being groomed for upcoming Sprints.
An existing document management tool and repository, Microsoft SharePoint, was heavily used for more permanently storing electronic records for requirements, Agile features and stories, and Agile team Sprints and Sprint progress. Microsoft Excel was used by the teams to create ad-hoc reports showing the accomplishments of a given Sprint.
planning functionality, as well as useful project metrics and reporting tailored for an Agile environment.
Management, team leads, senior analysts, and the Agile coach formed a vetting committee, initially developing the criteria for an evaluation of Agile management tools. The Agile coach’s knowledge of current vendor offerings and standard Agile tool
capabilities helped the department in documenting over sixty distinct capabilities that could be demonstrated within vendor software solutions. Based on this resulting list of technical capabilities, a useful grouping and categorization of the items to be vetted was determined, some items could be grouped under categories specific to related features in the software (e.g., reporting, idea generation), while other items logically fit under the accomplishment of an entire activity (e.g., release planning). All desired tool
functionality was categorized across nine areas: 1. Idea Generation
2. Initiative Creation and Feature Estimation 3. Portfolio and Release Reporting Requirements 4. Risks / Notifications / Artifacts
5. Quarterly Release Planning
6. Reporting and Forecasting Team Metrics and Story Delivery 7. User Story Grooming and Sprint Planning
8. Tracking team progress throughout Sprint 9. Retrospectives/ Improvement Stories
Before the vetting of the software vendors occurred, each member of the vetting committee separately provided a weighted estimate of the importance of each functionality item listed, using the following scale:
1= Not Important 2= Slightly Important 3= Moderately Important 4= Very Important 5= Extremely Important
The committee provided the Agile tool requirements to a number of potential candidates, and three software vendors agreed to provide the vetting committee a demonstration of how the vendor’s solution could best meet the department’s list of requirements. Along with the weighted requirements, the committee provided the vendors with detailed use cases, from which could be shown specific roles using the tool in the accomplishment of particular responsibilities. During the vendor demonstrations, members of the vetting committee would score a vendor’s ability to satisfy each listed function using the following scale:
1 - Unsatisfactory Performance: Product does not support function 2 - Marginal Performance: Product supports function with customization 3 - Satisfactory Performance: Product supports function with configuration 4 - Very Good Performance: Product supports function out of box
5 - Outstanding Performance: Product supports out-of-box/intuitive/no training A vendor’s Agile solution received a raw score for each item from each team
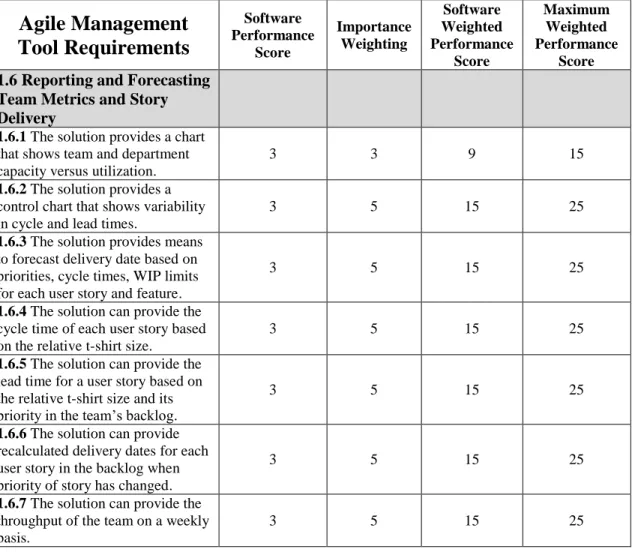
member, which was later averaged across all team members to produce a final raw score for the item. An item’s raw score was then multiplied by the aforementioned average weighting for the particular item, calculating an item’s weighted score.
Table 10: Example of chosen vendor scoring against weighted requirements
Agile Management
Tool Requirements
Software Performance
Score
Importance Weighting
Software Weighted Performance
Score
Maximum Weighted Performance
Score
1.6 Reporting and Forecasting Team Metrics and Story Delivery
1.6.1 The solution provides a chart that shows team and department capacity versus utilization.
3 3 9 15
1.6.2 The solution provides a control chart that shows variability in cycle and lead times.
3 5 15 25
1.6.3 The solution provides means to forecast delivery date based on priorities, cycle times, WIP limits for each user story and feature.
3 5 15 25
1.6.4 The solution can provide the cycle time of each user story based on the relative t-shirt size.
3 5 15 25
1.6.5 The solution can provide the lead time for a user story based on the relative t-shirt size and its priority in the team’s backlog.
3 5 15 25
1.6.6 The solution can provide recalculated delivery dates for each user story in the backlog when priority of story has changed.
3 5 15 25
1.6.7 The solution can provide the throughput of the team on a weekly basis.
3 5 15 25
3.2
S
ELECTEDS
OLUTION:
E
VALUATION OFF
IT ANDP
ERFORMANCEI
MPACT3.2.1
Fit of Tool Functionality to Applied Scrum
Characteristics
For the department’s specific application of Agile Scrum methods described in Section 3.1.2 and detailed in Appendix A, an analysis was accomplished to determine fit between those Scrum team tasks and the vetted functionality provided by the
For each specific task falling under one of the top-level summary activities, a list was compiled of the specific functionality within the chosen software solution that could be determined to support accomplishment of that task. The list of specified functionality was derived from the same list of requirements already given a score and a weighting (see Appendix B) during the software solution vetting process.
Any of the more than sixty weighted tool functional requirements could be
determined to support any task. Many Scrum tasks were determined to be supported by more than one function from within the tool. Every item of vetted tool functionality provided support for at least one of the Scrum tasks.
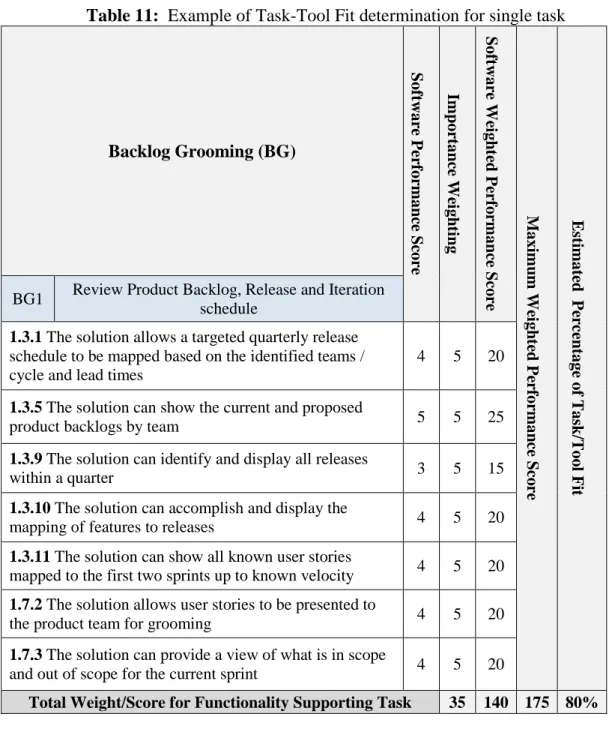
Using these determined weightings and scores for tool functionality agreed upon by the organization’s vetting committee, a measurement of task-tool fit was calculated for each task, by combining the overall weightings and scores for all of the combined functionality determined in support of the task to reach an estimated percentage of task-tool fit.
Table 11: Example of Task-Tool Fit determination for single task
Backlog Grooming (BG)
Soft w ar e Per for m anc e Sc ore Im por tanc e We igh ting Soft w ar e We igh ted Pe rf o rm anc e Sco re Maxi m u m We igh ted Pe rf orm an ce Sco re E st im at
ed Pe
rc en tage of T ask/ T oo l Fi t
BG1 Review Product Backlog, Release and Iteration schedule
1.3.1 The solution allows a targeted quarterly release schedule to be mapped based on the identified teams / cycle and lead times
4 5 20
1.3.5 The solution can show the current and proposed
product backlogs by team 5 5 25
1.3.9 The solution can identify and display all releases
within a quarter 3 5 15
1.3.10 The solution can accomplish and display the
mapping of features to releases 4 5 20
1.3.11 The solution can show all known user stories
mapped to the first two sprints up to known velocity 4 5 20
1.7.2 The solution allows user stories to be presented to
the product team for grooming 4 5 20
1.7.3 The solution can provide a view of what is in scope
and out of scope for the current sprint 4 5 20
Total Weight/Score for Functionality Supporting Task 35 140 175 80%
As shown, many functional items provided by the tool can be determined to support one task. Also, as indicated, many functional items support more than one task, and every functional item supports at least one task. To illustrate the number of functions in
Table 12: Tasks supported by each function
Agile Management Tool Requirements
1.6 Reporting and Forecasting Team Metrics and Story Delivery
1.6.1 The solution provides a chart that shows team and department capacity versus utilization. (PP3, RP3, SP2, SR5)
1.6.2 The solution provides a control chart that shows variability in cycle and lead times. (RP3, SP2)
1.6.3 The solution provides means to forecast delivery date based on priorities, cycle times, WIP limits for each user story and feature. (SR6)
1.6.4 The solution can provide the cycle time of each user story based on the relative t-shirt size. (RP3)
1.6.5 The solution can provide the lead time for a user story based on the relative t-shirt size and its priority in the team’s backlog. (RP3)
1.6.6 The solution can provide recalculated delivery dates for each user story in the backlog when priority of story has changed. (SR6)
1.6.7 The solution can provide the throughput of the team on a weekly basis. (PP3, SP2, SR5)
The top-level Scrum activities have been abbreviated as follows: PP for Portfolio Planning, RP for Release Planning, BG for Backlog Grooming, SP for Sprint Planning, SE for Sprint Execution, and SR for Sprint Review/Closure. Each task within each summary activity is numbered, as shown in Appendix A. In Table 12, functional item 6.1 is shown to be in support of PP3, RP3, SP2, and SR5, demonstrating that the team and department capacity vs. utilization chart provided by the tool has been determined to provide functionality that supports tasks within four of the six top-level Scrum activities.
As described, the Task-Tool fit percentage for each task of a summary activity was calculated. The average Task-Tool fit percentage from all tasks falling under each of the top-level summary activities was also calculated, providing an estimated percentage of Task-Tool fit for each summary activity. Table 13 provides the calculated percentages (see Appendix C for the complete task-tool fit analysis). Portfolio Planning, Release Planning, and Spring Planning are best supported by the selected tool; Spring
Table 13: Estimated Task-Tool Fit for summary activities
Summary Activity Estimated Percentage of Task-Tool Fit for Entire Activity
Portfolio Planning 81%
Release Planning 82%
Backlog Grooming 77%
Sprint Planning 82%
Sprint Execution 77%
Sprint Review/ Closure 72%
3.2.2
Agile Team Data-Driven Performance Metrics
Research determining the success of adopting Agile methods for software
development has frequently tended towards the qualitative. With such stated goals as increasing customer satisfaction, improving team collaboration, and securing
organizational commitment, actual measurements of Agile success are frequently derived from the collected results of user and stakeholder surveys (Dybå, & Dingsøyr, 2008). A goal of this paper is the examination of Agile team performance, and the relationship between task-technology fit and the achievement of measurable team performance improvements when implementing an Agile project management software solution. To that end, the metrics used within this study will be quantitative metrics for Agile methods in relation to team performance. If measured both before and after implementation of the electronic Agile project management tool, improvements in team performance can be assessed; it would be expected that better Task-Tool fit will be associated with larger performance improvements.
The actual Agile performance metrics to be considered in this study are derived from within the Scrum framework, and specific to what’s measureable within the Scrum practices adopted by the teams within the case study. It is proposed that the
implementation of the Agile software tool, which we have determined should provide a positive measure of support towards the accomplishment of Scrum team tasks, will also result in a corresponding positive impact on team performance.
In the context of this case study, the team performance measurements to be used are related to the accomplishment of tasks within only two of the six Scrum top-level
summary activities: Sprint Planning and Sprint Execution. The teams being evaluated for performance have progressed sufficiently and produced usable results in the performance of these two summary activities, both before and after implementation of the software solution, yielding the type of quantitative metrics we wish to evaluate. We chose not to try and measure success in the accomplishment of two of the other summary activities, Backlog Grooming and Sprint Review/Closure, since neither team activity yet produces metrics that could be considered quantitative or that could be seen as producing a performance measure attributable to TTF. Additionally, the teams being evaluated have yet to produce much usable data in the remaining two summary activities, Portfolio Planning and Release Planning, especially in the months since the tool has been implemented.
A primary underlying metric used to evaluate progress in Agile environments is the Story point, used primarily as a means to estimate the difficulty of implementing a Story. Story point estimations are expressed by the teams according to a size range from XS (extra small) to XL (extra large). A Story size is estimated based upon what is known of the Story’s particular complexity. A size estimate, like XL, is represented by an
arbitrarily assigned number of Story points along a defined scale. On the teams being evaluated in this study, for example, an XL is equal to 13 Story points.
Story Points will be the metric used in the calculations of performance measurements. For example, a measurement of the total amount of work the team can accomplish during a Sprint is a measure of accomplished Story points.
For Sprint Planning, those few metrics used for measuring performance impact will be Commit Accuracy and Estimation Accuracy. For Sprint Execution, the metric of Actual Added Value will be used. Each of these metrics is the result of calculations using values from one or more of the other gathered metrics.
The measurements to be used in determining Sprint Planning success are detailed in Table 14. The measurements to be used in determining Sprint Execution success are detailed in Table 15.
Table 14: Sprint Planning performance metrics
Performance Measurements contributable to Sprint Planning
Use Metric Operational Measure Description
Metric result used for calculating other metrics Adopted Work
Estimates of Work Pulled Forward / Original Commitment
This is a measurement of how much work beyond the original estimate was pulled forward to stay engaged. Poor Sprint Planning results in Scrum teams running out of work mid-Sprint and needing to pull more work from the Backlog. Improved planning should result is less Adopted Work.
Found Work
Work reported for tasks - Original estimates /
Total Commitment
This is the amount of discovery of unexpected complexity within tasks during a Sprint, another indication of improper estimation during planning. The ability to accurately estimate work complexity should improve over time.
Metric result used in measuring performance impact Estimation Accuracy
Estimate Difference / Total Commit
As a Sprint proceeds, the accuracy of Story point estimations made in Sprint Planning is determined using this calculation. The team’s understanding of how accurately work is being estimated should help in improving estimation ability over time.
Commit Accuracy
Original estimates / original + adopted +
found
This represents the margin of error from what a team has committed by
Table 15: Sprint Execution performance metrics
Performance Measurements Contributable to Sprint Execution
Use Metric Operational
Measure Description
Metric result used for calculating other
metrics
Velocity
Sum of Original Estimates for all Approved
Stories
This metric represents the Value planned and accomplished during a Sprint. It is a measure of value since the difference between Velocity and Work Capacity is that Velocity is only concerned with the sum of Approved Stories. Approved Stories indicate the part of the effort accepted as valuable by the customer. Improved Velocity would show an increase in that added value.
Total Commitment
Sum of Original Estimates for all User Stories
This represents the amount of work the team ultimately commits to for the Sprint (including Adopted work).
Work Capacity
Sum of Work Reported During Sprint
Measures the total amount of work the team can accomplish during a Sprint. Useful for seeing what a Scrum Team is capable of accomplishing, but also used in determination of what percentage of total effort is actually valuable.
Metric result used in measuring performance
impact
Actual Added Value
Velocity / Work Capacity
3.2.3
Impact of Implemented Tool on Measurable Team
Performance
Each of the five Agile Scrum teams were measured using all of the Sprint Planning and Sprint Execution metrics detailed in Section 3.2.2 both pre- and post-implementation of the Agile project management tool. Each of these teams follows a specific cadence with Sprints of varying lengths, ranging from 1 week (5 days) to 3 weeks (15 days). Consequently, the numbers associated with the amount of work a team can accomplish during a Sprint will vary according to team Sprint length.
As mentioned, each of these teams moved to practicing Agile and the Scrum
methodology starting in November 2013. The start of pre-tool data collection, for some teams as early as May, 2014, begins at a time when a team would have been considered past the initial stages of learning Scrum practices and began producing data to track their progress that could be considered useful enough to consider for the purposes of this study. That starting point, along with the length of a team’s Sprint, is what determined the number of completed Sprints from which pre-tool data would be collected for each team.
Implementation of the Agile tool for use by each team occurred over the course of several weeks, with the tool deployed for all teams by January 2015. Some amount of time was given to allow adequate team acclimation with use of the tool before post-implementation data collection could begin and be considered useful. Once again, that start, and the length of a team’s Sprint, determined the number of Sprints from which data would be collected. Also, the length of time since the Agile tool implementation is less than the time teams spent practicing Scrum without use of a tool, so the number of Sprints being measured post-implementation will always be less than the number of Sprints measured pre-implementation for each team. Table 16 details Sprint lengths and number of Sprints used to collect data for each team. All of the measurements collected across the pre-tool Sprints and post-tool Sprints were averaged to show overall
Table 16: Sprint lengths and number of sprints evaluated
Team Cadence - Length of
Sprint
Number of Completed Sprints producing useful data
Scrum Teams
Before Agile
Tool
Since Agile Tool
Sales and Promotions 5 days 19 11
Online Banking and Mortgage Applications 10 days 12 6
Public Website Maintenance and Operations 5 days 16 9
Public Website Enhancements 15 days 9 3
Integrated Financial Planning Applications 15 days 10 4
As determined by the Task-Technology Fit analysis, implementation of the Agile tool should provide support and a level of fitted functionality for the tasks required within the Sprint Planning and Sprint Execution activities. We propose that this fit should also demonstrate a measurable level of improved performance in the accomplishment of these activities.
As indicated, performance impact from use of the tool was measured by comparing averages across all usable Sprints both pre- and post-implementation of the Agile tool. For any calculations resulting in a Story Points increase or decrease, an estimate of Percent Improvement was also calculated. Table 17 provides an example of the data collected for one Sprint Execution Measurement: Team Velocity (see Appendix D for complete Sprint Planning Measurements and Appendix E for complete Sprint Execution Measurements).
Table 17: Measurements and performance impact for Agile team velocity Average Team Velocity
Scrum Teams Before
Agile Tool
Since Agile Tool
Tool Perf. Impact
Percent Improvement
Sales and Promotions 52 49 -3 -6%
Online Banking and Mortgage Applications 199 232 33 14%
Public Website Maintenance and Operations 91 105 14 13%
Public Website Enhancements 273 342 69 20%
Integrated Financial Planning Applications 397 422 25 6%
For Sprint Planning, our analysis estimated a percentage of task-tool fit of 82% for the overall activity, so it was expected that this level of fit should positively impact Sprint Planning performance. Table 18 provides the overall average performance impact seen for Sprint Planning measurements across teams, and the estimated average percentage of performance improvement from the two metrics being used to evaluate performance impact.
Table 18: Overall performance impacts using Sprint Planning measurements
Use Metric Operational Measure
Average Impact
Across Teams
Metric result used for calculating other metrics
Adopted Work
Estimates of Work Pulled Forward / Original
Commitment -2%
Found Work
Work reported for tasks - Original estimates /
Total Commitment -2%
Metric result used in measuring performance
impact
Estimation
Accuracy Estimate Difference / Total Commit 3%
Commit
Accuracy Original estimates / original + adopted + found 3%
Estimated Average Percentage of Improvement for Sprint Planning 3%
For Sprint Planning, all teams either decreased the amount of adopted work on average or stayed the same. That is a positive result, since less adopted work illustrates better understanding of the amount of work that should be added to a Sprint, and less underestimating of what is accomplishable, so this result can be interpreted as an average 2% improvement across teams.
All but one team showed less found work on average. For most teams, this indicates they’re performing better in Sprint Planning at estimating complexity of work, and not discovering as much hidden Story complexity during Sprints. This result can be also be interpreted as an average 2% improvement across teams.
The improvements showing less found and adopted work helped the second performance metric of commit accuracy increase slightly for all teams. A continued improvement on estimating properly ensures teams are less surprised by more or less work than anticipated occurring during Sprints.
Using the average of the increase in percentages of commit accuracy and estimation accuracy, Sprint Planning saw an overall improvement of 3% across teams. We propose that this overall improvement in accuracy during Sprint Planning can be attributed to the implementation of tool functionality determined as well-fitted to the tasks of the Sprint Planning activity.
For Sprint Execution, our analysis estimated a percentage of task-tool fit of 77% for the overall activity, so it was expected that this level of fit should positively impact Sprint Execution performance at near the same level as observed with Sprint Planning. Table 19 provides the overall average performance impact seen for Sprint Execution measurements across teams, and the estimated average percentage of performance improvement from the metric being used to evaluate performance impact.
Table 19: Overall performance impacts using Sprint Execution measurements
Use Metric Operational Measure
Average Impact Across
Teams
Metric result used for calculating other
metrics
Velocity Sum of Original Estimates for all
Approved Stories 10%
Total Commitment
Sum of Original Estimates for all
User Stories 4%
Work Capacity
Sum of Work Reported During
Sprint 6%
Metric result used in measuring performance
impact
Actual Added Value
Velocity / Work Capacity 3%
Estimated Average Percentage of Improvement for Sprint
Execution 3%
the Agile tool may well be contributing to the added value these teams are delivering through an increase in the number of approved Stories.
The impact to total commitment varied widely from team to team, some experiencing a large increase while others a slight decrease.
Three of the five teams saw a decent rise in work capacity, an indication of a team’s ability to accomplish more work in the same timeframe.
For the performance measurement of actual added value, all but one team saw a positive impact. An increase to this metric indicates that teams are working smarter, by producing more work deemed valuable by the customer and wasting less time on work that is not. We propose that the 3% overall increase in team performance against this metric in added value during Sprint Execution can be attributed to the implementation of tool functionality determined as well-fitted to the tasks of the Sprint Execution activity.
Our Task-Tool Fit analysis demonstrated that tool functionality was determined to support the tasks of the Sprint Planning activity by 5% more than those of Sprint Execution. The estimated overall average performance impact provided by task-tool fit, however, was shown to be the same for both activities. Interestingly, there was much more variability across teams in the impact on Sprint execution; this result will need further examination within the teams. We do conclude that both performance increases can be attributed to a good task-tool fit, as the accomplishment of both activities can be seen as enhanced through team use of the tool, but offer no direct mathematical
correlation that could help determine specifically why Sprint Planning did not result in a slightly higher performance to correspond with its slightly higher fit. These results allow us to generally conclude that performance in the completion of both activities was
4.
DISCUSSIONS, PRACTICAL IMPLICATIONS, AND
CONCLUSION
The practical application of Agile methodologies can demand a considerable amount of structure, knowledge, and discipline from software development teams, as was the case with the Scrum teams described in this paper. Without proper commitment, an organization may never actually realize the purported benefits of moving their teams to Agile methodologies, and without the proper means to measure those benefits, some organizations may not even be aware when a move to Agile methods hasn’t helped.
In this study, we first explored the reasons behind a massive move in software development towards iterative, adaptive, customer-focused Agile practices, and the acknowledged Agile benefits of more satisfied customers, higher productivity, less project failure, and more collaborative and empowered software development teams.
We then examined how an organization moving to Agile methods might actually measure the achievement of such benefits, and found the frequent use of qualitative methods for determining customer, stakeholder, and team satisfaction. In this study, however, we were interested in the quantitative measurements used for evaluating the realized benefits of Agile methods. Ultimately, the metrics used in the study can quantify the amount of business value Agile teams are providing customers, and the level of accuracy at which Agile teams determine how to consistently provide that value.
An understanding of Agile benefits and how they can be quantitatively measured was one of the goals for the case study presented here, where task-technology fit and
performance impact of an enterprise project management implementation was evaluated. Those ultimate measurements of performance, however, followed the more detailed examination of task-tool fit.
and delivering on their first Sprints, sustaining the practices of using sticky notes and spreadsheets for the recording of Agile work clearly seemed unmanageable.
Management was used to useable metrics for determining team and project status and progress, and the first six months of practicing Agile had resulted in a relative halt to the level of reporting to which they’d become accustomed. Enterprise Agile project
management solutions promised a return to robust reporting and data-driven metrics. The actual vetting of the Agile tool against the provided list of requirements from the vetting committee was a process primarily intended to detail and evaluate the list of known electronic features and functions within the tool solutions. Many of the tool functional requirements being vetted were seen as singular replacements for something the team was already accomplishing, either manually or through the less efficient use of other software applications not specifically designed to facilitate Agile work.
This is typical in the vetting process for the purchase of an enterprise software application. In this case study, the list of requirements on which the selection of the Agile tool was based were loosely grouped together under several categorizations, but it was each singular requirement that was being communicated to vendors as a request for demonstrating a specifically provable feature within the tool solutions. As was
accomplished in the case study, these requirements can also be individually weighted for importance and then scored for each solution presented.
The vetting process for tool selection performed in this case study examined particular samples of tool functionality. A determination of whether a tool solution addresses a specific requirement, such as “The solution provides a mechanism for the versioning of attached artifacts”, essentially only serves to evaluate whether the tool does or does not provide one specific feature.
In hindsight, after completion of the case study, and the Task-Technology Fit exercise that evaluated fit between the weighted and scored tool functionality and prescribed Scrum activities and tasks, the use of the standard vetting process for the original
selection of the Agile enterprise project management tool seems lacking. Evaluating how well each particular Scrum task was supported by the already vetted functionality
recurring Scrum activity, seemingly provided much more visibility into the actual value an Agile tool solution provided these Scrum teams in the accomplishment of their work.
The much deeper analysis necessitated by the evaluation of fit allowed for more thorough understanding of the precise sequence and breakdown of activities practiced by the Scrum teams, and essentially provided a roadmap for the ways in which a tool can be utilized all along that sequence and across the entire development lifecycle. What this proposes is that evaluation of Task-Tool fit could greatly complement the typical vetting process for selection of enterprise software applications. More specifically, we feel the particular Task-Tool fit evaluation provided in this study could be used as a template for assisting other organizations in the evaluation of enterprise project management software solutions for supporting the activities of agile software development, most ideally for use by teams working within the Scrum framework.
Beyond the determination of fit, the case study attempted to demonstrate that good Task-Tool fit could result in improved performance across the Scrum teams based upon selected quantitative metrics. With the single exception of one Scrum team dropping 1% in Actual Added Value (one of the three calculated Scrum metrics used to measure performance impact), every calculated metric used to measure performance impact increased for every Scrum team using the tool solution. This was encouraging data. We propose these results are highly related to the tool implementation and the recognized level of fit it provides for accomplishment of tasks within the Scrum summary activities. The actual metrics used were directly related to value provided to customers and team efficiency, so an increase in these values across teams was certainly desirable.
The inability to evaluate the performance impact related to tool fit for the other Scrum summary activities limits the findings of this study. Much of the functionality vetted in the tool was determined to also fit well with accomplishment of tasks in those other summary activities, but as stated, the other summary activities either did not lend