Paper for the M.S. in L.S. degree. April, 2004. 74 pages. Advisor: Robert Losee.
This study reports the interview responses of ten electronic resource selectors at the University of North Carolina at Chapel Hill. The interviews were conducted to determine how selectors analyze usage statistics and whether selectors would prefer to use less specific, more specific, or a combination of both kinds of statistics to evaluate electronic indexes and databases. Another goal was to determine whether selectors would prefer to use citation analysis, vendor-generated statistics, or a combination of these methods to evaluate electronic journals.
Most participants consider statistics within the context of the cost and the content of the resources. Most selectors would prefer to use a combination of less and more specific measures for evaluating electronic indexes and databases and a combination of citation analysis and vendor-generated statistics for evaluating electronic journals. Selectors’ rankings of individual measures varied considerably according to their judgments of which measures indicated the highest level of use.
Headings:
Use studies—Electronic Journals Use studies—Full-text databases Citation analysis
SELECTORS’ CHOICES: STATISTICS FOR EVALUATING E-RESOURCES
by
Rebecca L. Kemp
A Master’s paper submitted to the faculty of the School of Information and Library Science of the University of North Carolina at Chapel Hill
in partial fulfillment of the requirements for the degree of Master of Science in
Library Science.
Chapel Hill, North Carolina April 2004
Approved by
Acknowledgements
Thanks are due to many people for helping me with this research project. First and foremost, thank you to all of the selectors who agreed to participate in this project. Without your input, I would not have any findings to report. Dr. Robert Losee has been a patient and accessible advisor, who always offered wise and timely advice. Selden Lamoureux has been a wonderful mentor and field experience advisor. She sparked my interest in electronic resources and has facilitated my education in this field at every step of the way. Through a conversation with Joanna Duy, I received my inspiration to try to determine which statistical measures are important to selectors. Despite her extremely busy schedule, Janet Flowers graciously gave of her time to discuss the issues with me, to send me relevant information, and to arrange for me to meet with people who became instrumental to my research. Thanks to Andy Ingham and Tim Shearer, who explained the library-generated session count to me. Many thanks to Luke Swindler for his invaluable input.
Although I could not have written this paper without the help of many, any mistakes are entirely my own.
TABLE OF CONTENTS
I. Introduction………..3
II. Background Information……….6
III. Methodology………27
IV. Analysis of Results………..32
V. Recommendations……….52
VI. Conclusion………...57
Bibliography………..61
Appendix A: Letter Requesting Study Participation……….65
Appendix B: Interview Design………..68
I. Introduction
As electronic indexes, databases, and journals have begun to swallow greater proportions of libraries’ acquisitions budgets, interest in methods of evaluating these electronic resources (e-resources) has increased. Evaluation is necessary for the purposes of selecting e-resources and, equally importantly, of canceling e-resources.1 Despite the basic problems that have emerged in the effort to collect and analyze library-generated statistics, vendor-generated usage statistics, and citation statistics, libraries have no other usage statistics on which to base cancellation decisions. One problem is that the
statistical measures themselves do not necessarily represent actual usage patterns. Another problem is that the statistical measures with which libraries can study the vendor-generated and library-generated statistics are still in the process of being defined, measured, and reported in consistent and comparable ways. Yet another problem is that library staff members disagree about how to interpret these measures as indicators of actual usage and thus of e-resource value.
Library personnel who interpret these statistics, electronic resource selectors, are responsible for assessing the needs of the library community and making decisions about which resources to license and which to cancel. This paper will present trends in the interview responses of a sample of ten selectors at the University of North Carolina at Chapel Hill (UNC-Chapel Hill or UNC) who were asked to assume that they are
1
evaluating resources during a cancellation project. Based on the trends presented, this paper will also recommend certain kinds of functionality that electronic resource management software should possess in order to accommodate the needs of selectors in performing their analyses.
The interviews sought to discover how a sample of UNC-Chapel Hill e-resource selectors currently evaluate e-resources and how they would evaluate e-resources under the “ideal” conditions that all e-resource vendors (and the libraries themselves, as much as possible) provide reliable and comparable usage statistics. The interview questions about ideal conditions were intended to provide answers to the following question: when presented with a set of measures of e-resource usage statistics, do UNC-Chapel Hill Library e-resource selectors prefer to evaluate electronic indexes and databases (EIDs) with a combination of less specific and more specific cost-per-use measures or just one of these types of measures, and do they prefer to evaluate e-journals (EJs) with a
combination of cost-per-use measures and citation analysis measures or just one of these kinds of measures? In this question, “cost-per-use measures” are measures such as session count, number of PDF downloads, and others that indicate usage and may be used in calculating cost-per-use. “Less specific measures” are those such as session count, which provide a rough estimate of overall use, and “more specific measures” are those such as number of PDF downloads, which indicate more detailed information about the e-resource.
II. Background Information
When a library wants to evaluate electronic resources, the staff members must understand the context in which the resources need to be evaluated, what any available usage statistics measure, and how these particular measures indicate use, regardless of whether they are library-generated or vendor-generated. This introduction will present first the definitions of library-generated statistics, followed by definitions of vendor-generated statistics and a description of attempts to standardize the ways that these statistics are reported and analyzed. Then it will describe methods of gathering and interpreting usage statistics. The next portion of the chapter will define different citation analysis measures and describe methods of interpretation for citation analysis. The chapter will conclude with an examination of electronic resource management (ERM) software and a description of the context in which the selectors at UNC-Chapel Hill gather usage data.
A. Usage Statistics
1. Library-Generated Statistics
clicks a link to an electronic resource from a gateway page, the server log generates a log entry that includes the date and time of the click, the web address of the link clicked, and the Internet Protocol (IP) address of the computer from which the link was clicked.2 The total of these clicks represents the library-generated session count, which here is just an overall number of times any person clicked the link to a particular UNC e-resource.
At UNC, archived session totals are available for staff members to view. For each month of the year, for the entirety of the fiscal year, and for the entirety of the calendar year, session counts are available per resource title. All the electronic indexes and databases are grouped together alphabetically, as are the electronic journals.
Although the library can collect this session count, the library is unable to gather statistics on the links that users click once they are within a certain vendor’s site, because these hits are registered on the vendor’s server log rather than the library’s log. Because of the library’s inability to collect this information, it relies on individual vendors to provide the statistics they can gather from their server logs.
2. Vendor-Generated Statistics and Standards for Reporting Them
There is quite a bit of variation in what vendors gather, however. Joanna Duy and Liwen Vaughan conducted a study at North Carolina State University (NCSU) to
compare the vendor-provided data with library-collected data. Duy and Vaughan note that vendor data are inconsistent; one vendor may count a single search across several databases to be only one search, whereas another may consider a comparable search
2
across several databases to be several searches.3 For this reason, Duy and Vaughan decided to compare only the broad measure of “hits,” or session-count, as described in the previous section.4
The NCSU attempt to compare library-generated and vendor-generated statistics highlights the need for both descriptive and prescriptive standards in order to interpret usage statistics successfully. The National Information Standards Organization (NISO) Z39.7-200X standard, a data dictionary of metrics and statistics, carries out both
functions. The Z39.7-200X standard is derived from the International Organization for Standardization (ISO) code 2789, Annex A 2789. NISO Z39.7-200X includes very detailed definitions of terms relevant to libraries’ needs to gather statistics.5 Z39.7-200X has been undergoing a period of revision during the duration of this study, as it is such a new standard and the context of this information is changing so quickly. In the most recent version of Z39.7-200X, sessions and searches are defined differently for
commercial products and library-generated services such as their Online Public Access Catalogs (OPACs). Some definitions of the most relevant measures follow, because these measures are directly referenced by the interview. It must be noted, however, that the interview design used in the study includes more generic definitions of measures, in accordance with the earlier version of the NISO Z39.7 draft standard, NISO Z39.7-2002, version 2002a.
3
Duy, Joanna and Liwen Vaughan. “Usage Data for Electronic Resources: A Comparison between Locally Collected and Vendor-Provided Statistics.” The Journal of Academic Librarianship 29.1 (2003): 16-22.
4
Duy and Vaughan 17.
5
National Information Standards Organization. “7.8.1 Electronic Collection.” NISO Z39.7-200X Draft Standard for Trial Use, Information Service and Use: Metrics & statistics for libraries and information providers – Data Dictionary, 7.8 Use. 2004. 11 Mar. 2004
In the NISO Z39.7-200X draft, a “session” in a commercial database is “a successful request of a commercial service (e.g., online database). It is one cycle of user activities that typically starts when a user connects to a database and ends by terminating activity in the database that is either explicit (by leaving the database through log-out or exit) or implicit (timeout due to user inactivity).”6 The NISO document then goes on to note that where multiple databases are searched by submitting one search form, the vendor must provide additional information about these multiple databases (presumably, the vendor must provide separate session counts for each separate database). The other caveat with session counts relates to the amount of time decided on by the vendor before the session times out. For many products, this amount of time is thirty minutes. NISO stipulates that “If another timeout period is used this should be reported,” presumably by the vendor.7
While the session count is a measure of overall usage of an electronic resource, indicating that a user spent some amount of time interacting with the resource, this session count cannot indicate any specific user behaviors once the user began to interact with the resource. A more specific indicator of user behavior is the “search,” also known as a “menu selection” or “query.” This measure is defined for commercial services as “intending to represent a unique intellectual inquiry. Typically a search is recorded every time a search request is submitted to the server.” 8 This count should include menu
6
National Information Standards Organization. “7.8.1.3.2, Commercial Services Sessions.” NISO Z39.7-200X Draft Standard for Trial Use, Information Service and Use: Metrics & statistics for libraries and information providers – Data Dictionary, 7.8 Use. 2004. 11 Mar. 2004
<http://www.niso.org/emetrics/current/subcategory7.8.1.html>.
7
National Information Standards Organization. “7.8.1.3.2, Commercial Services Sessions.”
8
National Information Standards Organization. “7.8.1.2.2, Commercial Services Searches (Queries).” NISO Z39.7-200X Draft Standard for Trial Use, Information Service and Use: Metrics & statistics for libraries and information providers – Data Dictionary, 7.8 Use. 2004. 11 Mar. 2004
selections according to the NISO standard. Again, NISO inserts the caveat that certain interactions that may look like searches are actually not: “mistyped search strings” and spider or crawler searchers are not legitimate searches.
As a search count can indicate a more detailed level of user activity within an electronic resource, so may the number of “full-content units examined.” This measure indicates the “number of subscription service full-content units examined, downloaded, or otherwise supplied to user, to the extent that these are recordable and controlled by the server rather than the browser (ICOLC Guidelines, December 2001).” The notes
regarding this definition stipulate that for journals, the number of journal articles examined should be organized by journal title and ISSN. In addition, for reference sources such as encyclopedias or dictionaries, the units should be relevant to the source type; for example, the unit for a dictionary would be “definition.” The final stipulation is that types of resources such as images should be identified by file type, presumably by the tag “image” or “audio” or “video,” as appropriate.9
The last measure of importance to this paper is the “turnaway” from a commercial database (also called a “rejected session”). The turnaway is “an unsuccessful log-in to an electronic service by exceeding the simultaneous user limit. (ISO 2789, Annex A).”10 This count does not include the number of users denied access because they entered incorrect passwords.
9
National Information Standards Organization. “7.8.1.1.2, Commercial Services Full-Content Units Examined.” NISO Z39.7-200X Draft Standard for Trial Use, Information Service and Use: Metrics & statistics for libraries and information providers – Data Dictionary, 7.8 Use. 2004. 11 Mar. 2004 <http://www.niso.org/emetrics/current/subcategory7.8.1.html>.
10
National Information Standards Organization. “7.8.1.4, Rejected Sessions (Turnaways).” NISO Z39.7-200X Draft Standard for Trial Use, Information Service and Use: Metrics & statistics for libraries and information providers – Data Dictionary, 7.8 Use. 2004. 11 Mar. 2004
The International Coalition of Library Consortia (ICOLC) guideline relies on the NISO definitions for general definitions of the statistical measures, and contributes to specific details of the NISO definitions, as seen in the definition for “search” counts. In 1998, ICOLC proposed standard measures for vendors to report to libraries, which became the predecessor to the current ICOLC standard. The 1998 ICOLC Guidelines required that vendors report certain measures by each database, by institutionally defined sets of IP addresses, by total consortium, by account number or other vendor-provided identifier, and by time period. The particular measures included number of queries or searches, number of menu selections, number of sessions or logins, number of turnaways, number of items examined, and counts of displays of specific kinds of pages, such as abstracts.11
The second incarnation of the ICOLC standard, published in 2001, also stipulates that vendors send reports by each database, by group of IP addresses, etc. It also requires number of sessions / logins, number of queries / searches, and number of menu
selections. The new version requires the “number of full-content units” to be reported, unlike the old version. This includes journal articles, dictionary definitions, encyclopedia articles, and e-book titles.12 It requires vendors to report usage by consortium and by institution. The site lists 80 members, which is a current list as of February 4, 2002. These members include such institutions as the Association of Southeastern Research
11
International Coalition of Library Consortia, “ICOLC Guidelines for Statistical Measures of Usage of Web-Based Indexed, Abstracted, and Full Text Resources,” Information Technology and Libraries 17.4 (1998): 219-221.
12
International Coalition of Library Consortia. Guidelines for Statistical Measures of Usage of Web-Based Information Resources (Update: December 2001). Dec. 2001. 9 Apr. 2004.
Libraries (ASERL), the California Digital Library, and the British Joint Information Systems Committee (JISC), among other well-respected consortia.
Another major initiative is that of Counting Online Usage of NeTworked Electronic Resources (COUNTER). There are two levels of COUNTER-compliance. For a vendor to satisfy the more basic, first level of COUNTER-compliance, journal vendors must supply the number of successful full-text article requests and the number of turnaways by month and journal. Database vendors must supply the total number of searches and sessions by month and database and turnaways by month and database.13 The second level of COUNTER compliance asks for successful item requests and turnaways by specific page type, in a manner similar to the ICOLC standard.14
COUNTER has specified different kinds of reports for vendors to use in order to assure compliance. As of this writing, there are 22 vendors who are COUNTER-compliant to some degree.15 Elsevier Science is now both ICOLC- and COUNTER-compliant, and Swets Blackwell is COUNTER-compliant at the second level. COUNTER is becoming more and more accepted in the vendor community.
All of the measures used by COUNTER are precisely defined in a definition table, and these definitions are very similar to those used by NISO and ICOLC.16 Certain of the definitions are slightly more loosely defined in COUNTER than in the NISO guidelines; for example, “search” is “a specific intellectual query, typically equated to submitting the
13
COUNTER Code of Practice, The Code of Practice Release 1 December 2002. Dec. 2002. 9 Dec. 2003 <http://www.projectcounter.org/code_practice.html#start>.
14
COUNTER.
15
“COUNTER Register of Vendors.” COUNTER Code of Practice, The Code of Practice Release 1 December 2002. 5 Feb. 2004. 13 Mar. 2004 <http://www.projectcounter.org/articles.html>.
16
“Table 1: Definitions of terms used in the COUNTER Code of Practice.” COUNTER Code of Practice, The Code of Practice Release 1 December 2002. Dec. 2002. 9 Dec. 2003
search form of the online service to the server.”17 This does not indicate the limitations to what may be counted as a search and what may not.
3. How Do Vendor-Generated Statistics Indicate Usage?
There appears to be a consensus within the library community as to what statistics ought to be collected and presented by vendors (even if not all vendors choose to report these statistics as of yet). What do these statistics mean, however? After a library has received a session-count for a particular resource, what does this indicate about the user population’s information-using behaviors? What do all of these measures represent in terms of actual user behavior and decision-making? Several studies have tried to identify trends in user behavior based on analysis of usage statistics.
One such study reminds readers that usage statistics have serious limitations. Statistics do not tell us, for example, “why an article was downloaded,” how many users contributed to the aggregate statistics, and how many people rely on personal
subscriptions of journals for their information rather than electronic versions.18 In addition, because there is no indication of how many individuals are using each IP address, the IP address is not a completely reliable surrogate for individual users. On the other hand, taking statistics by IP address seems to be the closest possible approximation of individual behavior. The conclusions of any statistical analysis per IP address must take these shortcomings into account.
17
“3.1.2.8, Search.” Table 1: Definitions of terms used in the COUNTER Code of Practice. Dec. 2002. 14 Dec. 2003 <http://www.projectcounter.org/code_practice.html#section3>. Cf. International Coalition of Library Consortia. “Number of Queries (Searches).” Guidelines for Statistical Measures of Usage of Web-Based Information Resources (Update: December 2001). Dec. 2001. 14 Dec. 2003
<http://www.library.yale.edu/consortia/2001webstats.htm>.
18
A basic problem is the desired degree of granularity at which to take
measurements. Steve Hiller comments that such measures as “the number of turnaways, items retrieved or requested, and full-text links or views” are “generally secondary use measures” and are usually more difficult to interpret than overall use indicators such as sessions and searches.19 Hiller notes his preference for session-counts over search-counts, because a large number of searches may result from “interface problems or just poor search techniques.” Jennifer Weintraub notes that although a greater degree of granularity is available from vendors, vendors often do not define their terms well enough to allow libraries to take advantage of this potentially more interesting, detailed
knowledge of their users’ interactions with the electronic resources.20
John Sack reports that HighWire Press conducted informal interviews with librarians, article authors, journal editors and publishers to determine what sorts of usage information they would find helpful. Sack reports that there were several main areas of interest. The people interviewed indicated an interest in knowing which articles were read most often per month. They wanted to know the age of the reading material to assess whether or not the material was being read for current awareness or for research. The interviewees also wanted to know how researchers locate the particular articles they read. In addition, they wanted to know the number of users using particular resources and the number of articles being used in a given resource.21 Some of these pieces of
19
Hiller, Steve. “Evaluating Bibliographic Database Use: Beyond the Numbers,” Against the Grain (Dec. 2003-Jan. 2004) 15.6: 26-30.
20
Weintraub, Jennifer. “Usage Statistics at Yale University Library.” Against the Grain (Dec. 2003-Jan. 2004) 15.6: 32-34.
21
information can be gathered only by tracking very specific measures, even more specific than knowing just the aggregate number of journals and articles viewed, respectively.
Joanna Duy expresses the view that the most important measure may be the “‘number of full-content units examined, downloaded, or otherwise provided to the user’ (ICOLC),” especially for electronic journals.22 Duy also notes that different kinds of users’ activities can be measured in different ways; for example, citation analysis certainly indicates faculty use of a title, but undergraduate and graduate use will not be reflected by citation counts.
Wonsik Shim and other authors write that measures of importance to librarians (and measures that are currently able to be analyzed using ready-made spreadsheets in the Arizona State University tracking database) include cost per search, cost per session, searches per session, and full-content units viewed or downloaded per session or search.23 By knowing the number of searches conducted within a database over a certain amount of time, librarians can infer the relative value that users get from the resource, and by
comparing the login times with the number of searches and number of full-content items downloaded, librarians can draw conclusions about how effectively patrons retrieve the information they seek. This article also mentions that statistical reports can not only help indicate user behavior but also serve as possible performance measures for electronic resources: for example, if there are consistently long session times compared with
22
Duy, Joanna. “Usage Data: Issues and Challenges for Electronic Resource Collection Management.” E-serials Collection Management: Transitions, Trends, and Technicalities, ed. David C. Fowler (New York: Haworth Press, 2004) 124.
23
relatively small numbers of full-content items retrieved, this may indicate that the resource interface is difficult to navigate.
Although these measures are undoubtedly valuable, Shim and his colleagues warn readers that there are potential shortfalls in these statistical reports. For example, it is impossible to gauge the quality of a session without interviewing the patron who engaged in the search behavior; it is only possible to gather numbers. On the whole, however, the article suggests that knowing these patterns is very advantageous for libraries.
The SuperJournal project has indicated in great detail the advantages of
examining usage data together with contextual information regarding user behavior. This study has established some general patterns of behavior exhibited by users of electronic journals.24 A SuperJournal application, distributed to thirteen participating research institutions, offered electronic versions of forty-nine well-respected journals in both the sciences and the humanities. Individual users had to register in order to use the service, and the authors of the study were able to collect information from transaction logs for the SuperJournal publications as well as information from user surveys. They identified certain criteria that users would apply to the resources (e.g., were the contents relevant, and was access to the resource good?), which would determine whether or not the user would become a repeat-user of the resources.25 The SuperJournal project analyzed such detailed data per individual user as the number of sessions conducted per month, the number of journals used at the issue level or article level, and proportion of sessions reaching article level over the total number of sessions. Because the data was so detailed, the authors were able to define certain kinds of repeat-users and non-repeat users.
24
Eason, Ken, Sue Richardson, and Liangzhi Yu, “Patterns of Use of Electronic Journals,” Journal of Documentation (2000) 56.5: 477-504.
25
The four groups of repeat-users were designated “enthusiastic users,” “focused, regular users,” “specialized, occasional users,” and “restricted users.”26 These users were located on a continuum of use as represented by the number of overall sessions, the number of different journals they accessed, and the percentage of sessions with full-content items viewed versus the total number of sessions. The “enthusiastic viewers” were the most frequent users and the users who used the resources in most depth.27 The authors of the study also took into account the users’ motivations for their searches; for example, the “focused, regular users” looked frequently at a small number of journals, presumably for “current awareness” in addition to their other motivation of looking at articles about which the users previously had information.
Similarly, the non-repeat users were arranged also by the number of sessions, number of journals accessed, and percentage of sessions that yielded full-content
viewing. The non-repeat users ranged from the “lost users,” who initially appeared to be enthusiastic users but whose use dropped off dramatically after a time, to the “tourists,” who viewed SuperJournal only once and did not return. An interesting category was the category of the “searchers,” who only used the search function rather than conducting any browsing activity.
The conclusions reached by this user study indicate that knowing the context of the searches based on interviews is critical to being able to understand user behavior. All statistics should be analyzed in the context of a study of the user population and this population’s particular needs. The SuperJournal study indicates that there appear to be overall usage patterns followed by different types of users. Libraries may not be able to
26
Eason, Richardson, and Yu 492.
27
obtain specific information about their users under normal circumstances, however, because they do not have the means or time to conduct user interviews.
4. How Should Libraries Gather and Interpret the Data?
Once there are guidelines as to what statistics vendors should provide and
different options for ways to interpret the statistics, libraries can establish guidelines as to how to use the statistics they receive. At this point, however, there is still a lot of room for standardizing specific methods of e-resource usage analysis. Although libraries have been analyzing print serial usage for many years, librarians feel that comparing print usage and e-resource usage may not be possible. One author notes that vendor-reported statistics may contain inaccuracies such as the counting of double-clicks on an article as two requests for that article.28 There are inaccuracies in counting print usage as well, but these may tend toward under-counting rather than over-counting; for example, patrons may shelve journals after use rather than leave them out for libraries to count. Patrons may also use more than one article from one journal, which is impossible to track exactly.
It may be possible to evaluate print and electronic resource usage with indexes rather than “raw measures.” Kathleen Bauer writes that separate indexes for print and for electronic resources may be good metrics because they provide an abstract number, potentially adjusted for variation in the number of new items acquired in a given year, to compare to the same measure in other years.29 Bauer studied a library that constructs its electronic index to determine the percent of increase of full-text downloads. It seems that the construction of the index could be flexible enough to weight different measures of
28
Davis, Philip M, “Patterns In Electronic Journal Usage: Challenging the Composition of Geographic Consortia,” College & Research Libraries (2002) 63.6: 484-497.
29
usage differently and gather them into one measure. The particular weighting could vary depending on the decisions of the libraries creating the index.
Another approach for evaluating e-resources is that of deriving the cost per amount of content delivered and the cost per use. Karla Hahn and Lila Faulkner describe three metrics for evaluating electronic resources. The first metric is the average cost per access to an electronic journal, which divides the subscription price by the number of articles accessed. The second metric is the average cost per article, or the subscription price over the number of articles offered online. The third metric is the “content-adjusted usage,” which divides the total number of articles offered by the total number of HTML articles viewed added to the total number of PDFs downloaded.30 These measures and the benchmarks derived from them are sophisticated indicators of relative value, as they take into account the cost of the resources and the total amount of material available.
In addition to the definitions of measures included in the NISO Z39.7 200X draft standard, NISO has included some guidelines for collecting these statistics in Appendix A. The appendix suggests that libraries count the number of sessions, searches, menu selections, number of units / records examined, and turnaways, among other measures, for locations in the library as well as on other parts of the institution and outside of the campus.31 It recommends that these measures be collected per service (presumably per title of the resource) as well as in aggregate. It is possible to collect these numbers over any period of time desired by the library. The amount of time over which the library
30
Hahn, Karla and Lila Faulkner, “Evaluative Usage-based Metrics for the Selection of E-journals,” College & Research Libraries (2002) 63.3: 215-227.
31
should collect these statistics is not stipulated; libraries could do monthly or annual counts.
The Association of Research Libraries (ARL) E-Metrics project also attempts to prescribe methods of statistical data collection for ARL member libraries. This project is a large-scale, multi-phase project that began in 2000. The first phase of the project was designed to survey ARL libraries on their current practices of measuring and analyzing statistics for electronic resources (“networked resources and services”).32 The second phase of the project was designed to do “field testing” of certain measures, using
participating ARL member libraries as participants to collect and analyze these measures. The third phase is one of disseminating the ARL’s findings to ARL libraries and
instruction as to how to collect and analyze the relevant statistics.
The ARL E-Metrics Phase II Report summarizes the findings of the second phase of the project. The section on counting and analyzing the number of logins (sessions) to e-databases instructs librarians to specify the causes for increased or decreased numbers of logins from one date’s count to the next.33 The Phase II Report provides libraries with a much more direct set of instructions than any of the other proposed methods of analysis I have presented thus far. Although the Phase II Reportis so detailed, there are further documents associated with Phase III that also prescribe methods of collecting statistics. In one of these Phase III documents, the authors recommend the collection of the number of electronic full-text journals, number of electronic reference sources, number of logins (sessions), number of searches, and number of items requested (which appears to be the
32
Blixrud, Julia C., “Measures for Electronic Use: The ARL E-Metrics Project,” Statistics in Practice – Measuring and Managing, IFLA Satellite Conference, 13-25 August 2002, Loughborough, UK. 2002. 14 Dec. 2003 <http://www.arl.org/stats/newmeas/emetrics/papers.html>.
33
same as NISO “full-content units”).34 In addition, the ARL document recommends the collection of aggregate cost figures: the cost of electronic full-text journals and the cost of electronic reference materials. These figures all have specific periods of time over which they will be collected, and each section lists procedures for the collection of these
statistics.
The ARL has composed and distributed training modules, but as of yet, the ARL’s recommendations are not yet followed consistently across ARL libraries. All of the ARL documents are excellent resources for libraries with the willingness and the resources to change their workflows sufficiently to collect these statistics, but it may be the case that not all ARL libraries are in a position to make such changes.
B. Citation Analysis
1. What Do the Measures Mean?
Another option of measuring usage for electronic journals is journal citation analysis. Although there is a long-standing debate about the usefulness of citation analysis, it seems that many librarians consider it a good method of evaluation.35 It must be noted that citation analysis only indicates a high level of usage, the level at which a user actually refers directly to a text.
The Institute of Scientific Information (ISI) Journal Citation Reports has measures to evaluate scientific, technical, and medical (STM) journals that include the total citation count for the journal and the amount that a journal is cited in a given year. The journal
34
Shim, Wonsik “Jeff” et al. Data Collection Manual for Academic and Research Library Network Statistics and Performance Measures. Washington, DC: Association of Research Libraries, 2001. 14 Mar. 2004 <http://www.arl.org/stats/newmeas/emetrics/phase3/ARL_Emetrics_Data_Collection_Manual.pdf>.
35
impact factor is described as “a measure of the frequency with which the ‘average article’ in a journal has been cited in a particular year.”36 The impact factor is the resultant number when the number of current citations to articles published in the two previous years is divided by the total number of articles published in that span of time. The last ISI measurement relevant to this study is the “cited half-life,” or the “number of
publication years from the current year which account for 50 per cent of current citations received.”37 This number indicates whether most citations of the article tend to happen within a short time of publication.
2. How Should Libraries Analyze the Data?
An example of a local citation analysis project is the one conducted by Janice Kreider at the University of British Columbia. Kreider wanted to discover which publications were being cited by faculty and to examine the relationship between local citation patterns and overall citation patterns. ISI created a report for the University of British Columbia to indicate the local numbers of citations to particular journal titles. Kreider’s major finding is that there is a strong correlation between local citation data and overall citation data. Kreider cautions, however, that a low number of overall citations to a particular journal does not always indicate a low number of local citations.38 Librarians should therefore be sure to examine the local patterns when considering journals with low overall numbers of citations.
36
“Journal Impact Factor.” ISI Journal Citation Reports Online Help, JCR Glossary. Jan. 18, 2001. 14 March 2004 <http://isi10.isiknowledge.com/portal.cgi/jcr/>.
37
“Cited Half-Life.” ISI Journal Citation Reports Online Help, JCR Glossary. Jan. 18, 2001. 14 March 2004 <http://isi10.isiknowledge.com/portal.cgi/jcr/>.
38
Although citation analysis has the distinct limitation of not measuring
undergraduate usage, it is valuable for determining some degree of faculty usage. In addition to vendor-generated usage statistics, citation analysis can aid in establishing e-resource value.
C. The Approaches of Electronic Resource Management Systems
Because librarians have different methods of collecting and analyzing statistics, it would be valuable to see whether any sort of standardization has occurred in the arena of e-resource management software. Timothy Jewell has been conducting research
concerning all aspects of electronic resource management, from acquisition and licensing to continuing evaluation of resources once they have been purchased. Jewell surveyed several institutions that have individually undertaken projects to manage their electronic resources.39 Examples of these institutions are MIT, Penn State, University of Virginia, Yale, Arizona State University, and Cornell, among others.
Although Jewell notes that libraries have difficulty analyzing vendor-provided statistics due to the inconsistency of vendor-generated statistics, there are some
institutions that have been analyzing their vendor-generated statistics.40 An example is Arizona State University’s local database, which includes information for librarians about how to acquire the statistics from vendors. This system also has programmed
spreadsheets that can compute ratios of different measures (e.g., cost per search).41 In addition to home-grown solutions for managing e-resources, there are also at least three commercially available e-resource management systems. Innovative
39
Jewell, Timothy. Selection and Presentation of Commercially Available Electronic Resources: Issues and Practices. (Washington, D.C.: Digital Library Federation, Council on Library and Information Resources, 2001) 2-3.
40
For comments on inconsistency of statistics, see Jewell 23.
41
Interfaces’ Millennium Integrated Library System has an Electronic Resources
Management module, but the product documentation available on the web describes only general functionality including holdings data, access methods, and contracts and
licenses.42 The Colorado Alliance of Research Libraries offers a suite of products under the name Gold Rush, and the Gold Rush “Staff Toolbox” module shows basic
information about e-resource statistics, such as where on the web they are located, but it also does not import any specific measures from vendor reports.43
EBSCO is the only product of the three, however, that appears to use some kind of standardized arrangement of statistics. EBSCO’s A-to-Z E-resource Access & Management allows administrators to see “overall usage (sessions, searches, link-outs) and usage of each journal (link-outs by target)” which can be put into reports.44 Whether this data is library-collected or vendor-collected, there is some report-making capability in this software. There is not, however, widespread standardization within the
E-Resource Management modules as to the functions selectors would like to perform on usage statistics.
Although many people have defined the statistics with which to evaluate electronic resources and offered different methods of interpreting these statistics, it is clear that there is a lack of standardized collection and interpretation of these statistics. The goal of this study is to continue conversations about what statistics are most useful for indicating electronic resource usage and how these statistics should be analyzed.
42
Innovative Interfaces. Electronic Resource Management. 9 Dec. 2003. <http://www.iii.com/pdf/lit/eng_erm.pdf>.
43
The Colorado Alliance. Gold Rush Staff Toolbox. 2001-2002. 9 Dec. 2003. <http://grweb.coalliance.org/samples/samplesubsrec.html>.
44
D. The Selection Process at UNC-Chapel Hill
The library system at UNC-Chapel Hill is divided into three main areas, one of which is the Academic Affairs Library, which comprises Walter Royal Davis Library (the Graduate Library), Robert B. House Undergraduate Library (which includes the Media Resources Center), all of the collections in the Louis Round Wilson Library (including Manuscripts and Maps), and a number of departmental branch libraries. The other two main areas of the UNC-Chapel Hill system are the Health Sciences Library and the Law Library. Each of the three areas has its own administration and funds for acquiring serials. Within the Academic Affairs Library, branch libraries may benefit from centrally funded serials as well as being responsible for acquiring licenses for resources that target their specific user populations. Within the Academic Affairs Library, a cross-disciplinary group of selectors called the Electronic Resources Selection Committee (ERSC) is
responsible for selecting centrally funded resources. For centrally funded resources, these librarians make the final decisions as to what to cancel. For departmentally funded resources, the academic departments (and thus the faculty) affiliated with the branch libraries have a say in determining which resources to cancel.
Christie Degener and Marjorie Waite, of the UNC Health Sciences Library, write that there are many different models for the manner in which an institution acquires access to electronic resources.45 For example, a library may have free access to an electronic version of a resource with a subscription to the print version. Some other options are paid access to electronic with subscription to print, electronic subscriptions only, and consortial (partial) payment for electronic access. This means that the decision
1
to cancel a resource is potentially more complicated than simply deciding to cancel the electronic aspect of the resource. Sometimes the process includes deciding whether or not to cancel the print, as well.
Julianna Harris’s Masters Paper, completed after a major UNC serials
cancellation project in 2002, presents the sort of serials evaluation process that occurs at present at UNC’s Academic Affairs Library.46 Harris assessed the serials evaluation processes of several different UNC selectors. She found that during the cancellation, UNC selectors used patron usage statistics, especially those gathered over a long period of time, and citation analysis to evaluate resources. They also relied greatly on
conversations with faculty members in their particular field. The fact that Harris found that selectors use usage statistics suggests that selectors have a process for evaluating electronic resources, but this process may vary from selector to selector, as Harris found with respect to the selectors’ overall processes of serial evaluation. This finding led the author of this study to conduct interviews with selectors from the Academic Affairs Library, Health Sciences Library, and Law Library in order to determine whether there are different patterns of statistical usage among UNC selectors.
46
III. Methodology
In preparation for this study, the author consulted relevant literature in order to find questions that would reveal selectors’ opinions about the validity of different
statistical measures. The author then designed interview questions based on the findings from this literature review. Members of the Academic Affairs Library Acquisitions staff offered valuable advice as to the question composition. With the aid of the head of the Academic Affairs Library (AAL) Acquisitions Department, the author identified potential participants throughout the UNC Library System, including the Health Sciences and Law Libraries. Some of these selectors were recommended by the head of AAL Acquisitions, and some selectors were chosen by the author from a directory list of selectors composed by the University Libraries. The author made an effort to include participants who select scientific, technical, and medical (STM) publications as well as participants who do not. In total, twenty selectors were contacted by letter, the text of which can be found in Appendix A. Of those twenty, four did not agree to participate, six did not respond, and ten agreed to participate. The responses of these ten are analyzed in this paper.
each interview was tape-recorded. Each interview required different questions on the same themes, as different selectors had different experiences and points of view; not every question was relevant to the experiences of every selector.
The interviews were broken into two main segments, the first of which consisted of questions about the selector’s current process of e-resource evaluation. The selectors were first told that the purpose of the study was to establish how selectors currently use statistical measures and how they would like to use the measures if they were more standardized. Then each selector was asked whether he or she had ever participated in a project that involved the cancellation of an electronic resource. Following this question, the selector was asked to describe his or her use of library-generated and
vendor-generated statistics when evaluating electronic indexes, databases, and journals. The author also attempted to discover whether selectors used spreadsheet or database software in order to aid their decisions. If a selector had never had to cancel resources, the selector was asked to speculate as to the potential usefulness of library-generated and vendor-generated statistics. The goal of this section was to gain narrative information about current statistical evaluation practices or, in the case of no actual selections, general attitudes toward usage statistics.
four kinds of measures: session count, number of searches run and other more specific indicators such as full-content items examined or downloaded, both session count and search count or other specific indicators, and number of turnaways. The definitions for these terms, taken from the COUNTER 2002 Code of Practice, and the ICOLC 2001 revision, were provided to the participants on the interview design (as illustrated in Appendix B). The selectors were also asked to explain why they chose as they did.
The next question, which asks about ideal measures for electronic journals, required an additional assumption of some of the selectors. If participants selected non-STM resources, they were asked to assume that they would have access to the Institute for Scientific Information (ISI) Journal Citation Reports database for the Social Sciences, which would be analogous to the ISI Journal Citation Reports Science Edition. (UNC libraries currently subscribe only to the Science Edition.) This section of the interview asked which strategies selectors would prefer to evaluate journals: journal citation analysis, analysis of vendor-generated statistics, or a combination of the previous two strategies. Again, the participants were asked to explain their preferences.
The next question asked whether any other measures or statistics for evaluating e-resources had been omitted from the interview questions.
The last question asked the selectors to discuss the context in which they evaluate electronic resources. The purpose of this last question was to determine the relative importance of statistical analysis in deciding which e-resources to cancel.
binary variable was represented, the spreadsheet was populated with either Y for “yes” or N for “no.” Columns were added to the spreadsheet for the accompanying rationales and narrative information that participants provided about given measures. Where selectors were asked to rank several measures in comparison with one another, a column in the Excel file corresponds to the name of the measure and each selector’s individual rankings corresponds to each measure.
The complexity of the interview data in the ranking questions derived from the author’s desire not to impose too many constraints on the participants’ narratives and judgments of different measures. Instead of using consistent numerical scales for each set of preferences, selectors tended to choose different methods of ranking certain measures over others. Selectors would often give verbal descriptions rather than use the 1-4 or 1-3 ranking scheme set forth in the questions. In addition, certain selectors did not respond to certain questions, because they had not been in a position to form opinions about the questions asked. As a result, different questions about ranking also draw from different-sized pools of selectors. In many cases, selectors chose to rank two measures equally or not to assign a given rank to any measure.
These factors contributed to the author’s decision to impose a standardized vocabulary on the results of the ranking questions. Where selectors did not participate, the value of “n/a” was plugged into the Excel spreadsheet. Where selectors did
assign scalar values (e.g., in describing different methods of citation analysis), only the values of most indicative, least indicative (in some cases), and relative value can be described with any confidence.
The author planned to compile any trends that emerged in participants’ responses across the two main sections of questions. The goal was to be able to count numbers of the selectors who responded in any given way and to compare this number with the total number of selectors interviewed or the total number of selectors who responded to a particular question. Then, the interviewees’ narrative information could explain the apparent trends. In this way, the author intended to provide reasons for any patterns in selector preferences.
An expected pattern was that the majority of selectors would prefer to use a combination of both less specific and more specific measures in evaluating electronic resources of all kinds. Another hypothesis was that a minority of selectors would prefer to use only the less specific measures, because of either lack of time or lack of ability to compare the more specific measures with any library-generated measure. A final hypothesis was that selectors would choose to use both citation analysis and vendor-generated statistics in evaluating electronic journals.
IV. Analysis of Results
This chapter will begin with some basic information about the selectors
themselves. A compilation of how selectors currently choose to analyze their usage data will follow. This information is informed by a more detailed description of the
environment in which they make their decisions and the relative importance of usage statistics. The section will then report the answers to the target questions of the study: it will identify selectors’ preferred ideal measures for EIDs, followed by their preferred ideal measures of EJs, looking first at vendor-generated statistics and then at citation analysis. The section will conclude by exploring any additional criteria that selectors evaluate during a cancellation.
A. Demographics of the Selector Population
Of ten selectors interviewed, two selected STM e-resources in addition to non-STM e-resources, and four selected non-STM titles exclusively, making a total of six selectors who had selected STM e-resources. The remaining four did not select STM publications. Six of the ten did not report any connection with either the Electronic Resource Selection Committee (ERSC) or any other committee involved in evaluating or selecting
e-resources. Two of the selectors did report having worked with a committee, although they were not members of the ERSC. Finally, two of the selectors were members of the ERSC.
of the seven served as a reference for other selectors who actually made cancellation decisions, and the other six selectors actually were responsible for making decisions. Of the three selectors who had not cancelled resources, one reported that this selector’s department had been informed that it would have to cut a certain portion of its budget, but funding had been found to sponsor the resources targeted for cancellation. The two others reported that they had cancelled CD-ROM versions of titles in favor of web-access versions.
B. How Selectors Currently Gather and Analyze Usage Statistics
Of the seven selectors whose departments have participated in cancellation projects, four reported that either they or their departments examined library-generated session statistics of varying kinds using Excel spreadsheets (see Table 1). Of the three selectors who did not report the use of spreadsheets to examine the library-generated statistics, one could not remember whether the host department had used spreadsheets, and one reported that some members of the host department did use them while other members did not. The third selector’s library gathered different statistics and analyzed them using log analysis desktop software. Of the three selectors who had not participated in a cancellation project, two indicated that in the context of a future cancellation project, they would look at library-generated session statistics in order to make their decision.
Table 1. Use of library-generated statistics
Number of
selectors*
Use library-generated statistics 4
Systematically use Excel to analyze above statistics 4
Although there was such a high level of acceptance of the library-generated session statistics, eight of the ten total selectors expressed at least one concern with the data available from the session statistics. Two kinds of concerns were expressed: the first group of concerns related to the web interface from which the selectors can download the session data. One selector commented that it is impossible to determine which
department is economically responsible for each title, as the titles are merely presented in an alphabetical list. Another selector noted that there is no way to group the titles by publisher, and it is more difficult than it could be to pick out an individual title.
The second kind of concern pertained to the interpretation of the number of sessions counted by the library’s server log. Five selectors indicated that the session count tends to undercount users, because if users bookmark the homepage of the
resource, then they do not enter through the library’s gateway page, and thus they are not counted by the library’s server log. This concern echoes Duy and Vaughan’s statement that the gateway page entry count is a “gross undercount of users.”47
Two selectors mentioned that there is no way to gain information about the information-seeking behaviors that users display once they are inside the resource, because the library’s server log cannot collect information from the vendor’s web-pages. One selector was unsure as to how sessions were defined by the library; on the actual intranet site, there is no documentation defining the count or describing how the count was taken.
Of the seven selectors whose departments conducted cancellation projects, six selectors reported that their departments used vendor-generated statistics to aid in the decision-making process (see Table 2). The other selector was not aware whether the
47
department had used vendor-generated statistics. Four of the selectors who did use vendor-generated statistics reported the use of Excel to organize and analyze the data. One selector indicated that co-selectors may have used different groups of
vendor-generated statistics; in other words, there was no standardized process. The other selector of the six represented the department that gathered its own server log files and analyzed them using desktop programs.
Table 2. Use of vendor-generated statistics
Number of
selectors*
Use vendor-generated statistics 6
Systematically use Excel to analyze above statistics 4
*Number of selectors who participated in cancellations: 7
Seven out of ten selectors commented on the difficulties of using
vendor-generated statistics. The most frequent comments were that it is difficult to interpret the statistics because different vendors define the measures differently, or because the vendors have not defined the measures clearly. An interviewee commented that the session count may not reflect useful information because if a person fails to log out correctly, the session may still be counted as active for a long period of time even if the user is not actually using the resource. One participant mentioned an access problem: the many vendor-generated statistics that are password-protected are mostly unavailable to selectors, because the passwords are not widely distributed to selectors. Another problem directly related to the selectors themselves is that not all selectors choose to examine the same measures, so it may be difficult for selectors to communicate and compare
The participants had interesting feedback concerning the use of Excel to compare titles. Two selectors provided a very detailed account of how they use spreadsheets to help them analyze titles. One interviewee compiles a “total uses” number per journal title per year by adding sessions to a locally-calculated estimate of print journal usage. The session count is determined by comparing the library-generated with the
vendor-generated session count and by using whichever figure is higher. After this session count is added to the print usage number and the overall cost of the title is entered into the spreadsheet, the cost per use can be calculated. The title’s impact factor is also entered into the spreadsheet.
The other selector who shared information about the Excel spreadsheet also reported using both library-generated and vendor-generated session counts for analyzing titles. Where possible, the selector uses the library-generated count, but if it seems that this count is low, the selector incorporates the vendor-generated sessions. This
spreadsheet is populated with the title, holdings, electronic use as previously defined for the current year to date and the previous year, and average electronic use per year. It also includes the average number of uses of the total of both print and electronic, and the cost per use, among other categories. This analysis includes not only cost per use information, but also an indication of the amount of content in the title: number of pages in the
previous year, price per page in the previous year, and number of physical issues in the previous year.
full-text, dates of full-text coverage, and the aggregated resources in which a certain title is present.
C. Context of the Cancellation Decision
One of the goals of this study was to determine the degree of importance that usage statistics hold in the cancellation decision. In order to achieve this goal, the author asked selectors about the context of their decisions and the relative importance of usage statistics in making their judgments. The environment in which the selectors license electronic resources is a complex combination of matching funding availability with collection development and maintenance decisions. Selectors must take into account many factors when they decide whether or not to cancel a particular title. Some of these factors are characteristics of the titles themselves, some are features of the users of the resources, and some come from the environment of the library. (For a summary of these factors, see Table 3.)
The content of the resource is an extremely important criterion in the selection of the electronic resource, and it is equally important in any cancellation project. Three selectors explained that when a title is critical to the discipline, the library does not consider canceling it, even if its usage figures are low, because the resource is crucial to the practice of the particular discipline. Rather than cancel the resource, it is necessary in these cases to educate users so that they use the resource.
although this situation will most likely not always be the case. One participant’s
department is receiving fewer print subscriptions and relying more heavily on electronic access, so cancellation of electronic resources is beginning to have extra weight.
The users of the resources, themselves, are no less important to the cancellation decision than factors about the contents and format of the resource. Some selectors are primarily interested in the use of resources by undergraduates, while others are more interested in a combination of faculty and undergraduate use. Knowledge of the targeted users’ activities also informs selectors; for example, the number of sessions and searches are ways to evaluate student usage, but citation analysis is not, because students are not published. In addition, a selector commented that there is not a lot of browsing activity in the library in question, because users primarily seek particular, known articles.
On some occasions, users have input into the decisions: faculty members exercise different amounts of influence on the decisions. Faculty may not be consulted at all, if the resources involved are centrally funded. On the other hand, some departments present their proposed cancellation lists to faculty, who evaluate these lists.
The collaborative environment of the centrally funded committee was a topic that emerged in multiple interviews. In this sort of environment, selectors have to take into account the needs of other departments as well as their own, as the funds are centrally provided. One interviewee commented that someone in an individual department may analyze data at a different level than someone working in a committee environment.
Table 3. Summary of contextual influences
• Resource content
• Existence / nonexistence of print counterparts
• Knowledge of users
• Faculty involvement
D. The Relative Importance of the Usage Statistics
Because of the variety of factors influencing de-selection of electronic resources, the usage statistics may not be viewed as the best indication of whether or not a resource should remain the library’s collection. When the participants were asked about the relative importance of usage statistics, unsurprisingly, they gave a variety of responses. Two selectors felt that the content of the resource is paramount, and librarians have a prescriptive responsibility in keeping theses resources for their users. Some participants consider all factors at the same time and do not privilege statistics. Others suggested that usage measures are just one factor to be used in a multi-step approach to cancellation. In this situation, examination of statistics is only the first step in a longer process to
determine a group of resources that need to be investigated further. One selector
remarked that usage statistics are becoming increasingly important, although not the only important factor. Finally, one selector indicated that the usage statistics are the most important factor. In short, selectors have very different views as to the relative importance of usage information.
E. Selectors’ Preferred Measures for Electronic Indexes and Databases
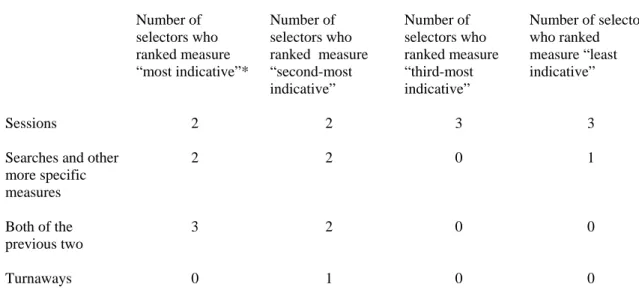
Of all ten selectors, only seven gave a ranking to the vendor-generated measures of sessions, searches and more sophisticated measures, or a combination of sessions and more sophisticated measures. Of the three selectors who did not participate, one did not wish to comment because of lack of experience with the measures in question, one said that the content of the resource was the only important factor, and the last said that the criterion to be used depended on the kind of resource being examined. For example, a search count might be appropriate for a bibliographic database, while a session count might be more appropriate for a textual tool such as Literature Online. Of the seven who ranked measures, two responded that sessions are most indicative of electronic index and database value, and two thought that searches and other more specific measures such as number of full-content units examined or downloaded are most indicative (see Table 4). Three selectors said that both together are most indicative, and none of the participants thought that turnaways are most indicative of EID value.
and other, more specific measures because of lack of time to analyze these specific measures.
Table 4. Preferred measures for EIDs
Number of
selectors who ranked measure “most indicative”*
Number of selectors who ranked measure “second-most indicative” Number of selectors who ranked measure “third-most indicative”
Number of selectors who ranked
measure “least indicative”
Sessions 2 2 3 3
Searches and other more specific measures
2 2 0 1
Both of the previous two
3 2 0 0
Turnaways 0 1 0 0
*Number of selectors who ranked choices: 7; see text for further notes on interpretation
When looking at the overall trends of selectors’ responses, one apparent pattern in the numbers seems to be that the largest number of people (by a very small margin of one!) thought that looking at both less specific and more specific measures was the best strategy, and not one of the seven who ranked the measures wished to designate looking at both of the measures together as the least indicative of their value. Because there was not an overwhelming majority, however, it seems that there is room for a variety of opinions as to the usefulness of different measures.
what measure to consult may not always be driven by what will provide the most detailed information. Another interviewee who commented on the primacy of the session count explained that the user’s initial judgment of the resource’s relevance was the most important sign of use. This opinion implies that the session count is the most important measure because it counts the activity (log-in) that is a prerequisite for any further activity within the site, regardless of what constitutes that further activity.
By way of contrast, two selectors indicated that the gross overall measures such as session count may not be a good indicator of usage, because they may reflect mistaken clicks either to enter the resource or while within it. One participant felt that search counts were equally subject to mistaken clicks, and indicated that full-content units examined and downloaded are much less likely to result from unintentional clicks. Another view is that all of the activities recorded while users are inside the resource, including searches, full-content units examined and downloaded, are of the most value. According to this view, because the session is not as reliable, considering session counts in conjunction with the more specific measures somewhat “dilutes” the value of these more specific measures.
different model of article discovery and usage than the pattern reported by Davis and Solla, in which users of American Chemical Society publications used the e-resource as a “networked photocopier.”48 Selectors are taking into account the fact that different users may privilege certain kinds of access over others.
As these different opinions show, there is not an overwhelming consensus as to which measures most accurately represent the “highest level” or even perhaps an
adequate level of use of an electronic resource. This lack of consensus arises again in the responses to questions specifically targeted at the measures used to evaluate electronic journals.
F. Preferred Vendor-Generated Measures for Electronic Journals
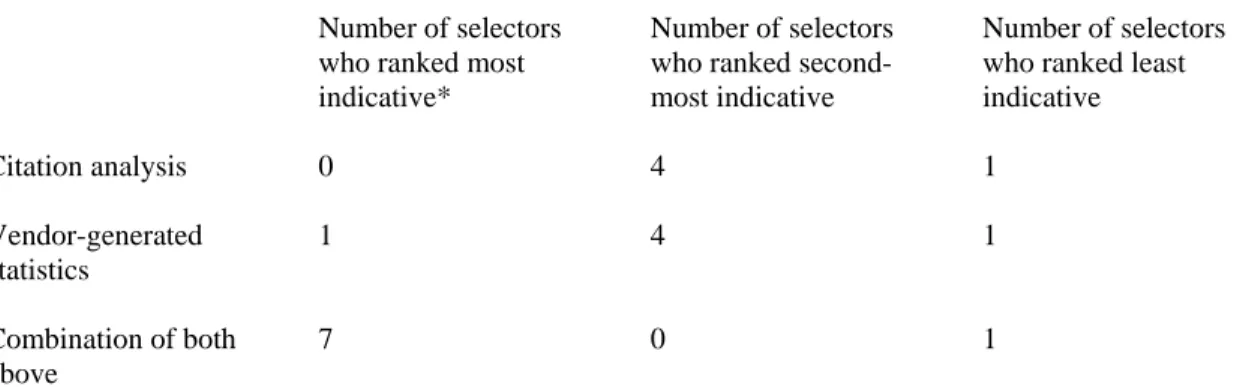
Of the ten selectors, seven selectors assessed the relative value of different vendor-generated measures. Two interviewees did not discuss these measures, because they had not used these measures before and so did not feel in a position to comment on their relative usefulness. The other selector who did not participate did not do so because content was so important that this selector would not examine any other criteria.
As in the patterns of preferences for vendor-generated statistics in evaluating electronic indexes and databases, none of the measures emerged as clearly of most value (see Table 5). Two selectors chose the number of sessions as most indicative of EJ value, two chose the number of searches, three chose the number of full-content units examined, by type of page, and two chose the number of full-content units downloaded, by type of file. One participant assigned “most indicative” equally to session and search, and another interviewee reported that both full-content units examined and downloaded are equally important. Again, as with electronic indexes and databases, most of the selectors
48