Practical Detection of Click Spams Using
Efficient Classification-Based Algorithms
Mahdieh Fallah
Department. of Computer Engineering Yazd University
Yazd, Iran [email protected]
Sajjad Zarifzadeh*
Department of Computer Engineering Yazd University
Yazd, Iran [email protected] Received: 15 December, 2017 - Accepted: 18 March, 2018
Abstract — Most of today’s Internet services utilize user feedback (e.g. clicks) to improve the quality of their services. For example, search engines use click information as a key factor in document ranking. As a result, some websites cheat to get a higher rank by fraudulently absorbing clicks to their pages. This phenomenon, known as “Click Spam”, is initiated by programs called “Click Bot”. The problem of distinguishing bot-generated traffic from the user traffic is critical for the viability of Internet services, like search engines. In this paper, we propose a novel classification-based system to effectively identify fraudulent clicks in a practical manner. We first model user sessions with three different levels of features, i.e. session-based, user-based and IP-based features. Then, we classify sessions with two different methods: a one-class and a two-class classification that both work based on the well-known K-Nearest Neighbor algorithm. Finally, we analyze our methods with the real log of a Persian search engine. Experimental results show that the proposed algorithms can detect fraudulent clicks with a precision of up to 96% which outperform the previous works by more than 5%.
Keywords-bot; click spam; user session modeling; classification;
I. INTRODUCTION
Over the last decade, search engines have provided free, easy and quick access to the vast amount of information available in the Internet. Whenever a query is submitted to a search engine, many relevant web pages are retrieved and returned back to the user. The search engines rank results based on many factors including link structure [1], textual features [2] and so on. Today, search engines incorporate user feedback (e.g. clicks) as an important factor in document ranking in order to return better results [3, 4, 5]. Since most of users only pay attention to the top results [6], malicious web sites abuse and manipulate the search result page by forging user clicks in order to raise their input traffic
* Corresponding Author
[7, 8] and rank to top positions. Attackers can generate fake clicks by hiring people or using bots. Bots are automated software programs issuing too many queries or producing excessive clicks. Because these clicks are not performed by real users, this phenomenon is called “Click Spam”. Hence, the problem of distinguishing spam traffic from the real user traffic is critical for the performance and economy of search engines. Specifically, this kind of traffic could harm search engines by increasing the response time of real users, consuming search engine bandwidth, changing search result ranking and negatively influencing other decisions (like query auto-completion or query recommendation) that are made based on user histories [9].
Volume 10- Number 2 – Spring 2018 (63 -71)
On the other hand, the main source of search engine’s revenue is from the online advertising. The online advertising annual revenue was reported $72.5 billion in 2016 which has increased by 21.8%, compared to 2015 [10]. In this regard, search engines are seen as ad networks which usually display ads in two different ways: 1) showing ads or sponsored results that are relevant to the user query beside the search results (like the Google AdWords [11] model) and 2) displaying ads in related web sites or publishers (like the Google AdSense [12] model). Advertisers are charged based on the number of clicks on their ads which is according to the famous Pay-Per-Click (PPC) model [13]. In the latter case where search engines display ads in website of relevant publishers, they give a portion of the click revenue to the publisher that the click is done through it. This kind of click spam may be issued by publishers or advertisers. An unethical publisher is motivated to make more money and an advertiser is induced to deplete its competitors budget. Ad networks should detect such clicks because they may lose their credit and reputation among advertisers, if this problem is not unraveled properly.
Based on the above discussion, there are two different kinds of click spam in search engines: 1) click spam on organic search results with the goal of raising website ranking in the search engine result page and 2) click spam on sponsored results to exhaust advertisers’ budget. The latter is also referred to as “Click Fraud”, since it is directly linked to the flow of money. Regardless of the click spam type, search engines should effectively detect and distinguish them from the normal traffic. However, the focus of this paper is on the first type of click spam.
In the early years, spammers usually used a fixed number of IP addresses for generating their abnormal traffic, therefore it was easy to detect and confront them through IP blacklists. But, they gradually improved their skills such that most of today attacks are automated and distributed by using networks of bots and malwares [14, 15, 16]. Thus, identifying them has been a very hard and complicated task. For example, the authors in [15] reported a DNS changer malware that could affect 4 million users and made its owners $14 million by click fraud over a period of four years. As a result, many researchers have concentrated in recent years on the problem of identifying bot-generated traffic in search engines and other similar web services.
In this paper, we propose a novel classification-based method to detect invalid clicks. Our proposed method consists of the following three steps: 1) Modeling user sessions, 2) Classifying user sessions as either normal or abnormal, 3) Updating the training dataset to enhance the classification accuracy. One main contribution of this work is that unlike the previous algorithms, we consider all major aspects of user behaviors through extracting three levels of features (session, user and IP) to precisely characterize bots and humans. More importantly, our system is designed to work in an online environment through combating the processing and storage overhead of running classification algorithms. Finally, the results of our experiments confirm the superiority of the proposed method by more than 5% (with respect to the precision
parameter) in comparison with a couple of recent algorithms.
The rest of the paper is organized as follows: Section II discusses the related work. In Section III, we first describe the set of features we use to model user sessions and then propose our click spam detection algorithm which works based on a modified version of the K-Nearest Neighbor classification algorithm. Section IV presents the evaluation results and finally, we conclude the paper in Section V.
II. RELATED WORK
In the last decade, there has been an increasing interest in identifying click frauds over the Internet. Juels and Stamm [17] describe the advertising network model and discuss the issue of click fraud in these networks. They provide a complete taxonomy of hit inflation techniques and devise a stream analysis algorithm to detect different fraud attacks. Stone-Gross et al. [18] use search log of a large online ad exchange to investigate a variety of characteristics about invalid user activities, including behaviors related to click fraud. The approach proposed by Dave et al. [19] can find users that have the highest revenue for each publisher and identify fraudulent publishers through comparing the revenue generated by their users and the revenue generated from the users of honest publishers. This method could catch six different classes of click attacks. Oentaryo et al. [20] introduce a system to detect click fraud patterns in online advertisements using different data mining techniques. Kitts et al. [21] describe a data mining system to combat click fraud which is the result of their 5-year experience in Microsoft adCenter. PremiumClicks [22], Bluff ads [23], and bot signatures creation [24] also help to identify authenticated users from automated bots to mitigate click fraud. The above works concentrate on the detection of click fraud and hence, they are not directly related to our work.
There are some works that consider both click fraud and click spam together. Yu et al. [25] present SBotMiner, a system that can automatically identify bot-generated search traffic. They gather a group of users who share at least one identical query and click, and examine the aggregated properties of their search activities. This system can detect distributed low-rate bot-generated search traffic. Kang et al. [26] propose a semi-supervised system for identifying spam traffic from that of genuine human users. They first use the CAPTCHA technique along with some simple heuristics to extract a large set of training samples from the data log, and then develop a semi-supervised learning algorithm to improve the classification performance. Wang et. al. [27] propose a Sybil detection system which identify fake identities using server side clickstream models. They group similar user click-streams into the same cluster by calculating the distances between click-stream sequences. Similarly, in [28], the researchers propose an unsupervised system which can cluster similar users by partitioning a similarity graph on click-stream data. This system uses iterative feature pruning to partition the user clusters.
The other category of approaches investigates user session activities for detecting click spam. In [29],
Sadagopan and Li model each user session as a sequence of 2-tuples (user action, page number) with a Markov chain and calculate the distance of every session from the average using the Mahalanobis distance measure. A high distance implies an abnormal session and all clicks done in such a session are considered as spam. Li et al. [30] also model user sessions but with a sequence of 3-tuples (user action, action objective, time interval between actions). They also propose two bipartite-graph propagation algorithms (called user-session and session-pattern graphs) to achieve a higher precision and recall in click spam detection. Wang and et al. [31] use a hierarchical clustering technique to partition different user behaviors and detect abnormal activities. Also, their proposed tool can predict users’ future behavior. At last, Shakiba et al. [32] devise a stream clustering approach to identify malicious behaviors by leveraging linguistic features and behavioral characteristics of users.
In this work, we consider different characteristics of click spam behavior through extracting various session-based, user-based and IP-based features. Then, we propose a classification method to identify fraudulent clicks in a fast and practical manner.
III. THE PROPOSED METHOD
Like other recent works, our work focuses on identifying abnormal user sessions. But, we expand it by using user-level and IP-level information. Fig. 1 shows a schematic view of the processing flow in our system. It consists of two phases: offline and online. In the offline phase, we produce an initial set of training samples. Classifying sessions as normal/abnormal and updating the training dataset are done in the online phase. We discuss the details of two phases in the next sections.
A. Data Model
The data used in this work is derived from the user activity log of a popular Iranian local search engine (parsijoo.ir). The majority of users working with this search engine is from the domestic Intranet. Each time a user submits a query, clicks on a result or clicks on next page links, the search engine creates a new record in the user activity log. This record includes time information, submitted query, page number, clicked URL, IP address and user ID. It is notable that the first time a user enters the search engine website, a unique user ID is assigned to him and then stored in the cookie of his browser. The user ID never expires, unless the user cleans his cookies. Records are processed
sequentially based on their time information and then features are calculated.
Now, we briefly describe the features we use in the classification process. The features are categorized into three levels (session, user and IP) as explained below, respectively.
1) Session-Level Features
At the first level of features, we examine the within-session activities. When a user opens the search engine website in his browser, a unique session ID is assigned to him by the webserver. This session ID expires after a certain period of inactivity (usually 30 minutes) and then a new session ID is assigned to the user again on his next visit. During the session, the user might perform different activities in the website: he may submit a query, browse result pages, click on search result links, click on sponsored links, click on a specific page number, revise his query and so on. In this study, we only consider three types of activities:
𝑄𝑖: Submitting a query (which 𝑖 refers to different queries). For example, Q1 represents a query and Q2 represents another query which is different from Q1.
𝑊𝑖: Clicking on a web result or any other link on the page (which 𝑖 refers to different URLs).
𝑁: Clicking on different page numbers of search results. This click can be on the “Next Page” link, “Previous Page” link or a specific page number link. We take into account the following important features for identifying session-level spams:
Markovian probability of session activity sequence: this feature (proposed in [29]) is calculated by multiplying the probability of the individual state transitions within the session. Total number of web clicks (W)
Total number of query submissions (Q) Total number of next clicks (N)
Total number of session activities (sum of Q, W and N)
Proportion of clicks on distinct URLs to the total number of web clicks
Proportion of clicks on distinct domains to the total number of clicks
Rate of query submissions inside the session Rate of clicks inside the session
Fig. 1: System overview
Rate of Next clicks inside the session Rate of all activities inside the session
The last six features, to the best of our knowledge, are introduced here for the first time and the rest have been used in previous works as well [29]. The value of all features is normalized into the range of [0-1] using the Min-Max normalization method.
2) User-Level Features
The session-level features are calculated per each user session, but a user may have established multiple sessions thus far. Since a unique user ID is assigned to each user (which is valid as long as the user does not delete the cookie information in his browser), we can capture the whole user activities through extracting user-level features. More precisely, the user-level features are exactly the same as session-level ones, but they are averaged over all sessions belonging to the same user.
3) IP-Level Features
Many of bots do not execute JavaScript and/or they disable cookies, hence the search engine falsely assigns a new user ID as well as a new session ID, for each of their requests. Thus, only session-level and user-level features are not enough to characterize spam clicks; we need to use IP information as well. As a result, we consider the following IP-level features:
IP type (Local Iran IP / Global IP)
Total number of activities sent by IP address Total number of web clicks made by IP address Total number of queries submitted by IP address Total number of next clicks made by IP address Proportion of distinct clicked URLs to the total
number of web clicks made by IP address Proportion of distinct clicked domains to the
total number of web clicks made by IP address Proportion of total number of users to the total
number of activities made by IP address2
B. Training Dataset
Because of the search engine scalability issue, it is practically impossible to manually label search log records as bot/human for generating training dataset. In some services like email or electronic banking, every user must pass CAPTCHA challenge [33] in order to access the service but this strategy is not good for search engines, since the goal of search engines is to respond user queries as quickly as possible with minimum user interactions. However, Costa et al. [34] proposed the image clickable CAPTCHA idea which makes such a CAPTCHA less frustrating and humans can solve it quickly and accurately. But as mentioned, showing CAPTCHA to all users is not a good idea. Kang et al. [26] proposed an approach for training data generation which is 0-cost. They suggested to show CAPTCHA only to users that exceed from some heuristic
2Unlike real users, most of bots receive a new user ID per each request. 3More precisely, if 𝑡 = (𝑡
1, 𝑡2, … , 𝑡𝑚) and 𝑥 = (𝑥1, 𝑥2, … , 𝑥𝑚), then ‖𝑡 −
𝑥‖𝐿2= √(𝑡1− 𝑥1)2+ ⋯ + (𝑡𝑚− 𝑥𝑚)2.
thresholds. They showed that with this approach, on average, only less than 1% of whole users are requested for CAPTCHA verification while most of them do not verify the challenge. It means these users are bot programs which could not have resolved the CAPTCHA challenge. Similar to this work, we here use some simple heuristics such as user activity volume in a short time intervals and IP blacklists to generate an initial set of abnormal sessions. In this scenario, if the user behavior exceeds from some defined thresholds, we present a CAPTCHA to him. The user may not respond, respond wrongly or respond correctly to the challenge. In the first two cases, we label the user session as bot. In the other side, among all user sessions which have the minimum distance from the average activity, we randomly select some sessions and label them as normal. Thus, we collect an initial set of normal/abnormal sessions. Finally, we calculate the session-level, user-level and IP-level features (as described before) for these sessions and use them as the initial training dataset. As we will say later, the dataset is updated during the classification process.
C. Classification Algorithm
In order to classify sessions, we use the famous K-Nearest Neighbor (KNN) algorithm [35] which is a non-parametric method used frequently for classification and regression purposes. In this work, we devise two variants of KNN algorithm, i.e. two-class and one-class classification. It is worth mentioning that the KNN algorithm suffers from two key problems: 1) memory consumption, 2) computational complexity. The first problem arises because of storing the whole training data in memory and the second is caused by calculating the distance of a new point from all training samples. As the number of training samples increases, these two problems become more challenging, but we try to tackle them by revising the KNN algorithm.
1) Two-Class Classification Algorithm
As suggested by its name, this classifier uses both “abnormal” and “normal” samples in the training dataset. Assume that 𝑚 is the number of features we have calculated for each sample. Let 𝑇 = {(𝑥𝑖, 𝑦𝑖}𝑖=1𝑁 denote the training dataset, where 𝑥𝑖is a training sample (a vector in the 𝑚-dimensional feature space) and 𝑦𝑖 is the corresponding class label, i.e. 0 as normal and 1 as abnormal. For a test object 𝑡, its class label is determined in two steps:
First, the distance of the test object from every training sample is computed using the Euclidean distance:
𝑑(𝑡, 𝑥𝑖) = ‖𝑡 − 𝑥𝑖‖𝐿2 (1)
where ‖𝑥‖𝐿2 is 𝐿2 norm of 𝑥 vector3. The 𝐾 training points that have the smallest distance from the test object constitute its neighborhood. In the rest, we use
𝑁𝑁 to indicate the neighborhood of our test object. Second, the class label of the test object is determined by the majority vote of training samples in its neighborhood, i.e.:
𝑦′= 𝑎𝑟𝑔𝑚𝑎𝑥
𝑦 ∈ {0,1} ∑ 1
(𝑥𝑖𝑁𝑁,𝑦 𝑖 𝑁𝑁)
, 𝑖𝑓 𝑦𝑖𝑁𝑁= 𝑦 (2)
where (𝑥𝑖𝑁𝑁, 𝑦𝑖𝑁𝑁) is the 𝑖th training sample in 𝑁𝑁 and 𝑦′ is the predicted class label. Bear in mind that we use 0 and 1 to refer to normal and abnormal class labels, respectively.
In (2), all training samples equally impact on the determination of class label 𝑦′ , but it is more logical to weigh the contribution of neighbors, in a way that the closer neighbors contribute more compared to the farther ones. For example, a common weight scheme is to give each neighbor a weight of 1⁄𝑑2, where 𝑑 is the distance between the test object and the neighbor. Consequently, we can rewrite (2) as follows:
𝑦′= 𝑎𝑟𝑔𝑚𝑎𝑥
𝑦 ∑ 𝑑2(𝑡, 𝑥1 𝑖𝑁𝑁) (𝑥𝑖𝑁𝑁,𝑦𝑖𝑁𝑁)
, 𝑖𝑓 𝑦𝑖𝑁𝑁= 𝑦
(3)
where 𝑑(𝑡, 𝑥𝑖𝑁𝑁) is the distance of test object 𝑡 from 𝑖th
training point in its neighborhood.
We also introduce a counter field 𝑐𝑖 and add it to each training sample, i.e. 𝑇 = {(𝑥𝑖, 𝑦𝑖, 𝑐𝑖)}𝑖=1𝑁 . This field describes the number of samples that a training point can represent. In other words, a point in the training dataset can be representative of more than one sample. Thus, instead of adding more and more data points to the training dataset for the sake of improving the classification accuracy, we can update this field for those training points that are close to the test object. As a result, we can limit the number of training points based on the available memory (we discuss more about this issue in Section III.D). We also incorporate this counter in the classification score of test object 𝑡:
𝑠𝑐𝑜𝑟𝑒(𝑡) =
∑ 𝑐𝑖
𝑑2(𝑡, 𝑥𝑖𝑁𝑁)∗ 𝑦𝑖 𝑁𝑁 𝐾
𝑖=1
∑ 𝑐𝑖
𝑑2(𝑡, 𝑥 𝑖𝑁𝑁) 𝐾
𝑖=1
(4)
The value of classification score is normalized into the range [0-1]. In fact, as much as the above score is higher, the object 𝑡 is relatively closer to the abnormal points inside its neighborhood. Put it another way, a lower value means human behavior, while a higher value indicates a greater chance of bots. We set two thresholds for the classification score: 𝐻𝑇 (human threshold) and 𝐵𝑇 (bot threshold). If the calculated score is lower than HT, the new point is classified as “human” or “0”, and if the calculated score is greater than BT, the new point is considered as “bot” or “1”. Otherwise, the new point is classified as “unknown”. In the evaluation section, we discuss how to set theses thresholds.
2) One-Class Classification Algorithm
In the one-class algorithm, we only use “abnormal” samples in our training dataset. The main advantage of this algorithm compared with the previous two-class one is that the size of training dataset is reduced and thus, the computational overhead and the response time decrease substantially. Similar to the previous section, we first describe the one-class algorithm and then modify it for our work. Let 𝑇 = {𝑥𝑖}𝑖=1𝑁 denote the training dataset, where 𝑥𝑖 is a training sample vector in the 𝑚-dimensional feature space. For a test object 𝑡, its
class label is determined in two steps: First, like the two-class method, the distance of the test object from the training points is computed and 𝐾 points that have the smallest distance are considered as the neighborhood of 𝑡. Second, the label of test object 𝑡 is assigned as abnormal, if the following inequality holds:
∑𝐾𝑖=1𝑑(𝑡, 𝑥𝑖𝑁𝑁)
∑ 𝑑(𝑥𝑖𝑁𝑁, 𝑛𝑒𝑎𝑟(𝑥 𝑖𝑁𝑁)) 𝐾
𝑖=1
< 𝛿 (5)
where 𝑑(𝑥𝑖𝑁𝑁, 𝑛𝑒𝑎𝑟(𝑥𝑖𝑁𝑁)) is the distance of 𝑖th training
point in the test object’s neighborhood from its nearest neighbor in the training dataset. Clearly, a higher value for the above ratio entails that the object 𝑡 is closer to the abnormal points inside its neighborhood.
Again, to mitigate the memory consumption problem and increase the classification accuracy, we add a counter field to each training sample, which implies that 𝑇 = {(𝑥𝑖, 𝑐𝑖)}𝑖=1𝑁 . We first reverse the inequality in (5) to define the similarity between object
𝑡 and its neighbors as follows:
∑ 1
𝑑(𝑡, 𝑥𝑖𝑁𝑁) 𝐾
𝑖=1
∑ 1
𝑑(𝑥𝑖𝑁𝑁, 𝑛𝑒𝑎𝑟(𝑥𝑖𝑁𝑁)) 𝐾
𝑖=1
> 1
𝛿 (6)
Then, we add the counter field as a coefficient into the above relation:
∑ 𝑐𝑖𝑁𝑁
𝑑(𝑡, 𝑥𝑖𝑁𝑁) 𝐾
𝑖=1
∑ 𝑐𝑖
𝑁𝑁(𝑥𝑖𝑁𝑁)
𝑑(𝑥𝑖𝑁𝑁, 𝑛𝑒𝑎𝑟(𝑥 𝑖𝑁𝑁)) 𝐾
𝑖=1
> 1
𝛿 (7)
where 𝑐𝑖𝑁𝑁 is the counter field of 𝑖th training sample in
the neighborhood of 𝑡. Now, we explain our strategy for updating the counter field of training points. Later, we describe our analysis about the settings of δ.
D. Updating Training Data
We start our algorithm with an initial set of training samples, but for the sake of increasing the classification accuracy, we need to add more training samples over time. Adding more samples results in a more memory and processing overhead in the classification process. Hence, we introduce a counter field for every training sample with an initial value of 1. After classification, if the test object 𝑡 is labeled as “normal” or “abnormal”, then the counter field of every training point in its neighborhood is updated in proportion to its distance from the test object. As much as the counter field of a training point has a higher value, that point will have a more contribution in classifying new points as “normal” or “abnormal”.
One advantage of the proposed system is that it can be easily deployed in an online environment. If a session is classified as “abnormal”, the CAPTCHA challenge will be shown to the user. If the user cannot resolve the challenge, the corresponding feature vector is added to the training dataset as “abnormal” and otherwise, the vector is added as “normal”. However, we put a limit on the number of training samples based on the memory and processing constraints. As a result, after classifying the test object 𝑡, the training dataset is updated according to the following scenario:
1. First, for every training sample 𝑖 in the neighborhood of object 𝑡, if the distance of sample 𝑖 from the test object is less than 𝛼 threshold and its label is the same as 𝑡, the counter field of training point 𝑖 is updated as below:
𝑐𝑖= 𝑐𝑖+ (1 −
𝑑(𝑡, 𝑥𝑖𝑁𝑁)
∑𝐾𝑗=1𝑑(𝑡, 𝑥𝑗𝑁𝑁)
) (8)
Based on our experiments, the value of 𝛼 is set to 0.2.
2. Then, if all training points in the neighborhood set do not have the same label as the test object 𝑡, the new point is added to the training dataset as below:
If the size of training dataset is smaller than the limit, the new point is added to the training dataset.
Otherwise, we first add the new point and then find two closest samples (with the same label) in the training set and merge them together. For merging, we calculate the average of feature vectors and sum up their counters. It means two points
(𝑥𝑖, 𝑐𝑖) and (𝑥𝑗, 𝑐𝑗) are deleted and the new point (𝑥𝑖+ 𝑥2 𝑗, 𝑐𝑖+ 𝑐𝑗) is added to the training dataset.
IV. EVALUATION AND DISCUSSION
A. Evaluation Model
In this section, we evaluate the result of our proposed methods in different aspects and compare them with previous methods. We use one week of user activity log (1 Dec 2016 – 7 Dec 2016) for generating the training dataset which contains more than 6 million requests and over 1.5 million unique sessions (note that DDoS attacks are abandoned by the front firewall and thus, there is no record belonging to such attacks in the log). Also, we use the log of the next week (8 Dec 2016 - 14 Dec 2016) for evaluation and test purposes. We first model all sessions according to the features introduced in Section 3.A and then use them in our classification algorithms. We validate our training dataset under two conditions: with and without updating the training dataset. Then, we evaluate the performance of our classifiers and choose the best value for various thresholds using experimental results. We finally compare the precision of our work with some of last related works.
B. K-Fold Cross-Validation
We prepare a dataset with 10000 samples (5000 normal and 5000 abnormal), which are labeled manually. For validation and comparison purposes, we use the popular K-fold cross-validation technique [36] in which the dataset is randomly partitioned into K equal-sized subsets. From K subsets, one is retained as the validation data for testing the model, and the remaining are used for training. The cross-validation process is then repeated K times, while each of the 𝐾 subsets is used exactly once as the validation data. The cross-validation method uses the classification accuracy measure, defined as:
𝐶𝐴 = 𝑇𝑃 + 𝑇𝑁
𝑇𝑃 + 𝐹𝑁 + 𝑇𝑁 + 𝐹𝑃 (9) where “True Positive (TP) / True Negative (TN)” is the
number of points which are correctly classified as abnormal/normal. Also, “False Positive (FP) / False Negative (FN)” is the number of “normal/abnormal” points which are incorrectly classified as “abnormal/normal”. All these values can be counted simply, because each point in the dataset is labeled either normal or abnormal. Therefore, the classification accuracy is calculated as the proportion of true results (true positives and true negatives) among all cases examined. Moreover, like other works in the literature [29, 30], we evaluate the performance of our classification algorithm using the precision measure:
𝑃𝑟𝑒𝑐𝑖𝑠𝑖𝑜𝑛 = 𝑇𝑃
𝑇𝑃 + 𝐹𝑃 (10)
The results from the K folds are averaged to get the final value. We use 10-fold cross-validation (i.e. K=10).
C. Evaluation Results
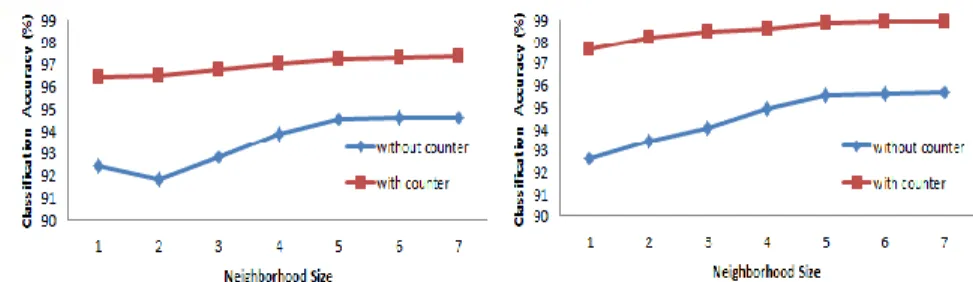
First, we investigate the impact of neighborhood size, or K in the KNN algorithm, on the accuracy of our algorithms. Initially, the counter field of all training samples is “1”. We apply our cross-validation twice, once without updating the counter filed of training samples, and another time with updating the counter field. The result of validation for both classifiers is shown in Fig. 2 (the left and the right figures refer to the result of two-class and one-class classifiers, respectively). In both, the comparison of two cases (with and without counter) for different values of neighborhood size shows that with updating the counter field, the classification accuracy is enhanced up to 3%. Also, we see that when using the counter field, two classifiers would be less sensitive to the value of K, which alleviates one of the KNN challenges. Based on Fig. 2: The impact of neighbourhood size on the accuracy of proposed methods (left:
two-class classification, right: one-class classification)
this result, we select K=5, which yields the most accuracy.
Now, we discuss how to choose the best values for
𝐻𝑇, 𝐵𝑇 and δ thresholds. Fig. 3 depicts the frequency distribution of session scores obtained from the two-class method in 10 equal-sized bins in the range [0-1]. From the figure, we can see that when the counter is not used, 92% of sessions have a score less than 0.1 and 7% of sessions have a score higher than 0.9, while after adding and updating the counter field, 95% of sessions get a score less than 0.1 and for only 4.5% of sessions, the score is greater than 0.9. According to the algorithm, we know that a higher score implies that the session is more likely to be abnormal. Hence, we set 0.1 and 0.9 for 𝐻𝑇 and 𝐵𝑇 thresholds, respectively.
From Fig. 3, we can also see that in the counter-sensitive method, 2.5% fewer sessions are classified as abnormal. Therefore, for more experiments, we randomly sample 200 sessions with a score in the range of [0.9-1] to evaluate the classifier precision manually and determine what proportion of sessions is correctly classified as abnormal. The results are shown in Table 1.
The results in Table 1 reveal that the proposed counter-sensitive algorithm can identify abnormal sessions with a precision of about 95.5% which has up to 10% enhancement comparing with the no-counter algorithm. In addition, it can be observed that without using the counters, the system has more false positives, while with the counters, we can catch abnormal sessions with a more precision and as a result, fewer sessions are labeled as abnormal. A deeper investigation of sessions which are incorrectly detected as abnormal demonstrates that the normal points in the training data cannot cover all aspect of real user behaviors. Since our goal is just to detect abnormal sessions, we can simplify the problem and focus only on abnormal points by using the one-class classification algorithm.
Table 1: Precision of two-class classification for sessions with score range of [0.9-1]
#Session #Correct Precision (%)
Without Counter 200 170 85
With Counter 200 191 95.5
Table 2: Precision of one-class classification for sessions with different score ranges
Score Range #Session #Correct Precision (%)
[0.5-0.6) 41 2 4.87
[0.6-0.7) 23 3 13.04
[0.7-0.8) 18 5 27.77
[0.8-0.9) 19 17 89.47
[0.9-1) 15 14 93.33
[1-∞) 84 83 98.80
Unlike the two-class algorithm, the calculated score of one-class classification in (7) lies in the range [0-∞). Similar to the above analysis, we first obtain the frequency distribution of session scores. The bin size is 0.1, but we aggregate scores greater than 1 in the last bin. The results are displayed in Fig. 4.
Again, we randomly sample 200 sessions from those with a score greater than 0.5 and examine the precision of one-class algorithm in detecting abnormal sessions. The results are shown in Table 2. Remind that as much as a session gets a higher score, it is more likely to be abnormal. Because the detection of spam behavior requires a high precision, we take sessions with a score greater than 0.8 as abnormal. As a result, we consider 1.25 for 𝛿 threshold in (7), resulting to a precision of about 97%. In other word, just 3% of sessions (with a score greater than 0.8) are wrongly classified as abnormal. It must be noted the setting of our thresholds is data-dependent and thus they cannot be generally configured to the same values. The above analysis confirms that the proposed one-class classification has a higher precision on our data. Moreover, since we do not need to store normal points in the training dataset, the computational and storage overhead of the system is reduced substantially.
D. Comparison with Previous Works
Finally, we compare the performance of our algorithm with two previous click spam detection methods [29, 30], known as typical/atypical and bipartite algorithms, respectively. For the typical/atypical algorithm, we model each user session as a sequences of (user action, page number) with a Markov chain and calculate the distance of each session from the average using Mahalanobis distance measure and then, consider the sessions belonging to the top one percentile of the distance distribution as abnormal. Fig. 3: Score frequency distribution of sessions for two-class
classification algorithm Fig.4: Score frequency distribution of sessions for one-class classification algorithm
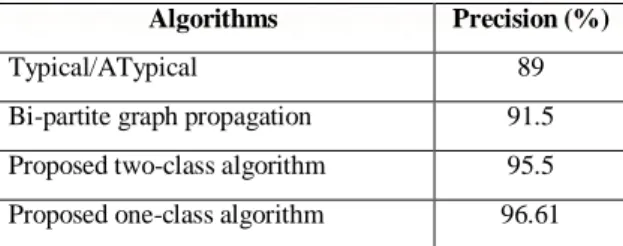
Table 3: Precision obtained with difference algorithms Algorithms Precision (%)
Typical/ATypical 89
Bi-partite graph propagation 91.5
Proposed two-class algorithm 95.5
Proposed one-class algorithm 96.61
Also, in the bipartite algorithm, we first model user sessions as sequence of (user action, action objective and time interval between actions) and then apply the user-session bipartite graph propagation algorithm on these sessions. Finally, we consider sessions with a score higher than 0.9 as abnormal. In addition, we randomly sample 200 sessions for manual investigation.
The precision of the three approaches are illustrated in Table 3. Our two-class approach outperforms the previous works by 4% and more interestingly, the one-class approach shows about 5.1% improvement. It should also be noted that both typical/atypical and bipartite algorithms work only in offline environment, while our proposed algorithms are able to detect click spams in online environment with a lower memory and CPU overhead.
V. CONCLUSION
In this paper, we propose a couple of novel and efficient classification-based algorithms for detecting spam sessions and clicks. We first present some important features of normal/abnormal behaviors in the web which are helpful in distinguishing humans from bots. Then, we propose our two-class and one-class classification algorithms to detect click bots. The proposed algorithms work based on the KNN algorithm and we overcome the problem of classic KNN algorithm including high memory consumption and excessive processing by using a simple counter field which is updated regularly with the new data. Our proposed algorithms can detect spams with a precision of up to 96% which is higher than previous algorithms.
REFERENCES
[1] Page, L., Brin, S., Motwani, R., Winograd, T.: The pagerank citation ranking: Bringing order to the web. Technical Report 1999-66, Stanford InfoLab (1999)
[2] Marchiori, M.: The quest for correct information on the web: Hyper search engines. Computer Networks 29(8), 1225–1236 (1997)
[3] Agichtein, E., Brill, E., Dumais, S.: Improving web search ranking by incorporating user behavior information. In: Proceedings of the 29th International ACM SIGIR Conference on Research and Development in Information Retrieval, SIGIR’06, pp. 19–26. ACM, New York, NY, USA (2006) [4] Chapelle, O., Zhang, Y.: A dynamic bayesian network click
model for web search ranking. In: Proceedings of the 18th International Conference on World Wide Web, WWW’09, pp. 1–10. ACM, New York, NY, USA (2009)
[5] Kim, H.J., Tong, S., Shazeer, N.M., Diligenti, M.: Modifying search result ranking based on implicit user feedback (2016). US Patent 9,235,627
[6] Liu, Y., Cen, R., Zhang, M., Ma, S., Ru, L.: Identifying web spam with user behavior analysis. In: Proceedings of the 4th International Workshop on Adversarial Information Retrieval
on the Web, AIRWeb ’08, pp. 9–16. ACM, New York, NY, USA (2008)
[7] Gu, G., Perdisci, R., Zhang, J., Lee, W.: Botminer: Clustering analysis of network traffic for protocol and structure-independent botnet detection. In: Proceedings of the 17th Conference on Security Symposium, SS’08, pp. 139–154. USENIX Association, Berkeley, CA, USA (2008)
[8] Schluessler, T., Goglin, S., Johnson, E.: Is a bot at the controls?: Detecting input data attacks. In: Proceedings of the 6th ACM SIGCOMM Workshop on Network and System Support for Games, NetGames ’07, pp. 1–6. ACM, New York, NY, USA (2007)
[9] Dou, Z., Song, R., Yuan, X., Wen, J.R.: Are click-through data adequate for learning web search rankings? In: Proceedings of the 17th ACM Conference on Information and Knowledge Management, CIKM ’08, pp. 73–82. ACM, New York, NY, USA (2008)
[10] I. A. Board. 2016 (Full Year) Internet Advertising Revenue Report. http://www.iab.net
[11] Google: Google Adwords. https://www.google.com/adwords [12] Google: Google AdSense. https://www.google.com/adsense [13] Szetela, D., Kerschbaum, J.: Pay-Per-Click Search Engine
Marketing: An Hour a Day. SYBEX Inc., Alameda, CA, USA (2010)
[14] Miller, B., Pearce, P., Grier, C., Kreibich, C., Paxson, V.: What’s clicking what? techniques and innovations of today’s clickbots. In: Proceedings of the 8th International Conference on Detection of Intrusions and Malware, and Vulnerability Assessment, DIMVA’11, pp. 164–183. Springer-Verlag, Berlin, Heidelberg (2011)
[15] Alrwais, S.A., Gerber, A., Dunn, C.W., Spatscheck, O., Gupta, M., Osterweil, E.: Dissecting ghost clicks: Ad fraud via misdirected human clicks. In: Proceedings of the 28th Annual Computer Security Applications Conference, ACSAC’12, pp. 21–30. ACM, New York, NY, USA (2012)
[16] Pearce, P., Dave, V., Grier, C., Levchenko, K., Guha, S., McCoy, D., Paxson, V., Savage, S., Voelker, G.M.: Characterizing large-scale click fraud in zeroaccess. In: Proceedings of the 2014 ACM SIGSAC Conference on Computer and Communications Security, CCS ’14, pp. 141– 152. ACM, New York, NY, USA (2014)
[17] Metwally, A., Agrawal, D., Abbad, A.E., Zheng, Q.: On hit inflation techniques and detection in streams of web advertising networks. In: 27th International Conference on Distributed Computing Systems, AIRWeb ’08, pp. 52–52 (2007)
[18] Stone-Gross, B., Stevens, R., Zarras, A., Kemmerer, R., Kruegel, C., Vigna, G.: Understanding fraudulent activities in online ad exchanges. In: Proceedings of the 11th ACM SIGCOMM Conference on Internet Measurement Conference, IMC ’11, pp. 279–294. ACM, New York, NY, USA (2011) [19] Dave, V., Guha, S., Zhang, Y.: Viceroi: Catching click -spam
in search ad networks. In: Proceedings of the 2013 ACM SIGSAC Conference on Computer and Communications Security, CCS ’13, pp. 765–776. ACM, New York, NY, USA (2013)
[20] Oentaryo, R., Lim, E.P., Finegold, M., Lo, D., Zhu, F., Phua, C., Cheu, E.Y., Yap, G.E., Sim, K., Nguyen, M.N., Perera, K., Neupane, B., Faisal, M., Aung, Z., Woon, W.L., Chen, W., Patel, D., Berrar, D.: Detecting click fraud in online advertising: A data mining approach. Journal of Machine Learning Research 15(1), 99–140 (2014)
[21] Kitts, B., Zhang, Y.J., Wu, G., Brandi, W., Beasley, J., Morrill, K., Ettedgui, J., Siddhartha, S., Yuan, H., Gao, F., Azo, P., Mahato, R.: Click Fraud Detection: Adversarial Pattern Recognition over 5 Years at Microsoft, pp. 181–201. Springer International Publishing, Cham (2015)
[22] Juels, A., Stamm, S., Jakobsson, M.: Combating click fraud via premium clicks. In: Proceedings of 16th USENIX Security Symposium on USENIX Security Symposium, SS’07, pp. 2:1– 2:10. USENIX Association, Berkeley, CA, USA (2007) [23] Haddadi, H.: Fighting online click-fraud using bluff ads.
SIGCOMM Computer and Communication Review, 40(2), pp. 21–25 (2010)
[24] Kitts, B., Zhang, J.Y., Roux, A., Mills, R.: Click fraud detection with bot signatures. In: Proceedings of the 2013 IEEE International Conference on Intelligence and Security Informatics (ISI), pp. 146–150 (2013)
[25] Yu, F., Xie, Y., Ke, Q.: Sbotminer: Large scale search bot detection. In: Proceedings of the 3th ACM International Conference on Web Search and Data Mining, WSDM ’10, pp. 421–430. ACM, New York, NY, USA (2010)
[26] Kang, H., Wang, K., Soukal, D., Behr, F., Zheng, Z.: Large-scale bot detection for search engines. In: Proceedings of the 19th International Conference on World Wide Web, WWW ’10, pp. 501–510. ACM, New York, NY, USA (2010) [27] Wang, G., Konolige, T., Wilson, C., Wang, X., Zheng, H.,
Zhao, B.Y.: You are how you click: Clickstream analysis for sybil detection. In: Proceedings of the 22nd USENIX Conference on Security, SEC’13, pp. 241–256. USENIX Association, Berkeley, CA, USA (2013)
[28] Wang, G., Zhang, X., Tang, S., Zheng, H., Zhao, B.Y.: Unsupervised clickstream clustering for user behavior analysis. In: Proceedings of the 2016 CHI Conference on Human Factors in Computing Systems, CHI ’16, pp. 225–236. ACM, New York, NY, USA (2016)
[29] Sadagopan, N., Li, J.: Characterizing typical and atypical user sessions in clickstreams. In: Proceedings of the 17th International Conference on World Wide Web, WWW ’08, pp. 885–894. ACM, New York, NY, USA (2008)
[30] Li, X., Zhang, M., Liu, Y., Ma, S., Jin, Y., Ru, L.: Search engine click spam detection based on bipartite graph propagation. In: Proceedings of the 7th ACM International Conference on Web Search and Data Mining, WSDM ’14, pp. 93–102. ACM, New York, NY, USA (2014)
[31] Wang, G., Zhang, X., Tang, S., Zheng, H., Zhao, B. Y. Unsupervised Clickstream Clustering for User Behavior Analysis. In Proceedings of the CHI’16 Conference on Human Factors in Computing Systems , pp. 225–236. New York, NY, USA (2016)
[32] Shakiba, T., Zarifzadeh, S., Derhami, V. Spam query detection using stream clustering. Springer World Wide Web, 21(2), pp. 557–572 (2018)
[33] Ahn, L.V., Blum, M., Hopper, N.J., Langford, J.: Captcha: Using hard ai problems for security. In: Proceedings of the 22nd International Conference on Theory and Applications of Cryptographic Techniques, EUROCRYPT’03, pp. 294–311. Springer-Verlag, Berlin, Heidelberg (2003)
[34] Costa, R.A., de Queiroz, R.J.G.B., Cavalcanti, E.R.: A proposal to prevent click-fraud using clickable captchas. In: Proceedings of IEEE 6th International Conference on Software Security and Reliability Companion (SERE-C), pp. 62–67 (2012)
[35] Cover, T., Hart, P.: Nearest neighbor pattern classification. IEEE Transaction on Information Theory, 13(1), pp. 21–27 (2006)
[36] Refaeilzadeh, P., Tang, L., Liu, H.: Cross-validation. Encyclopedia of Database Systems pp. 532–538 (2009)
AUTHOR BIOGRAPHIES
Mahdieh Fallah received the B.Sc. degree in Information Technology Engineering from the Isfahan University of Technology, Isfahan, Iran, in 2013, and the M.Sc. degree in Computer Networks from Yazd University, Yazd, Iran, in 2016. Her current research interests include networking, computer security, distributed computing and big data analytics. She is currently working at Parsijoo, the first Persian search engine.
Sajjad Zarifzadeh
received his Ph.D in Computer Science and Engineering from University of Tehran, Iran, in 2012. He is currently an assistant professor in Yazd University, Iran. His research interest is primarily on big-data applications and Internet services. The results of his research have been published in well-known conferences and journals, including ACM IMC, ACM SIGMETRICS, WWW, IEEE Communication Magazine, Elsevier Computer Networks, Elsevier Computer Communications, etc.