Examining the Correlation Between C-reactive protein Concentration and Glycemic Variability in Adults with Type 2 Diabetes
By Rebecca Lane
Honors Essay Department of Nutrition
University of North Carolina at Chapel Hill
Approved: __________________________________ Advisor: Elizabeth Mayer-Davis
ABSTRACT
Rebecca Lane: Examining the Correlation Between C-reactive protein Concentration and Glycemic Variability in Adults with Type 2 Diabetes
Purpose:
The purpose of this study was to assess the potential association between glycemic variability (GV) as assessed by standard deviation (SD) of mean blood glucose based on continuous glucose monitoring (CGM) and C-reactive protein concentration (CRP) in adults with type 2 diabetes mellitus.
Methods:
This is a post hoc analysis of data that were collected from a prospective randomized controlled trial of patients with insulin-requiring type 2 diabetes at Mountain Diabetes and Endocrine Center in Asheville, NC. CGM data and CRP levels were obtained at baseline from 42 insulin-treated patients with type 2 diabetes. CRP levels were drawn from the study cohort and frozen, then analyzed by HPLC assay, LabCorp, Burlington, NC. All study subjects wore a 72-hour continuous glucose monitor (CGM) (Medtronic iPro, Medtronic Inc, Northridge, CA) at baseline as part of the study and the standard deviation of blood glucose levels was obtained for each subject from the CGM downloads. The standard deviation was used as a measure of glycemic variability. Data from a total of 39subjects were used for analysis in this project. All patients had T2DM and were adults above the age of 18 years.
Results:
analysis in the total cohort. There was still no association after adjusting for confounding variables (p=0.47, NS).
Conclusion:
TABLE OF CONTENTS
LIST OF TABLES………..…..vi
LIST OF FIGURES………..…..……..vii
LIST OF ABBREVIATIONS………...……..…..viii
Chapter I. INTRODUCTION AND SPECIFIC AIMS……….………...……1
II. LITERATURE REVIEW………..………...8
III. MANUSCRIPT FOR SUBMISSION………..….…...……16
Abstract………..………...…...……16
Introduction………..………...…….18
Methods………..……….….…...18
Results………..………….….….…..21
Discussion and limitations………..………...22
Implications……….……..……….………..……25
REFERENCES………...…..……...36
LIST OF TABLES
Table Page
1 GV and CRP by demographic characteristics ……….………..27 2 GV and demographic and clinical characteristics by CRP value ………….…….28 3 Association between GV and CRP in total sample population (crude)……….…29 4 Association between GV and CRP in total sample population, adjusting for
age, gender, and fasting status ………...….…...29 5 Association between GV and CRP in total sample population, adjusting for
age, gender, fasting status, A1c, and BMI ………...…….30 6 Association between GV and CRP in total sample population, adjusting for
age, gender, fasting status, A1c, BMI, percentage of bolus to basal, statin use, and ASA use………..…...… 31 7 Mean (SD) of CRP according to tertiles of CRP and tertiles of GV.………31 8 Mean (SD) of GV according to tertiles of CRP and tertiles of GV……….. 31 9 CRP and glycemic variability of 39 patients included in correlation analysis…..44 10 Full model showing association between GV and CRP in total sample
population (crude)………..46 11 Full model showing association between GV and CRP in total sample
population, adjusting for age, gender, and fasting status……….. 46 12 Full model showing association between GV and CRP in total sample
population, adjusting for age, gender, fasting status, A1c, and BMI……… 47 13 Full model showing association between GV and CRP in total sample
LIST OF FIGURES
Figures Page
LIST OF ABBREVIATIONS T2DM: Type 2 Diabetes Mellitus
CRP: C-reactive protein GV: Glycemic variability
ADA: American Diabetes Association SD: Standard Deviation
CGM: Continuous Glucose Monitor ASA: Aspirin
CHAPTER ONE
INTRODUCTION AND SPECIFIC AIMS
Introduction
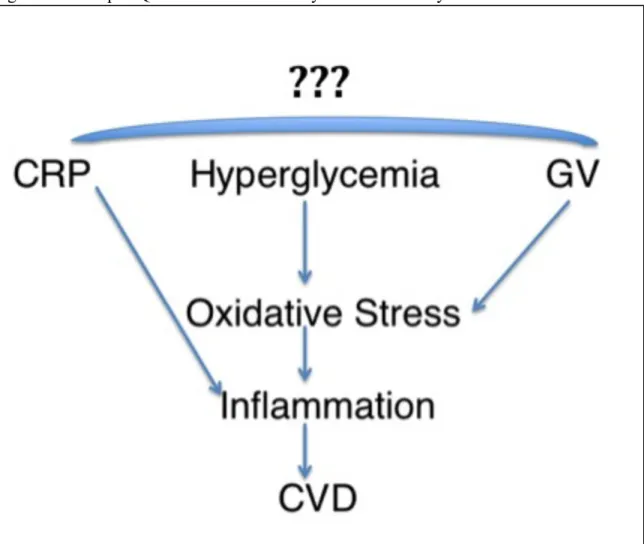
Large landmark clinical trials have shown that hyperglycemia contributes to diabetes-related complications, specifically microvascular and macrovascular damage.12 However, few studies have addressed the correlation between glycemic variability, defined as the troughs and peaks of blood glucose, and the risk of cardiovascular disease. Glycemic variability encompasses acute glucose fluctuations from peaks to nadirs.3 It has been shown that glycemic variability leads to increased oxidative stress, measured by the oxidative stress marker, 8-iso PGF2alpha.4 Oxidative stress leads to endothelial dysfunction and inflammation.5 C-reactive protein (CRP), a protein produced by the liver that has been associated with cardiovascular risk, is released in response to endothelial dysfunction and inflammation.6 It has been shown that hyperglycemia is a risk factor for cardiovascular disease7, which raises inflammatory markers such as interleukin-6 and CRP.8 It has also been shown that there is a correlation between glycemic variability (GV) and the presence of coronary artery disease.9,10 However, research that specifically examines the association between glycemic variability and coronary artery disease is limited11 (Figure 1).
Epidemiology
Cost of Diabetes
Diabetes is an expensive disease. According to the American Diabetes Association (ADA), there has been a 41% increase in diabetes costs from 2007-2012. The total cost of diagnosed diabetes in 2007 was estimated to be $174 billion, rising to an estimated $245 billion in 2012.19 The ADA estimates costs to reach nearly $14,000 per year for people with diagnosed diabetes. These expenditures are estimated to be 2-3 times higher than those of non-diabetic patients.20 The costs of diabetes are not limited to supplies needed to treat the disease itself (such as blood glucose meters, testing strips and lancets, insulin pumps, insulin, etc.), but also to treat the complications of the disease. These complications are described below and include neuropathy, retinopathy, and nephropathy. Severe acute blood glucose excursions, both hypoglycemic and hyperglycemic, may necessitate emergency intervention or hospitalization, contributing to the financial burden of diabetes on the healthcare system. Because having diabetes invariably engenders additional treatment and associated costs for several diseases beyond just the diabetes itself, it is especially important that physicians and patients alike take appropriate steps in reducing the incidence of diabetes and the severity of its complications.
Type 2 diabetes mellitus (T2DM)
In adults, Type 2 diabetes mellitus (T2DM) accounts for approximately 90-95% of all diagnosed cases21 and is the most common form of diabetes today. In this form of diabetes, both impaired insulin secretion and insulin resistance exist. Insulin is a hormone produced by the beta cells of the pancreas that lowers the blood glucose by promoting glucose uptake and utilization in its target tissues, primarily skeletal muscle and fat, where glucose is either utilized as a source of energy or stored as glycogen. T2DM is characterized early in the disease state by insulin resistance, in which the body is unable to properly utilize insulin that is released from the pancreas. In the patient with T2DM, insulin resistance is coupled with impaired insulin production as the beta cells eventually lose the ability to synthesize and secrete insulin.22 T2DM is strongly associated with obesity, which initially causes insulin resistance and later, through inflammation, induces beta cell injury and loss.23
Diabetes complications
Importance of glycemic variability
Recent research suggests that GV may play an important role in the development of cardiovascular complications through increased oxidative stress.26,27,28,29,30 Oxidative stress is known to contribute to atherosclerosis and heart failure.31 The mechanism by which glycemic variability is thought to increase oxidative stress that may lead to atherogenesis will be discussed in further detail in chapter 2.
Measures of glycemic variability
Reviewed by David Rodbard, there are several ways to measure glycemic variability.32 Some of the most common ways to measure GV include percentages such as ‘percentage in target range’ or ‘percentage below target range’, mean glucose values, standard deviation of all glucose values, the mean amplitude of glycemic excursions (MAGE), which measures the average amplitude of glucose peaks and troughs with a magnitude greater than 1 SD, and glycemic risk assessment diabetes equation (GRADE), which is a new measure of GV and uses an equation to asses GV. SD is considered to be the simple and classical way of measuring GV33 and will be discussed in further detail in chapter 2.
conditions include but are not limited to hypertension, hypercholesterolemia, obesity, a sedentary lifestyle, hyperglycemia, and smoking.36 In 2005-2008, 67% of adults aged 20 years or older and with self-reported diabetes had hypertension, having a blood pressure reading >140/90 mm Hg or using pre-prescription medications for hypertension.37
Hyperglycemia is associated with increased cardiovascular risk38 and thus it is important to target hyperglycemia as a treatment goal of diabetes to decrease this risk. Studies have also shown an association between glycemic variability and oxidative stress markers such as 8-iso-PGF2α, and that normalizing blood glucose concentration can decrease risk of cardiovascular disease.39,40,41,42 Hyperglycemia also has a positive correlation with CRP concentration.43 Figure 2 shows how diabetes mellitus can lead to atherogenesis through hyperglycemia, excess free fatty acids, and insulin resistance eventually leading to increased oxidative stress and ultimately atherogenesis.44
Specific Aims
1) To conduct a literature review regarding the association between glycemic variability and CRP
Research question 1.1: Does the literature support an association between GV and CRP?
2) To determine if there is a correlation between glycemic variability (GV) and C-reactive protein concentration (CRP) among adults with insulin-treated type 2 diabetes
CHAPTER TWO LITERATURE REVIEW
This literature review will examine current research regarding glycemic variability, continuous glucose monitoring, hyperglycemia, and oxidative stress. It will then cover pertinent literature describing connections between these topics and CRP, inflammation, and cardiovascular complications.
Importance of glycemic variability
Oxidative stress is known to contribute to atherosclerosis and heart failure.46 GV has been thought to increase oxidative stress through increased production of superoxide by the electron transport chain (ETC). Increased production of superoxide leads to a deleterious cascade that includes events such as increased formation of glycation end products and activation of protein kinase C (PKC).47 This cascade can ultimately lead to endothelial damage followed by vasoconstriction, inflammation, thrombosis, and eventually atherogenesis (Figure 2).48
How to measure glycemic variability:
the average blood glucose level over the previous three months, while the ADRR is measured using traditional self-monitoring blood glucose (SMBG) data, or fingersticks. Both HbA1c and SMBG values provide few values to work with and for this reason are not used as frequently to calculate GV as CGM approaches.
There are at least twenty different CGM approaches in measuring glycemic variability.49 One of the more common criteria is total standard deviation (SD or SDT). SD is the standard deviation of all glucose values available for a given patient, and is considered to be one of the more simple and classical methods to measure glycemic variability. Most software programs measure SD, making SD an easily accessed measure of glycemic variability. A leading expert on GV, David Rodbard M.D. states that when needing to simply measure GV, SD is likely to be one of the best overall measures to use. Rodbard concludes that SD is highly correlated with the other main measures of glycemic variability.50 CGM outputs include GV measures such as SD and mean amplitude of glycemic excursions (MAGE) and for this reason it is easy to use this data, which encompasses glucose levels captured every five minutes over a period of several days, rather than using SMBG data which only captures specific time points which are usually hours apart. The CGM outputs used for this analysis did not include MAGE values and so only SD was used as a measure of GV.
Continuous Glucose Monitor (CGM)
a needle. The needle is removed and the wire is left under the skin to measure the glucose levels of the interstitial fluid as an approximation of blood glucose concentration. A transmitter is present to send information (via radio waves) about glucose levels from the sensor to a monitoring device. The transmitter is removed after a given time period (such as three or five days) and uploaded to a computer. A graph of the patients’ sugars over the given time period is generated. This CGM output data may be used for diabetes management in making appropriate decisions about food, exercise, or medications.51
CGM Mechanism
A CGM measures the magnitude of the electrical charge produced by a chemical reaction
that occurs when the sensor is placed under the skin. The sensor is embedded with the
glucose-oxidase enzyme, which catalyzes the reaction of glucose + H2O gluconic acid + H2O2.52 The
electrode oxidizes hydrogen peroxide into 2H+ + O2 + 2e-. The electrical gradient that is
produced by this charge correlates the interstitial glucose levels into a sensor signal, and this
current is transmitted to a processor cable, which analyzes the incoming data and displays the
concentrations on the monitor (Figure 3).53 Figure 454 shows the components of a CGM system.
CGM Limitations
While a CGM is beneficial in the complete picture that it provides, it does have its
limitations. For starters, it measures interstitial fluid glucose levels rather than actual blood
glucose levels. The sensor also needs to be changed every few days as it gets worn down, and
proteins become embedded on it and thereby prevent proper diffusion of glucose to the
of the interstitial fluid before it can function properly. Lastly, the precision of CGMs are
dependent upon calibration. The user must perform 2-4 calibrations per day. To calibrate, patients
take a fingerstick and enter the blood glucose level from the meter into the sensor to tell the
sensor what the meter says. The sensor then uses this information as its own baseline. Calibration
can be affected by lag-time, user accuracy, and inherent imprecision of glucose meters. If
calibration is done while glycemia is fluctuating, the blood and interstitial glucose concentrations
do not correlate. An individual’s motivation to calibrate correctly also affects CGM accuracy.
People sometimes also become “calibration-happy” in which they over-calibrate. When this
happens, the patient is telling the sensor one thing when the sensor may be detecting another,
which can lead to sensor miscalculations and inaccuracy. There is also some inherent imprecision
of the capillary blood glucose meters used in calibration.
How does hyperglycemia contribute to oxidative stress?
What is C-reactive protein?
C-reactive protein (CRP) is a protein in the pentraxin family, a group of proteins recognized for their pentagonal structure and which serve immunological roles.56 CRP is synthesized by the liver and adipose tissue and is secreted in response to inflammation. It is a non-specific protein57,58, meaning that its concentration will rise with any sort of acute or chronic inflammation. For this reason CRP is not diagnostic of any specific disease but rather serves solely as an index of acute inflammation or an inflammatory disease occurring in the body. CRP levels as predictors of CV risk are generally defined as follows:59
Normal: CRP <1.00 mg/L
Moderate Risk for CVD: CRP 1.00-3.00 mg/L High Risk for CVD: CRP>3.00 mg/L
Inflammation and cardiovascular complications
Mechanism by which inflammation leads to CRP elevation
The acute inflammatory response (for example, during infection) stimulates the release of cytokines such as interleukin-6 (IL-6). These cytokines stimulate the liver to synthesize and secrete CRP. CRP binds to phosphocholine, a molecule that is expressed on the outside of damaged cells. This binding activates the complement system, which induces phagocytosis by macrophages. In this way, CRP serves to help remove necrotic cells. CRP concentration may rise above normal within 2-6 hours of acute insult, and tend to peak at 48 hours. The half-life of CRP is approximately 19 hours.62
Studies supporting the association of hyperglycemia, GV, and oxidative stress
While more studies have been conducted showing the relationship between
hyperglycemia and oxidative stress, some studies have also shown the relationship between glycemic variability and oxidative stress. In a 2008 study, (Oscillating glucose is more
deleterious to endothelial function and oxidative stress than mean glucose in normal and type 2
diabetic patients) Ceriello et al. show in an RCT that oscillating glucose between 5 and 15
mmol/L intermittently over 24 hours resulted in significantly more endothelial dysfunction and oxidative stress compared with continuous glucose at either 10 or 15 mmol/L for 24 hours. The authors helped to establish the significance of studying glycemic variability in addition to
hyperglycemia as a cause of increased oxidative stress.63 A 2006 study by Monnier et al. showed MAGE, a measure of GV, correlated with urinary oxidative stress marker 8-iso-PGF2α
a review article on the subject of GV and oxidative stress in which he concludes that GV ought to be a target of treatment for patients with T2DM.65
Other studies have examined not just the relationship between GV and oxidative stress, but also the relationship between GV and cardiovascular complications. In one study, Flaviani et al. found a positive correlation between CONGA-2, a measure of GV, and 8-iso-PGF2α (r=0.57, p=.003). This oxidative stress marker was found to have an effect on left ventricular mass index (LVMI) (r=0.42,p=0.031). There was a significant correlation between GV and 8-iso-PGF2α, suggesting a possible connection between GV, increased activation of oxidative stress, and cardiovascular complications.66 In a 2009 article published in Diabetes/Metabolism Research and Reviews, researchers concluded that GV may play a role in the development of CVD.67 These studies have shown that there appears to be a correlation between GV and 8-iso-PGF2α. Furthermore, studies have also shown the association between 8-iso-PGF2α and cardiovascular complications.
In a 2004 matched case-control study, researchers found that 8-iso-PGF2α concentration was higher in patients with CHD (n=93) than in patients without (n=93) (8-iso-PGF2α range 120-193 pmol/mmol creatinine for cases compared to 77-139 pmol/mmol creatinine for controls, p<.001). Researchers concluded that 8-iso-PGF2α is an independent risk marker of CHD.68 8-iso-PGF2α was also found to correlate with CRP concentration, as shown in a 2006
Putting it all together
CHAPTER THREE MANUSCRIPT Abstract
Purpose:
The purpose of this study was to assess the potential association between glycemic variability (GV) as assessed by standard deviation (SD) of mean blood glucose based on continuous glucose monitoring (CGM) and C-reactive protein concentration (CRP) in adults with type 2 diabetes mellitus.
Methods:
Results:
Mean CRP level was 5.81 (SD, 6.05) mg/L. Mean GV was 50.47 (15.46) mg/dL (n=38). There was no correlation between GV and CRP (r= -.045, NS) after linear regression and correlation analysis in the total cohort. There was still no association after adjusting for confounding variables (p=0.47, NS).
Conclusion:
Introduction
Research has shown associations between hyperglycemia and cardiovascular disease (CVD), hyperglycemia and CRP, and GV and CVD. However, little research has been conducted regarding whether there is an association between GV and CRP (Figure 1).
The purpose of this study was to examine the association between glycemic variability and CRP concentration in patients with type 2 diabetes. Studies have shown that sustained hyperglycemia contributes to increased oxidative stress.75 Whether GV, too, leads to increased oxidative stress and ultimately heart disease is a topic of current research. The purpose of this paper is to examine the effects of GV on risk of heart disease as measured by CRP.
It is hypothesized that there will be a positive correlation between glycemic variability and the cardiovascular risk marker, C-reactive protein. While causality cannot be established (that is, that glycemic variability itself causes elevation of CRP concentration) in this analysis, it is theoretically feasible that glycemic variability increases oxidative stress, which leads to endothelial dysfunction and inflammation, which in turn could increase CRP.
Materials and Methods Study Objective
drug, in conjunction with insulin, would aid both glycemic control and weight loss (or reducing weight gain) in patients with T2DM that take >100 units of insulin per day.
Sample
This study population included patients recruited for the trial at the Mountain Diabetes and Endocrine Center in Asheville, North Carolina. Per study protocol, all subjects had been diagnosed with T2DM for at least twelve months (mean duration of disease, 17 (7) years). Study subjects had HbA1c values 6.5-9% with mean A1c= 7.9%. The study population included both genders; most (95.2%) were white. Study subjects were all treated with intensive basal/bolus insulin regimens with or without additional oral or injectable glucose-lowering agents.
Study Criteria
Inclusion criteria were: age between 18-80, presence of T2DM >1 year, on intensive (basal/bolus) insulin therapy and taking >100 units/day. Exclusion criteria were: pregnancy, history of pancreatitis, thyroid cancer, or Multiple Endocrine Neoplasia (MEN) syndrome, recent (within previous six months) serious chronic illness, a recent acute coronary event, or recent significant use of glucocorticoids (>2 week usage in the previous 3 months). Patients were instructed to be fasting at baseline.
Blood Sampling
panel of 14 blood tests that broadly measure kidney and liver function as well as electrolyte and fluid balance.76 CRP concentration was measured by immunochemiluminometric assay (ICMA).
Continuous Glucose Monitor (CGM)
The CGM that was used for this study was the Medtronic iPro CGM (Northridge, CA). The iPro CGM sensor was inserted subcutaneously on the abdomen and the device was worn on three separate occasions for 72 hours at a time. The iPro measured glucose concentration at five minute intervals during the 72 hours, although patients were blinded to the CGM readings. The device was removed 72 hours later and uploaded to obtain the patient’s glucose profile. The CGM download listed number of sensor values, average daily and 3-day blood glucose values, minimum and maximum glucose values, SD, number of meter values, average meter value, minimum/maximum meter values, optimal accuracy criteria including number of paired readings, mean absolute difference (MAD%), correlation coefficient, number of high and low excursions, duration above, within, and below limits, pie charts for each duration, glucose area above and below limit, and average blood glucose value per each time period. The SD of the baseline CGM downloads were obtained and used as the measure of GV in this analysis. Subjects’ data were excluded in the case of missing or incomplete information such as a patient not wearing the CGM for 72 hours.
Statistical Analysis
log-transformed due to a highly skewed distribution. Assumptions of the linear regression were examined to see if they were violated, including the linearity of the relationship between exposure (glycemic variability) and outcome (Log transformed CRP), homoscedasticity of the errors, and normality of the error distribution. Assumptions were met for all linear models. We conducted a formal test of interaction to measure for effect measure modification (EMM), choosing p <0.2 as a cut point for an effect measure modifier. We also adjusted for potential confounders such as age, A1c, BMI, aspirin, and % bolus to basal. After obtaining baseline characteristics (tables 1 and 2), the unadjusted association of CRP with GV was evaluated (table 3). We then adjusted for age and gender (table 4), then further adjusted for A1c and BMI (table 5), then further adjusted for statin use, aspirin use, and % bolus to basal (table 6).
Stratification analyses were also conducted (table 7). A p value < 0.05 determined statistical significance.
Results
After testing for EMM, gender and statin use were found to be effect measure modifiers (p-values = 0.1934 and 0.0829, respectively). We then calculated stratum-specific estimates. However, the results were not biologically plausible likely due to small sample size or unmeasured confounding. It was found that with every 1 unit increase in SDT in males, there is a 1.02 unit increase in CRP levels, and with every 1 unit increase in SDT in females, there is a 12.28 unit increase in CRP levels. Among those not using statins, with every 1 unit increase in SDT, there is a 0.98 unit decrease in CRP levels, and among those using statins with every 1 unit increase in SDT, there is a 0.099 unit decrease in CRP levels. These results are not biologically plausible and for this reason gender and statin use were used as confounding variables, as discarding the variables in the model is not rational due to their potential association with exposure and outcome.
Mean CRP value was 5.81(6.05) mg/L (n=39). Mean GV was 50.47 (15.46) mg/dL (n=38). In the total cohort, there was no correlation between GV and CRP after linear regression and correlation analysis (r= -.045, NS).
Table 7 shows mean CRP according to tertiles of CRP and tertiles of GV, and Table 8 shows mean GV according to tertiles of CRP and tertiles of GV. Linear regression output models for crude data showed no association between GV and CRP in the total cohort (p=0.7870, NS) (Table 3). Association remained non-significant after adjusting for confounding variables (Tables 4-6).
Discussion
It may be that CRP is too non-specific to correlate with GV. It is possible that other inflammatory markers may correlate more closely with GV and less with other inflammatory conditions occurring in older adults. A marker more specific to endothelial inflammation and oxidative stress, such as 8-iso-PGF2α, may have proven a better correlate with GV than CRP in this patient population. Another potential explanation for the lack of correlation between GV and CRP in this study may be the measurement of GV. SD was used to calculate GV; it is possible that another measure of GV such as MAGE may have proven to be a better correlate with GV. MAGE accounts for major fluctuations in glucose levels that are greater than 1 SD and does not account for minor fluctuations; thus MAGE may have yielded a better correlation with CRP than did SD by only incorporating major, ie, clinically significant, glucose fluctuations. The CGM data that were obtained for this study did not include MAGE values and so for this reason MAGE was not used in data analysis. However, it has been shown that there is a strong correlation between MAGE and SD (r=0.89),77 so it is unclear whether using MAGE would actually have yielded significantly different results from SD.
differed in that ours was a more obese, insulin-using American population with more comorbidities.
Two important limitations relate to the patients’ fasting status and duration of diabetes. Although patients were instructed to be fasting at baseline, fewer than half actually were. Although fasting status was controlled for, it may be that some other behavioral factors related to patients’ non-fasting status confound the association between GV and CRP. Regarding duration of diabetes, this factor may be associated with both inflammation and glycemic control and as such may be a confounder. However, although all patients had diabetes duration >1 year, exact duration was not available so adjustment for potential confounding was not possible.
This study also had a very limited sample size. Accuracy increases with increasing sample size, and it may be that our sample size was too small to appropriately assess whether
there is a correlation between CRP and GV in patients with T2DM. It is also sometimes thought
that studies conducted by a single center are subjected to the same biases.
We also only had 3 days’ worth of CGM data. These particular 3 days for patients may
have been an ‘off’ three days as they may have been specifically eating more appropriately now
that they had put on CGM devices. It may be that this variability did not adequately represent
what patients normally eat on a daily basis and that the variability is not an accurate value
compared to what it would normally be. It may have been more accurate to use CGM and CRP
data from towards the end of the study when patients would likely either have permanently
changed their eating habits or resorted back to old ones so that the GV measure more accurately
represents the norm for these patients.
This cohort comprised a chronically ill obese study population with many inflammatory comorbidities including but not limited to periodontal disease, arthritis, infection, and occult malignancy. These conditions may have been more powerful contributors to CRP concentration than GV, precluding the ability to accurately define any relationship between CRP and GV.
Implications
CRP measures CVD risk in individuals regardless of other chronic illnesses, however patients with T2DM tend to have higher basal levels of CRP than individuals without T2DM.84,85 Although CRP and GV are both considered to be independent markers for cardiovascular risk in patients with T2DM, there was no correlation between the two even when controlling for other variables (gender, A1c, statin use, concomitant medications, BMI, age). This suggests that CRP may be affected by other concomitant inflammatory conditions besides glycemic variability in this high-risk population. Because this population is frequently affected by such inflammatory conditions as arthritis, periodontal disease, infections, as well as obesity itself, all of which may elevate CRP, it is possible that these inflammatory comorbidities may have had greater effects on CRP than glycemic parameters, including absolute magnitude of hyperglycemia (HbA1c) or the more subtle glucose fluctuations (GV). CRP therefore may be too non-specific for use as a marker of cardiovascular risk this patient population.
Table 1. GV and CRP by demographic characteristics
N GV*, mean
(SD)
P value CRP, mean (SD)
P value
Gender 0.2 0.04
Male 17 53.76 (17.50) 3.62 (3.57)
Female 25 47.81 (13.44) 7.51 (7.04)
Age 0.9 0.9
≤ 60 21 50.29 (13.83) 5.72 (7.80)
> 60 21 50.62 (17.00) 5.90 (4.23)
BMI 0.3 0.7
≤ 40 22 52.86 (16.44) 5.45 (7.46)
> 40 18 47.53 (14.08) 6.29 (3.65)
Fasting 0.4 0.5
No 26 48.46 (11.79) 5.14 (3.80)
Yes 15 53.54 (21.13) 6.41 (8.68)
A1c 0.9 0.2
≤ 7.8 24 50.22 (15.86) 4.83 (3.44)
> 7.8 18 50.87 (15.37) 7.23 (8.47)
Pump 0.9 0.3
No 22 50.71 (11.59) 6.60 (7.36)
Yes 15 50.07 (20.69) 4.53 (3.84)
Group 0.6 0.9
1 24 49.33 (15.11) 5.89 (7.28)
2 18 51.88 (16.23) 5.72 (4.15)
Statin 0.2 0.07
No 22 46.78 (10.88) 7.64 (7.74)
Yes 20 53.80 (18.30) 4.09 (3.16)
ASA 0.2 0.5
No 24 47.86 (14.40) 5.23 (3.68)
Yes 18 54.06 (16.60) 6.58 (8.25)
*GV is the standard deviation of the blood glucose readings from CGM (SDtotal). CRP units are mg/L and GV units are mg/dL.
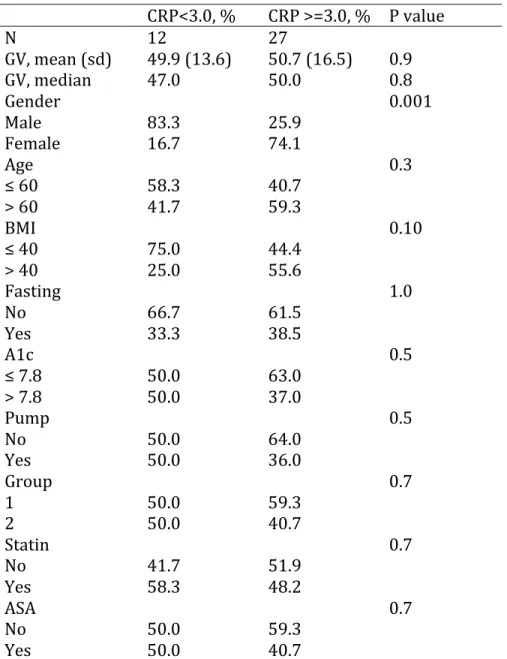
Table 2. GV and demographic and clinical characteristics by CRP value CRP<3.0, % CRP >=3.0, % P value
N 12 27
GV, mean (sd) 49.9 (13.6) 50.7 (16.5) 0.9 GV, median 47.0 50.0 0.8
Gender 0.001
Male 83.3 25.9
Female 16.7 74.1
Age 0.3
≤ 60 58.3 40.7 > 60 41.7 59.3
BMI 0.10
≤ 40 75.0 44.4 > 40 25.0 55.6
Fasting 1.0
No 66.7 61.5
Yes 33.3 38.5
A1c 0.5
≤ 7.8 50.0 63.0 > 7.8 50.0 37.0
Pump 0.5
No 50.0 64.0
Yes 50.0 36.0
Group 0.7
1 50.0 59.3
2 50.0 40.7
Statin 0.7
No 41.7 51.9
Yes 58.3 48.2
ASA 0.7
No 50.0 59.3
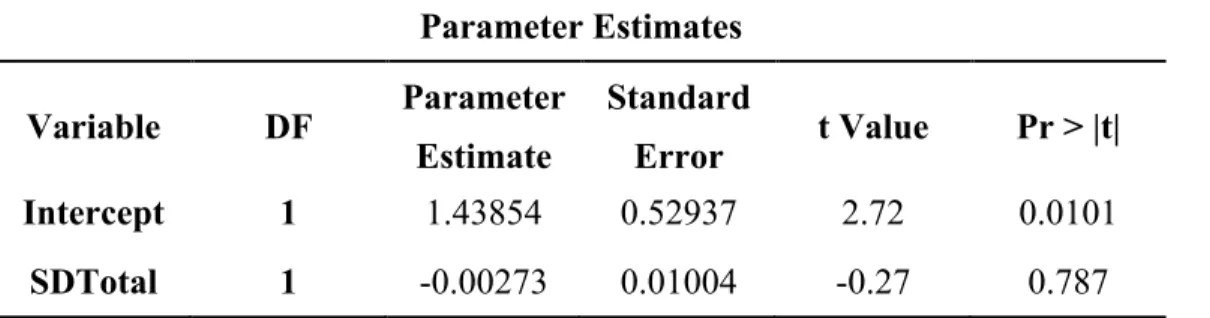
Table 3. Association between GV and CRP in total sample population (crude) Parameter Estimates
Variable Parameter Pr > |t| Estimate
Intercept 1.43854 0.0101 SDTotal -0.00273 0.787
*Interpretation: for every 1 unit increase in SDT there is a(n) e-.00273=0.997 unit increase in CRP
Table 4. Association between GV and CRP in total sample population, adjusting for age, gender, and fasting status
Parameter Estimates Variable Parameter Pr > |t|
Estimate
Intercept 0.37734 0.6655 SDTotal 0.0023 0.7993 Age 0.00378 0.7493 Gender 1.0239 0.0008 Fasting -0.09017 0.7589
Table 5. Association between GV and CRP in total sample population, adjusting for age, gender, fasting status, A1c, and BMI
Parameter Estimates
Variable Parameter Pr > |t| Estimate
Intercept -2.34442 0.3832 SDTotal 0.00577 0.5264 Age 0.00537 0.6834 Gender 1.06449 0.0006 Fasting -0.15735 0.6147
A1c 0.10505 0.664
BMI 0.03985 0.0767
Table 6. Association between GV and CRP in total sample population, adjusting for age, gender, fasting status, A1c, BMI, percentage of bolus to basal, statin use, and ASA use
Parameter Estimates
Variable Parameter Pr > |t| Estimate
Intercept -2.55102 0.4177
SDTotal 0.00769 0.4659
Age 0.00909 0.5972
Gender 0.94731 0.0099
Fasting -0.01781 0.9619
A1c 0.1023 0.7162
BMI 0.04256 0.0925
Percentage of Bolus to Basal
0.00135 0.8952
Statin -0.45951 0.1396
ASA -0.03927 0.9
*Interpretation: Holding all other variables constant, with every 1 unit increase in percentage of bolus to basal, there is a(n) e0.00135= 1.0014 unit increase in CRP, etc.
Table 7. Mean (SD) of CRP according to tertiles of CRP and tertiles of GV 1st tertile_GV 2nd tertile_GV 3rd tertile_GV 1st tertile_CRP 1.39 (1.31) 1.92 (0.91) 1.80 (0.97) 2nd tertile_CRP 4.43 (0.85) 4.73 (1.09) 4.05 (1.16) 3rd tertile_CRP 10.02 (4.24) 9.31 (2.35) 8.77 (3.47) Total_CRP 5.45 (4.08) 4.85 (3.73) 4.81 (3.49)
Table 8. Mean (SD) of GV according to tertiles of CRP and tertiles of GV
Figure 1. The Open Question of Whether Glycemic Variability is Associated with CRP
Figure 2. Mechanism by which Diabetes Mellitus Contributes to Atherogenesis44
Figure 3. Mechanism of Continuous Glucose Monitoring53
Figure 4. Components of a Continuous Glucose Monitoring System54
References
1 DCCT and EDIC: The Diabetes Control and Complications Trial and Follow-up Study. US Department of Health and Human Services website.
http://diabetes.niddk.nih.gov/dm/pubs/control/. Published May 2008. Updated November 2013. Accessed November 2013.
2 About Diabetes. World Health Organization website. http://www.who.int/diabetes/action_online/basics/en/index3.html. Accessed January 2014.
3 Monnier L, Colette C. Glycemic variability: should we and can we prevent it? Diabetes Care. 2008; 31(2): 150-4. Doi: 10.2337/dc08-s241.
4 Monnier L, Mas E, Ginet C et al. Activation of oxidative stress by acute glucose fluctuations compared with sustained chronic hyperglycemia in patients with type 2 diabetes. JAMA. 2006;
295(14): 1681-7.
5 Heitzer T, Schlinzig T, Krohn K, Meinertz T, Munzel T. Endothelial Dysfunction, Oxidative Stress, and Risk of Cardiovascular Events in Patients With Coronary Artery Disease.
Circulation. 2001; 104: 2673-8. Doi: 10.1161/hc4601.099485.
6 Pradhan AD, Manson JE, Rifai N, Buring JE, Ridker PM. C-Reactive Protein, Interleukin 6, and Risk of Developing Type 2 Diabetes Mellitus. JAMA. 2001; 286(3): 327-34. http://www.ncbi.nlm.nih.gov/pubmed/11466099.
7 About Diabetes. World Health Organization website. http://www.who.int/diabetes/action_online/basics/en/index3.html. Accessed January 2014.
8 Trence DL, Hirsch IB. Motherhood, Apple-Pie, HbA1c, and the DCCT. Endocr Pract. 2012; 18(1): 78-84. http://www.ncbi.nlm.nih.gov/pubmed/22336443.
9 Mi SH, Su G, Li Z et al. Comparison of glycemic variability and glycated hemoglobin as risk factors of coronary artery disease in patients with undiagnosed diabetes. Chin Med J (Engl). 2012; 125(1): 38-43. http://www.ncbi.nlm.nih.gov/pubmed/22340463.
10 Su G, Mi S, Tao H et al. Association of glycemic variability and the presence and severity of coronary artery disease in patients with type 2 diabetes. Cardiovasc Diabetol. 2011 Feb
25;10:19. doi: 10.1186/1475-2840-10-19.
11 Su G, Mi S, Tao H et al. Association of glycemic variability and the presence and severity of coronary artery disease in patients with type 2 diabetes. Cardiovasc Diabetol. 2011 Feb
12 Am I at risk for type 2 diabetes? US Department of Health and Human Services website. http://diabetes.niddk.nih.gov/dm/pubs/riskfortype2/. Published June 2012. Updated March 2014. Accessed March 2014.
13 National Diabetes Statistics, 2011. US Department of Health and Human Services website. http://diabetes.niddk.nih.gov/dm/pubs/statistics/#Estimation. Published February 2011. Updated September 2013. Accessed March 2014.
14 Diabetes. World Heart Federation website.
http://www.world-heart-federation.org/cardiovascular-health/cardiovascular-disease-risk-factors/diabetes/. Published 2014. Accessed March 2014.
15 Ibid. 16 Ibid.
17 Pearson T, Mensah G, Alexander R, et al. Markers of Inflammation and Cardiovascular Disease. Circulation. 2003; 107: 499-511. Doi: 10.1161/01.CIR.0000052939.59093.45 18 Ibid.
19 The Cost of Diabetes. American Diabetes Association website. http://www.diabetes.org/advocate/resources/cost-of-diabetes.html. Accessed March 2014.
20 Ibid.
21 National Diabetes Statistics, 2011. US Department of Health and Human Services website. http://diabetes.niddk.nih.gov/dm/pubs/statistics/#Estimation. Published February 2011. Updated September 2013. Accessed March 2014.
22Insulin Action, Insulin Resistance, and Type 2 Diabetes Mellitus. OMMBID website. http://www.ommbid.com/OMMBID/the_online_metabolic_and_molecular_bases_of_inherited_ disease/b/abstract/part7/ch68. Accessed March 2014.
23 Kahn SE, Hull RL, Utzschneider KM. Mechanisms linking obesity to insulin resistance and
type 2 diabetes. Nature. 2006; 444(7121):840-6.
http://www.ncbi.nlm.nih.gov/pubmed/17167471.
24 National Diabetes Statistics, 2011. US Department of Health and Human Services website. http://diabetes.niddk.nih.gov/dm/pubs/statistics/#Estimation. Published February 2011. Updated September 2013. Accessed March 2014.
25 About Diabetes. World Health Organization website.
26 Ceriello A, Esposito K, Piconi L, Ihnat MA, Thorpe JE, Testa R, Boemi M, Giugliano D.
Oscillating glucose is more deleterious to endothelial funcion and oxidative stress than mean
glucose in normal and type 2 diabetic patients. Diabetes. 2008; 57(5): 1349-54. Doi: 10.2337/db08-0063.
27 Di Flaviani A, Picconi F, Di Stefano P et al. Impact of glycemic and blood pressure viability on surrogate measures of cardiovascular outcomes in type 2 diabetic patients. Diabetes Care. 2011; 34(7): 1605-9. Doi: 10.2337/dc11-0034.
28 Monnier L, Mas E, Ginet C et al. Activation of oxidative stress by acute glucose fluctuations compared with sustained chronic hyperglycemia in patients with type 2 diabetes. JAMA. 2006; 295(14): 1681-7.
29 Monnier L, Colette C. Glycemic variability: should we and can we prevent it? Diabetes Care. 2008; 31(2): 150-4. Doi: 10.2337/dc08-s241.
30 Zaccardi F, Pitocco D, Ghirlanda G. Glycemic risk factors of diabetic vascular complications: the role of glycemic variability. Diabetes Metab Res Rev. 2009; 25(3): 199-207. Doi:
10.1002/dmrr.938.
31 Singh N, Dhalla AK, Seneviratne C, Singal PK. Oxidative Stress and Heart Failure. Mol Cell Biochem. 1995; 147(1-2): 77-81. http://www.ncbi.nlm.nih.gov/pubmed/7494558.
32 Rodbard D. Interpretation of continuous glucose monitoring data: glycemic variability and quality of glycemic control. Diabetes Technol Ther. 2009; 11(1): 55-67. Doi:
10.1089/dia.2008.0132.
33 Ibid.
34 Heart Disease Facts. Centers for Disease Control and Prevention website. http://www.cdc.gov/heartdisease/facts.htm. Updated February 2014. Accessed March 2014.
35 Ibid.
36 Cardiovascular Disease and Diabetes. American Heart Association website.
http://www.heart.org/HEARTORG/Conditions/Diabetes/WhyDiabetesMatters/Cardiovascular-Disease-Diabetes_UCM_313865_Article.jsp. Updated January 2013. Accessed March 2014.
37 National Diabetes Statistics, 2011. US Department of Health and Human Services website. http://diabetes.niddk.nih.gov/dm/pubs/statistics/#Estimation. Published February 2011. Updated September 2013. Accessed March 2014.
39 Di Flaviani A, Picconi F, Di Stefano P et al. Impact of glycemic and blood pressure viability on surrogate measures of cardiovascular outcomes in type 2 diabetic patients. Diabetes Care. 2011; 34(7): 1605-9. Doi: 10.2337/dc11-0034.
40 DCCT and EDIC: The Diabetes Control and Complications Trial and Follow-up Study. US Department of Health and Human Services website.
http://diabetes.niddk.nih.gov/dm/pubs/control/. Published May 2008. Updated November 2013. Accessed November 2013.
41 Monnier L, Mas E, Ginet C et al. Activation of oxidative stress by acute glucose fluctuations compared with sustained chronic hyperglycemia in patients with type 2 diabetes. JAMA. 2006; 295(14): 1681-7.
42 Ceriello A, Esposito K, Piconi L, Ihnat MA, Thorpe JE, Testa R, Boemi M, Giugliano D.
Oscillating glucose is more deleterious to endothelial funcion and oxidative stress than mean
glucose in normal and type 2 diabetic patients. Diabetes. 2008; 57(5): 1349-54. Doi: 10.2337/db08-0063.
43 Trence DL, Hirsch IB. Motherhood, Apple-Pie, HbA1c, and the DCCT. Endocr Pract. 2012; 18(1): 78-84. http://www.ncbi.nlm.nih.gov/pubmed/22336443.
44 Beckman J, Creager M, Libby P. Diabetes and Atherosclerosis. JAMA. 2002; 287(19): 2570-81. Doi: 10.1001/jama.287.19.2570.
45 Monnier L, Colette C. Glycemic variability: should we and can we prevent it? Diabetes Care. 2008; 31(2): 150-4. Doi: 10.2337/dc08-s241.
46 Singh N, Dhalla AK, Seneviratne C, Singal PK. Oxidative Stress and Heart Failure. Mol Cell Biochem. 1995; 147(1-2): 77-81. http://www.ncbi.nlm.nih.gov/pubmed/7494558.
47 Monnier L, Colette C. Glycemic variability: should we and can we prevent it? Diabetes Care. 2008; 31(2): 150-4. Doi: 10.2337/dc08-s241.
48 Beckman J, Creager M, Libby P. Diabetes and Atherosclerosis. JAMA. 2002; 287(19): 2570-81. Doi: 10.1001/jama.287.19.2570.
49 Rodbard D. Interpretation of continuous glucose monitoring data: glycemic variability and quality of glycemic control. Diabetes Technol Ther. 2009; 11(1): 55-67. Doi:
10.1089/dia.2008.0132.
50 Ibid.
52 Girardin CM, Huot C, Gonthier M, Delvin E. Continuous glucose monitoring: a review of biochemical perspectives and clinical use in type 1 diabetes. Clin Biochem. 2009; 42(3): 136-42. Doi: 10.1016/j.clinbiochem.2008.09.112.
53 Continuous Glucose Monitoring. Medtronic CGMS website.
http://www.hospitalcgm.com/wcm/groups/mdtcom_sg/@mdt/@diabetes/documents/images/cont rib_146521.pdf. Accessed April 8, 2014.
54 iPro2 Professional CGM. Medtronic website. http://www.medtronic-‐diabetes.co.uk/product-‐ information/ipro-‐2.html. Published 2008. Accessed April 4, 2014.
55 Zaccardi F, Pitocco D, Ghirlanda G. Glycemic risk factors of diabetic vascular complications: the role of glycemic variability. Diabetes Metab Res Rev. 2009; 25(3): 199-207. Doi:
10.1002/dmrr.938.
56 Agrawal A, Singh PP, Bottazzi B, Garlanda C, Mantovani A. Pattern recognition by
pentraxins. Adv Exp Med Biol. 2009; 653:98-116.
http://www.ncbi.nlm.nih.gov/pubmed/19799114.
57 Pepys M, Hirschfield G. C-reactive protein: a critical update. J Clin Invest. 2003; 111(12): 1805-12. Doi: 10.1172/JCI18921.
58 C-reactive protein. Medline Plus website.
http://www.nlm.nih.gov/medlineplus/ency/article/003356.htm. Updated February 2013. Accessed March 2014.
59 Wong N, Malik S. C-reactive protein for cardiovascular risk assessment in the metabolic syndrome. Diabetes Care. 2005; 28(10): 2598-99. Doi: 10.2337/diacare.28.10.2598.
60 Inflammation and Heart Disease. American Heart Association website.
https://www.heart.org/HEARTORG/Conditions/Inflammation-and-Heart-Disease_UCM_432150_Article.jsp. Updated September 2013. Accessed March 2014.
61 Beckman J, Creager M, Libby P. Diabetes and Atherosclerosis. JAMA. 2002; 287(19): 2570-81. Doi: 10.1001/jama.287.19.2570.
62 Pepys M, Hirschfield G. C-reactive protein: a critical update. J Clin Invest. 2003; 111(12): 1805-12. Doi: 10.1172/JCI18921.
63 Ceriello A, Esposito K, Piconi L, Ihnat MA, Thorpe JE, Testa R, Boemi M, Giugliano D. Oscillating glucose is more deleterious to endothelial funcion and oxidative stress than mean glucose in normal and type 2 diabetic patients. Diabetes. 2008; 57(5): 1349-54. Doi:
64 Monnier L, Mas E, Ginet C et al. Activation of oxidative stress by acute glucose fluctuations compared with sustained chronic hyperglycemia in patients with type 2 diabetes. JAMA. 2006;
295(14): 1681-7.
65 Monnier L, Colette C. Glycemic variability: should we and can we prevent it? Diabetes Care. 2008; 31(2): 150-4. Doi: 10.2337/dc08-s241.
66 Di Flaviani A, Picconi F, Di Stefano P et al. Impact of glycemic and blood pressure viability on surrogate measures of cardiovascular outcomes in type 2 diabetic patients. Diabetes Care. 2011; 34(7): 1605-9. Doi: 10.2337/dc11-0034.
67 Zaccardi F, Pitocco D, Ghirlanda G. Glycemic risk factors of diabetic vascular complications: the role of glycemic variability. Diabetes Metab Res Rev. 2009; 25(3): 199-207. Doi:
10.1002/dmrr.938.
68 Schwedhelm E, Bartling A, Lenzen H et al. Urinary 8-iso-prostaglandin F2alpha as a risk marker in patients with coronary heart disease: a matched case-control study. Circulation. 2004; 109(7): 843-8. http://www.ncbi.nlm.nih.gov/pubmed/14757688.
69 Cottone S, Palermo A, Vaccaro F et al. In renal transplanted patients inflammation and oxidative stress are interrelated. 2006; 38(4): 1026-30.
http://www.ncbi.nlm.nih.gov/pubmed/16757253.
70 Pfutzner A, Forst T. High-sensitivity C-reactive protein as cardiovascular risk marker in patients with diabetes mellitus. Diabetes Technol Ther. 2006; 8(1): 28-36.
http://www.ncbi.nlm.nih.gov/pubmed/16472048.
71Su G, Mi S, Tao H et al. Association of glycemic variability and the presence and severity of
coronary artery disease in patients with type 2 diabetes. Cardiovasc Diabetol. 2011 Feb 25;10:19. doi: 10.1186/1475-2840-10-19.
72 Mi SH, Su G, Li Z et al. Comparison of glycemic variability and glycated hemoglobin as risk factors of coronary artery disease in patients with undiagnosed diabetes. Chin Med J. 2012; 125(1): 38-43.
http://www.cmj.org/ch/reader/view_abstract.aspx?file_no=20121541093900&flag=1.
73 Zhang X, Xu X, Jiao X, Wu J, Zhou S, Lv X. The effects of glucose fluctuation on the severity of coronary artery disease in type 2 diabetes mellitus. J Diabetes Res. 2013; 2013. Doi:
10.1155/2013/576916.
74 Danesh J, Wheeler JG, Hirschfield GM et al. C-Reactive Protein and Other Circulating
Markers of Inflammation in the Prediction of Coronary Heart Disease. N Engl J Med. 2004;
75 Fiorentino TV, Prioletta A, Zuo P, Folli F. Hyperglycemia-induced oxidative stress and its role in diabetes mellitus related cardiovascular diseases. Curr Pharm Des. 2013; 19(32): 5695-703.
http://www.ncbi.nlm.nih.gov/pubmed/?otool=uncchlib&term=23448484.
76 Comprehensive Metabolic Panel. Medline Plus website.
http://www.nlm.nih.gov/medlineplus/ency/article/003468.htm. Updated February 2014. Accessed March 2014.
77 Rodbard D. New and improved methods to characterize glycemic variability using continuous glucose monitoring. Diabetes Technol Ther. 2009; 11(9): 551-65. Doi: 10.1089/dia.2009.0015. 78 Obesity Information. American Heart Association website.
http://www.heart.org/HEARTORG/GettingHealthy/WeightManagement/Obesity/Obesity-Information_UCM_307908_Article.jsp. Updated February 2014. Accessed March 2014. 79 Yudkin JS, Stehouwer CD, Emeis JJ, Coppack SW. C-reactive protein in healthy subjects: associations with obesity, insulin resistance, and endothelial dysfunction: a potential role for cytokines originating from adipose tissue? Arterioscler Thromb Vasc Biol. 1999; 19(4): 972-8. http://www.ncbi.nlm.nih.gov/pubmed/10195925
80 Aronson D, Bartha P, Zinder O et al. Obesity is the major determinant of elevated C-reactive protein in subjects with the metabolic syndrome. Int J Obes Relat Metab Disord. 2004; 28(5): 674-9. http://www.nature.com/ijo/journal/v28/n5/full/0802609a.html.
81 Visser M, Bouter L, McQuillan G, Wener M, Harris T. Elevated C-reactive protein levels in overweight and obese adults. JAMA. 1999; 282(22): 2131-5. Doi: 10.1001/jama.282.22.2131.
82Su G, Mi S, Tao H et al. Association of glycemic variability and the presence and severity of
coronary artery disease in patients with type 2 diabetes. Cardiovasc Diabetol. 2011 Feb
25;10:19. doi: 10.1186/1475-2840-10-19.
83 Fiorentino TV, Prioletta A, Zuo P, Folli F. Hyperglycemia-induced oxidative stress and its role in diabetes mellitus related cardiovascular diseases. Curr Pharm Des. 2013; 19(32): 5695-703.
http://www.ncbi.nlm.nih.gov/pubmed/?otool=uncchlib&term=23448484.
84 Zhang X, Xu X, Jiao X, Wu J, Zhou S, Lv X. The effects of glucose fluctuation on the severity of coronary artery disease in type 2 diabetes mellitus. J Diabetes Res. 2013; 2013. Doi:
10.1155/2013/576916.
85 Mugabo Y, Li L, Renier G. The connection between C-reactive protein (CRP) and diabetic vasculopathy. Focus on preclinical findings. Curr Diabetes Rev. 2010; 6(1): 27-34.
86 Su G, Mi S, Tao H et al. Association of glycemic variability and the presence and severity of coronary artery disease in patients with type 2 diabetes. Cardiovasc Diabetol. 2011 Feb
25;10:19. doi: 10.1186/1475-2840-10-19.
87 Mi SH, Su G, Li Z et al. Comparison of glycemic variability and glycated hemoglobin as risk factors of coronary artery disease in patients with undiagnosed diabetes. Chin Med J. 2012;
125(1): 38-43.
APPENDIX
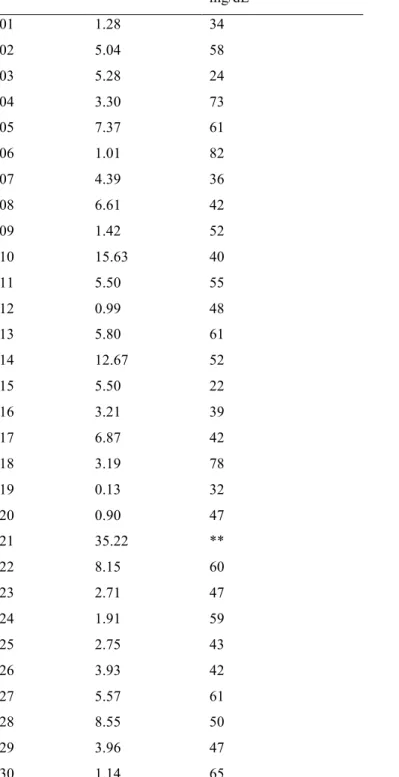
Table 9. CRP and glycemic variability of 39 patients included in correlation analysis Patient ID CRP, mg/L Glycemic Variability*,
mg/dL
01 1.28 34
02 5.04 58
03 5.28 24
04 3.30 73
05 7.37 61
06 1.01 82
07 4.39 36
08 6.61 42
09 1.42 52
10 15.63 40
11 5.50 55
12 0.99 48
13 5.80 61
14 12.67 52
15 5.50 22
16 3.21 39
17 6.87 42
18 3.19 78
19 0.13 32
20 0.90 47
21 35.22 **
22 8.15 60
23 2.71 47
24 1.91 59
25 2.75 43
26 3.93 42
27 5.57 61
28 8.55 50
29 3.96 47
31 3.16 56
32 8.84 50
33 2.78 44
34 2.70 46
35 10.96 24
36 13.77 59
37 3.13 95
38 7.19 49
39 4.27 43
Table 10. Full model showing association between GV and CRP in total sample population (crude)
Parameter Estimates
Variable DF Parameter Standard t Value Pr > |t| Estimate Error
Intercept 1 1.43854 0.52937 2.72 0.0101
SDTotal 1 -0.00273 0.01004 -0.27 0.787
*Interpretation: for every 1 unit increase in SDT there is a(n) e-.00273=0.997 unit increase in CRP
Table 11. Full model showing association between GV and CRP in total sample population, adjusting for age, gender, and fasting status
Parameter Estimates
Variable DF Parameter Standard t Value Pr > |t| Estimate Error
Intercept 1 0.37734 0.86483 0.44 0.6655
SDTotal 1 0.0023 0.00895 0.26 0.7993
Age 1 0.00378 0.01171 0.32 0.7493
Gender 1 1.0239 0.27526 3.72 0.0008
Fasting 1 -0.09017 0.29126 -0.31 0.7589
Table 12. Full model showing association between GV and CRP in total sample population, adjusting for age, gender, fasting status, A1c, and BMI
Parameter Estimates
Variable DF Parameter Standard t Value Pr > |t| Estimate Error
Intercept 1 -2.34442 2.649 -0.89 0.3832
SDTotal 1 0.00577 0.009 0.64 0.5264
Age 1 0.00537 0.01303 0.41 0.6834
Gender 1 1.06449 0.27763 3.83 0.0006
Fasting 1 -0.15735 0.30931 -0.51 0.6147
A1c 1 0.10505 0.23942 0.44 0.664
BMI 1 0.03985 0.02174 1.83 0.0767
Table 13. Full model showing association between GV and CRP in total sample population, adjusting for age, gender, fasting status, A1c, BMI, percentage of bolus to basal, statin use, and ASA use
Parameter Estimates
Variable DF Parameter Standard t Value Pr > |t| Estimate Error
Intercept 1 -2.55102 3.09562 -0.82 0.4177
SDTotal 1 0.00769 0.01038 0.74 0.4659
Age 1 0.00909 0.01699 0.54 0.5972
Gender 1 0.94731 0.33952 2.79 0.0099
Fasting 1 -0.01781 0.36889 -0.05 0.9619
A1c 1 0.1023 0.27823 0.37 0.7162
BMI 1 0.04256 0.02433 1.75 0.0925
Percentage of Bolus to Basal
1 0.00135 0.01013 0.13 0.8952
Statin 1 -0.45951 0.30115 -1.53 0.1396
ASA 1 -0.03927 0.36705 -0.11 0.9