By
Carey Campbell
A Master's Paper submitted to the faculty of the University of North Carolina at Chapel Hill
In partial fulfillment of the requirements for the degree of Master of Public Health in
the Public Health Leadership Program.
Chapel Hill
2005
ABSTRACT
PURPOSE: To investigate the association between physical activity and depressive symptoms in a community-based nationally representative sample of U.S. adolescents, and whether this association differs by race/ethnicity.
METHODS: Data for this study derives from the Wave I public-use dataset of the National Longitudinal Study of Adolescent Health (Add Health), a longitudinal, nationally representative, school-based study of U.S. adolescents in grades 7 to 12 from 1994 to 1996. Adolescents listed on participating school rosters in 1994 and 1995 were eligible to participate. Participants (n=6504) completed an in-home questionnaire on health-related topics including general health, physical activity, tobacco/alcohol use, sexuality, and peer inftuences. Physical activity was measured by standard 7 -day recall methods, asking respondents how often they had participated in moderate to vigorous activity within the past week. Participants were categorized as reporting "High" or "Low" levels of weekly activity. An item measuring weekly physical education participation was also included. Depressive symptoms were measured using a modified form of the 20-item Center for Epidemiological Studies-Depression (CES-D) Scale. To measure suicidal ideation and attempt, students were asked if they had ever thought about/attempted suicide over the past year. To measure racial/ethnic identity, participants were
categorized as non-Hispanic White, non-Hispanic Black, Hispanic, or "Other" based on self-report.
RESULTS: Among adolescent males, neither weekly moderate to vigorous activity nor PE participation was significantly associated with CES-D score (Weekly PA level: coeff=-0.74, p=0.087; Weekly PE: coeff=0.24, p=0.245). This lack of an association did not differ by racial/ethnic group. Adolescent males who reported "High" weekly activity were 50% less likely to report suicidal ideation in the past year than those males reporting "Low" weekly PA (OR: 0.53 [95% Cl: 0.37-0.75], p<0.001). This inverse association between physical activity and suicidal ideation only persisted among non-Hispanic White males in race-stratified analysis (OR: 0.46 [95% Cl: 0.31-0.69], p<0.001). Among adolescent females, there was not an overall significant association between CES-D score and weekly activity (p=0.217), but there was for weekly PE participation (coeff: 0.52, p=0.045). In the race-stratified analysis, females classified as "Other" who reported "High" weekly activity were less likely to report depressive symptoms than those reporting "Low" weekly activity (p=0.005). On average, their CES-D scores were three points lower than those reporting "Low" weekly activity. Overall, adolescent females reporting "Low" weekly activity levels and PE participation were no more likely to report suicidal ideation or attempt over the past year than adolescent females reporting "High" weekly activity levels and PE participation. Among non-Hispanic White females, weekly PE participation was associated with greater risk of suicidal ideation, with those reporting regular weekly PE more likely to report suicidal ideation over the past year than those reporting no weekly PE (OR: 1.31 [95% Cl: 1.06-1.60], p=0.011 ).
CONCLUSIONS: Through the available measures, it does not appear that PA and depressive symptoms are strongly associated among adolescents, and this association does not vary greatly by race/ethnicity. For those subgroups that demonstrated a significant association, such associations were not particularly large in magnitude, excluding that found for "Other" females. While policy efforts to increase physical activity among adolescents are well-founded on improvements in physical and cardiovascular health, these benefits may not extend to improvement of depressive symptoms given the results of the present study. Policy implications and directions for future research are discussed.
ADOLESCENT DEPRESSION: SCOPE OF THE PROBLEM
Population-based studies estimate the prevalence of major depressive
disorder (MOD) to be between 0.7 and 8.3 percent among adolescents (13 to 18
years oldY, with lifetime prevalence between 15 and 20 percentY·3 Point
prevalence of dysthymia, a milder form of depression, is estimated to be between
1.6 and 8.0 percent among adolescents.1•3 Similar to adults, adolescent females have a higher incidence of depressive symptoms and clinical depression when
compared to adolescent males.'·5•34 Current diagnostic criteria classify
adolescents as either depressed or not depressed depending on how many
criterion symptoms are demonstrated. Some researchers, however, argue that a
more appropriate view of depression in children and adolescents is that of a
continuum
of depressive symptoms from mild to severe with those demonstratingmoderate depressive symptoms at increased risk of poor health outcomes. 6 Several facets of physical health and psychosocial functioning have been
linked with MOD. Specifically, overweight/obesity, low socioeconomic status,
tobacco and alcohol abuse, illicit drug use, poor academic performance, and
history of childhood sexual abuse have all been shown to be significantly
associated with MOD in adolescents.'·7•8•9 In addition, studies have estimated that between 40 and 70 percent of clinically depressed adolescents have
comorbid psychiatric disorders including anxiety disorders, addictive, and/or
disruptive disorders at the time of diagnosis.1•2•3 In fact, it is postulated that
nearly 40 percent of cases of adolescent depression could be prevented if
primary psychiatric disorders are adequately identified and treated, regardless of
type2 Most importantly, MOD is associated with an increased risk of suicidal ideation and attempt, with suicide ranking as the third leading cause of death
among adolescents.10
Developing sub-threshold or clinical depression during adolescence
predicts poor psychosocial and mental health outcomes in adulthood.
Adolescents with sub-threshold depression or MOD share an equally heightened
risk of developing MOD or an anxiety disorder in adulthood.6•11 In addition, depressed adolescents demonstrate more social impairment in areas of work,
family, and social situations as adults.9 They also demonstrate significantly higher rates of suicidal ideation, attempt, and completion in adulthood.6•9
PHYSICAL ACTIVITY: PRIMARY PREVENTION OF DEPRESSION?
The debate regarding the (in)appropriate "medicalization of children's
happiness" has gained momentum in light of meta-analyses revealing
questionable efficacy of antidepressants in treating depressed adolescents.12•13•14 A meta-analysis by Hazell et al. (1995) demonstrated that adolescents treated
with tricyclic antidepressants were no more likely to experience symptomatic
improvement than those receiving placebo.13 Given that there are risks
associated with tricyclics use-the most serious of which are cardiotoxicity and
increased risk of suicide-endorsing tricyclic antidepressants as first-line therapy
for adolescent depression is not supported.15 Moreover, Whittington et al.
(2004) found that the majority of selective serotonin reuptake inhibitors had
equivocal or unfavorable risk-benefit profiles, with risks of serious adverse events
(e.g. abdominal pain, emotional lability, diarrhea, vomiting) and/or suicidal
ideation/attempt outweighing potential benefits from treatment.14 As a result, antidepressant use has decreased among adolescents.16
Furthermore, while cognitive behavioral therapy is considered an effective
treatment option for mild to moderate depressive disorder, this modality
demonstrates an efficacy rate of less than 65 percent among clinically depressed
adolescents.17 Due to the lack of effective treatment options, health providers have begun to focus not only on secondary prevention strategies for depressed
youth, but, more importantly, on primary prevention of depression. Ideally, such
a strategy would be safe, effective, and socially acceptable.
Physical activity (PA) may serve this role if shown both to be significantly
associated with depressive symptoms, and can prevent the onset and/or
recurrence of depression. While prevalence of adolescent depression has
continually increased, PA levels have decreased. Currently almost 50 percent of
American youth (aged 12-21 years) report no regular "vigorous" PA, defined as
activity that causes sweating and hard breathing for at least 20 minutes on at
least 3 days perweek.18 Lack of physical activity (e.g., physical education (PE)
and sports participation) and increased sedentary habits (e.g., TV/video viewing,
and computer use) are both associated with increased risk of childhood
overweight; however, less is known about the relationship between activity levels
and depression among adolescents.19
Several mechanisms have been proposed to provide a psychologically
and/or biologically plausible explanation for how PA may prevent the onset of
depression. Psychological theories deal with notions of social interaction,
mood. The social interaction hypothesis posits that exercise and/or physical
activity moderates perceived stress by increasing social support networks via
group-based activity (e.g., aerobics, team sports).28 To be sure, increased social support has been associated with both regular physical activity and decreased
risk for depression among both adults20 and adolescents.21· 22 The mastery theory suggests that increased self-efficacy via successful participation in
exercise elevates self esteem, which has been shown to be inversely related to
risk of depression.23 Finally, the distraction hypothesis proposes that negative
thoughts and cognitions are avoided through regular physical activity.28 To date, none of the psychological mechanisms have received overwhelming support
from the literature.
Physiological theories have also been proposed to explain the potential
pathway(s) by which physical activity moderates mood, focusing on the role of
monoamines, endorphins, and thermogenesis. The monoamine theory suggests
that PA moderates synaptic aminergic transmission in the brain to improve one's
mood, an idea that has received some support from past research.24•28 The
endorphin theory suggests that exercise-induced beta-endorphin release affects
positive mood states and attenuates pain perception; however most studies used
peripheral endorphin levels to approximate central levels, and it is uncertain how
valid these measurements are.25 The thermogenic model suggests that raised body temperature elevates mood following exercise, but this has been less
popular than the other theories described above.28 Of course, the extent to which these theories apply to decreasing an adolescent's risk for developing
depression is questionable given that much of the research concerning their
Regardless of how physical activity (PA) may affect and/or prevent
depressed mood on an individual level, there is reason to believe that the
association between PA and depressive symptoms differs by race/ethnicity.
Ethnic minority adolescents are less likely to report regular PA than their White
peers.19 The decision to be physically active is not wholly individually driven. A study by Gordon-Larsen et al. (2000) revealed that environmental factors (e.g.
community recreation programs/facilities, neighborhood crime levels) were
significant determinants of moderate to vigorous PA among adolescents.26 These factors are strongly related to family income level, with higher income
communities more likely to have a greater number of PA resources and less
neighborhood crime. Thus it is not surprising to find that these environmental
factors are distributed unequally across race/ethnic groups, with ethnic minority
adolescents more likely to live in conditions unfavorable to PA, as they are also
more likely to live in low income communities. This suggests that minority
adolescents may not have opportunities to experience the full benefit PA may
offer in preventing and/or ameliorating depressed mood.
The association between PA and depressive symptoms may differ by
race/ethnicity to the extent that there are also racial/ethnic differences by risk of
developing depression itself. Indeed, PA may not modify depressive symptoms if
other more pervasive influences exist that depress one's mood. For example,
the experience of discrimination by ethnic minorities may override whatever
benefit wrought from exercise. Theoretically, then, one would see higher
prevalence of depressive symptoms among racial/ethnic minorities than White
adolescents; however, previous research has been mixed regarding race/ethnic
differences in prevalence of depressive symptoms among a sample of 2224
Massachusetts ninth- and twelfth-graders. 34 Conversely, Saluja eta f. (2004) found depressive symptoms to be more prevalent among Native American and
Hispanic adolescents than their White peers, with African American and Asian
adolescents least likely to report depressive symptoms.' Given potential
differences in likelihood of being physically active, as well as in experiencing
depressive symptoms, there may also be racial/ethnic differences in the
association between PA and depressive symptoms.
Two literature reviews suggest that among adult populations (aged 25-64
years old), PA, defined as either aerobic and/or strength/resistance training, is
inversely related to depressive symptoms. In other words, an increase in PA was
associated with symptomatic improvement, particularly among those reporting
mild to moderate depressive symptoms.27·28 However, neither included studies that analyzed whether the apparent association between PA and depression
differed by race/ethnicity, nor looked at adolescents in particular. There is less
agreement in the literature regarding PA and depressive symptoms within
non-clinical adolescent populations, stemming mostly from poorly conducted studies
(see Appendix 1). Studies conducted within adolescent populations also did not
analyze potential association(s) by race/ethnicity.
THE NATIONAL LONGITUDINAL STUDY OF ADOLESCENT HEALTH
The purpose of this paper is to determine the association between
physical activity and depressive symptoms among a nationally representative
sample of U.S. adolescents using data from the National Longitudinal Study of
Adolescent Health {Add Health). In addition, I will explore whether this
+-association differs by race/ethnicity. This study improves on past research by
using data based on a large sample of adolescents, allowing for subgroup
analyses across sex, race, and socioeconomic status. As well, it uses extensive
measures of physical activity intensity and frequency, and provides measures of
depressive symptoms based on the Center of Epidemiological
Studies-Depression (CES-D) scale.
METHODS
Study procedures were approved by the Institutional Review Board at the
University of North Carolina at Chapel Hill, NC {IRB No. 05-2598).
Data Source. Add Health is a longitudinal, nationally representative,
school-based study of U.S. adolescents in grades 7 to 12 from 1994 to 1996. High
schools were stratified by size, urbanicity, region, race/ethnicity, and type (e.g.
public, private, or parochial). From this, high schools were selected with unequal
probability to create a nationally representative sample of U.S. high schools.
Each participating school was paired with an adjacent middle ("feeder'') school. If
a school declined participation, a replacement school or school pair was selected
from the same stratum. Ultimately 80 high schools and 52 middle schools (79%
overall participation) agreed to participate in the Add Health study.
Data for this study derives from in-home interviews conducted during
Wave I of the Add Health study (of three Waves to date). Adolescents listed on
participating school rosters in 1994 and 1995 were eligible to participate.
Approximately 220 students were selected from each paired school roster(s),
special groups were over-sampled to allow for subgroup analyses, including
race/ethnic groups (e.g. Black adolescents having at least one parent with a
college degree, labeled "high SES" African Americans) and disabled youth.
Overall, 27,000 adolescents were selected for the in-home interview, of which
20,745 (76.8%) agreed to participate.
The free, accessible public-use Wave I dataset was used for the
purposes of this study which is comprised of approximately one-half of the Wave
I core sample, and one-half of the over-sample of "high SES"
African-Americans.29 Wave I data was used rather than Wave II (which collected follow-up data on a subgrofollow-up of Wave I respondents) as Wave II consisted of a smaller
study population (N=14,738) than Wave I (N=20,745). Respondents were
randomly chosen for inclusion in the dataset, which was assumed to be
representative of the entire Wave I dataset. From this sample (N=6504),
i
respondents were excluded if they reported a physical disability, or had
incomplete data. Respondents who were 19 years or older were also excluded.
This age-based exclusion was included as these students may have unique
characteristics (e.g., failure to complete a grade, serious illness/disability) that
make them older compared to their peers, and thus make them different in terms
of likelihood to be depressed and/or active.
Interview Procedures. Wave I in-home interviews took place between April and December 1995. Individual and parental consent was obtained for each Wave I
in-home respondent. Interviews were conducted by trained interviewers using
Computer-Assisted Personal Interview (CAP I) and Audio Computer-Assisted
non-response or socially desirable non-responses on sensitive issues. 30 A parent of the
respondent also completed an in-home questionnaire. Of those parents who
completed surveys included in the public-use dataset, the majority were mothers
(92.8%).
Measures of Independent Variables
Respondent demographics. Demographics were obtained primarily via
self-report. Age was rounded to the nearest integer and kept as a continuous
variable. Sex was dichotomized as male (=0) or female (=1 ). Self-identified
race/ethnicity was coded as Hispanic (=1), Hispanic black (=2), or
non-Hispanic white (=4). An additional "Other" (=3) category was created to include
those who self-identified as Asian, Native American, multi-racial, or other. This
category was created to increase statistical power, as each respective
racial/ethnic group included in this category was too small for the purposes of this
study. Body mass index (BMI) was calculated from self-reported weight (in
kilograms) divided by self-reported height (in meters) squared, and maintained as
a continuous variable. Parental education was used as a proxy indicator for
socioeconomic status, determined from the parent's in-home questionnaire and
categorized as <high school (=0); some high school/trade (=1 ); some college
(=2); and college/professional degree (=3). Data regarding body image was
obtained since weight perception has been associated with depressive
symptoms and physical activity.31 One question was used to measure body image: "How do you think of yourself in terms of weight?" Body image responses
were categorized as very underweight; slightly underweight; normal weight;
slightly overweight; and very overweight.
;
Cigarette and alcohol use. Information regarding smoking and alcohol
use was included in this study due
to
their potentialto
confound the truerelationship between PA and depression, as both have been shown
to
beassociated with depression and physical activity, albeit with some differences by
sex.32•33•34•35 For example, physically active females are less likely
to
reportalcohol use than nonactive females, while physically active males are more likely
to
report alcohol use than nonactive males. Respondents were asked how manydays in the past month they had smoked cigarettes. Current smoking was coded
as ever (=1) or never (=0) smoked in the past 30 days. Alcohol use was coded
as ever (=1) or never (=0) got drunk in the past year.
Physical activity (PA). PA levels were measured using standard 7-day
recall methods common to other community-based epidemiological studies.36• 37 While self-reported PA behaviors are more subjective than other measurements
of PA, 7-day recall questionnaires have demonstrated up to 75% agreement with
directly observed activity, with increasing validity with age.3" For further
discussion regarding issues related to physical activity assessment in
adolescents, see Appendix 2.
To measure frequency of moderate to vigorous PA (i.e. activities that are
associated with energy expenditure of 5-8 metabolic equivalents), respondents
were asked three questions regarding how often they had participated in three
groups of activities within the past week: roller-blading/cycling, exercise, and
team sports. Responses for each question were given a numerical value: 0
times (=0), 1-2 times (=1), 3-4 times (=3), or ;:o5 times (=5). The total
moderate-vigorous activity equaled the sum of responses, expressed as times/wk (range:
0-15). Total PA levels was categorized as "Low" if the total was 0-4 times/wk
;
(=0); or "High" if the total was 25 times/wk (=1 ). This categorization was based
on the current CDC recommendation that youth be active "most days" of the
week, assuming that being active 5 or more times met this requirement.39 In
addition, information regarding weekly physical education (PE) participation was
elicited and categorized as 0 times, 1-4 times, or 5 times per week.
Measures of Dependent Variables
Depressive symptoms. The Add Health study used a modified version of
the 20-item Center for Epidemiological Studies-Depression (CES-D) scale to
measure depressive symptoms, an instrument previously validated for use in U.S.
adolescent populations40· 41 In this scale, participants were asked how often they
experienced a range of depressive symptoms (e.g. feeling fearful, sad, hopeless)
during the past week. Responses are scored according to a four-point scale
ranging from 0, if a symptom was present "rarely or none of the time", to 3, if a
symptom was present "most or all of the time". Internal consistency, or the
extent to which all included items measure depression, has been measured with
Cronbach's alpha coefficient, with values between 0.82-0.89 among adolescents,
higher than the 0.80 limit necessary to be considered acceptable for correlational
studies.40 Total CES-D scores, representing the summation of all individual scored responses, range between 0-60, with higher scores associated with
greater severity of depressive symptoms and risk of developing major
depression.'" Using receiver operating characteristic curves, threshold points of
22 and 12 have been selected for adolescent males and females, respectively,
when used as a screening tool for adolescent depression in a community-based
sample.'"
The modified CES-D scale used in the Add Health study was comprised
of 19-items, omitting two from the original scale ("My sleep is was restful"; "I had
crying spells") and including one new item ("I felt that life was not worth living").
This modified scale has demonstrated high internal consistency in other studies
using Add Health Wave I data (Cronbach
a
coefficient = 0.87)42 Rather than dichotomize respondents as either depressed or not based on a set threshold,CES-D score (range: 0-57) was maintained as a continuous variable to regard
depressive symptoms as a continuum.
Suicidal ideation and attempt. Suicidal ideation was measured by
self-reported thoughts of suicide over the past year, coded as never (=0) or ever (=1).
Suicidal attempt was measured as self-reported attempt of suicide over the past
year, coded as never (=0) or ever (=1 ).
Statistical Analysis. All statistical analyses were performed using STAT A, statistical software capable of analyzing survey data.43 Data was weighted in all analyses to correct for unequal probability-based sampling in order to produce
nationally representative results.44 To the extent that sex differences exist regarding risk factors for depression and determinants of physical activity, all
analyses were stratified by sex.45 Univariate analysis described total sample
characteristics based on selected variables described above. To determine if
there were statistically significant differences across racial/ethnic groups,
one-way analysis of variance (ANOVA) and chi-square statistics were used for
continuous and categorical variables, respectively. Multivariate analysis was
performed to determine the association between PA and depressive symptoms
after controlling for all other variables. Multiple linear regression models were
used to investigate the association between CES-D score and PA, controlling for
potential confounders (e.g. respondent age, BMI, cigarette/alcohol use, parental
education, and body image). First, separate sex-stratified linear regression
models were performed for each PA variable (e.g., weekly PA and PE
participation), including dummy variables coded for race included as covariates,
and interaction terms for race and each PA variable. Then, sex- and
race-stratified linear regression models were performed to determine significant
associations, if any, between PA variables and CES-D score. Logistic regression
modeling was used to investigate the association between PA variables and
suicidal ideation and attempt separately, controlling for potential confounders,
using the same process described above. Unless otherwise stated, statistical
significance was set at an alpha level of 0.05.
I
RESULTSSample population. Of the 6504 adolescents included in the Wave I public
dataset, 4855 (74.6%} were included in the final analysis. Reasons for exclusion
included: missing/incomplete data (n=1333); physical disability (n=44 ); and age
~ 9 years (n=272). Descriptive characteristics of the final sample are provided in
Table 1. In general, females (50.8%) and males (49.2%) were equally represented. On average, girls reported a significantly higher number of
depressive symptoms than boys, with mean CES-D scores almost two points
greater than those for boys (mean CES-D score: 11.52 vs. 9. 73, respectively,
Demographics.
Adolescent males. Demographic characteristics among adolescent males by
race/ethnicity are shown in Table 2. There were no significant differences in age, BMI, or body image between race/ethnic groups (p>0.05). There were
statistically significant differences across race/ethnic groups regarding smoking
(p=0.015), with the highest proportion of smokers among White males (28.6%),
and the lowest among Black males (19.7%). A similar trend was seen with
alcohol use (p=0.009), with White males reporting the highest rate of drinking
(30.4%), and Black males the lowest rate (19.5%). Finally, educational
attainment by parents differed by race/ethnicity (p<0.001 ). Parents of Hispanic
males reported the highest rate of not completing high school (42.7%), with
parents of White/Other males demonstrating the highest rate of receiving a
College/Professional degree (25 and 28.7 percent, respectively).
Adolescent females. Demographic characteristics among adolescent females by
race/ethnicity are summarized in Table 3. There were no significant differences
among racial groups by age (p>0.05). There were statistically significant
differences across race/ethnic groups regarding BMI (p<0.001 ), with Black
females having the highest BMI (23.4) and WhiteiOtherfemales the lowest (21.7
and 21.7, respectively). As seen with adolescent males, smoking and alcohol
use demonstrated significant differences by race/ethnicity (p<0.001 ). Specifically,
White females reported the highest rates of smoking (29.2%) and alcohol use
(28.3%), with Black females reporting the lowest rates (9.8% smoked; 12.3%
used alcohol). Unlike their male counterparts, however, adolescent females
demonstrated a significant difference in body image by race/ethnicity (p=0.003).
overweight. Black females were most likely to believe they were at a normal
weight (56.4%) and least likely to believe they were very overweight (2.1%).
Conversely, between 5 to 6 percent of all other racial groups considered
themselves to be very overweight. Finally, parental education level differed by
race/ethnicity (p<0.001 ). Specifically, parents of Hispanic females were most
likely to report not finishing high school (40.4%), and parents of White females
were least likely (8.6%). Parents of Other females were most likely to report
receiving a college/professional degree (34.6%), while parents of Hispanic
females were least likely (10.5%).
PA, CES-D score, and race/ethnicity.
Adolescent males. The results of the bivariate analyses for adolescent males
regarding physical activity, depressive symptoms, and race/ethnicity are found in
Table 4. Among adolescent males, there were no significant differences across
race/ethnic groups in weekly PA level (proportion reporting High weekly PA:
77.7% Non-Hispanic white, 82.1% Non-Hispanic black, 78.6% Hispanic, 80.9%
other, p=0.326). Although the majority of boys reported no weekly PE
participation regardless of race (range 67-77%), there was a trend towards ethnic
minority males reporting higher levels of weekly PE participation compared to
Non-Hispanic white males (p=0.082). Mean CES-D score was significantly
different by race/ethnicity, with non-Hispanic White boys reporting lower scores
than ethnic minority males (p=0.013). There was no difference in suicidal·
attempt by race/ethnicity, with between 0.8 and 3.3 percent of each racial group
reported attempting suicide in the past year (p=0.359). There were significant
likely to report thinking about suicide over the past year (11.4%), followed by
Other males (10.3%), Black males (6.5%), and Hispanic males (5.8%).
Adolescent females. The results of bivariate analyses for adolescent females
regarding PA, depressive symptoms, and race/ethnicity are found in Table 5.
Among adolescent females, there were significant differences across race/ethnic
groups for both weekly PA levels and PE participation. Specifically, non-Hispanic
White females were most likely to report High weekly PA, while Hispanic females
were least likely (67% and 59%, respectively, p=0.039). Similar to boys, the
majority of girls reported no weekly PE participation (range 71-80%).
Non-Hispanic Black females were most likely to report participating in PE 5 times a
week, with non-Hispanic White females least likely (22.3% vs. 11.8%,
respectively, p=0.025). Mean CES-D scores among non-Hispanic White girls
were significantly lower than ethnic minority females (p<0.001 ). Finally, while
there were no significant differences in suicidal attempt between race/ethnic
groups, girls classified as Other were most likely to report thinking of suicide in
the past year compared to their peers (p=0.041 ).
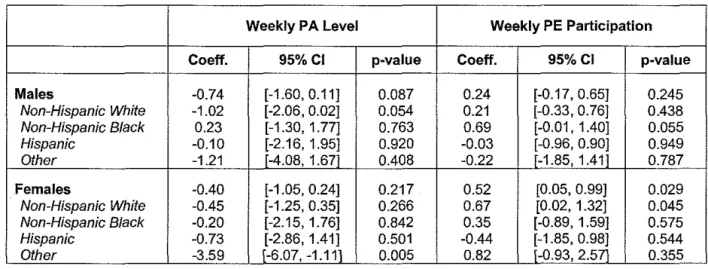
Association between PA and CES-D score by race/ethnicity. Results from multiple linear regression modeling are shown in Table 6.
Adolescent males. Among adolescent males, neither weekly PA level nor PE
participation was significantly associated with CES-D score (Weekly PA level:
coeff= -0.74, p=0.087; Weekly PE: coeff=0.24, p=0.245). In addition, there were
no significant interactions between race and weekly PA level or PE participation
[data not shown]. There was a trend for an inverse relationship between
p=0.054), and a positive relationship between weekly PE and CES-D score
among non-Hispanic Black males (coeff: 0.69, p=0.055).
Adolescent females. Among adolescent females, there was not an overall
significant association between CES-D score and weekly PA level (p=0.217), but
there was for weekly PE participation (coeff: 0.52, p=0.045). There was a
significant interaction between race and weekly PA for Other females
[race*weeklyPA = -2.87, p=0.039]. Race-stratified analysis showed that among
females classified as Other, those reporting "High" weekly PA were less likely to
report depressive symptoms than those reporting "Low" weekly PA (p=0.005).
On average, their CES-D scores were three points lower than those reporting
.
Hispanic White females there was a significant positive association (coeff: 0.67,
I
"Low" weekly PA. Finally, while ethnic minority females did not exhibit asignificant association between PE participation and CES-D score, among
non-p=0.045).
Association between PA, suicidal behavior, and race/ethnicity.
Odds ratios, adjusted for potential confounders, describing the association
between PA and suicidal behavior by race/ethnicity are shown in Table 7.
Adolescent males. Overall, adolescent males who reported "High" weekly PA
were 50% less likely to report suicidal ideation in the past year than those males
reporting "Low'' weekly PA (OR: 0.53 [95% Cl: 0.37-0.75], p<0.001). This inverse
association between PA and suicidal ideation only persisted among non-Hispanic
L
White males in the race-stratified analysis (OR: 0.46 [95% Cl: 0.31-0.69],
p<0.001). This "protection" against suicidal ideation via weekly PA did not extend
likely to attempt suicide than their less active peers (OR: 0.73 [95% Cl:
0.34-1.75], p=0.419). Adolescent males who did not report regular weekly PE were no
more likely to report suicidal ideation or attempt than those reporting weekly PE
(OR: 0.89 [95% Cl: 0.71-1.12], p=0.311 ). This lack of association persisted
across all race/ethnic groups in the race-stratified analysis.
Adolescent females. Overall, adolescent females reporting "High" weekly PA
levels and PE participation were not less likely to report suicidal ideation or
attempt over the past year than adolescent females reporting "Low" weekly PA
levels and no PE, respectively (Table 7). Among non-Hispanic White females,
weekly PE participation was associated with greater risk of suicidal ideation, with
those reporting regular weekly PE more likely to report suicidal ideation over the
past year than those reporting no weekly PE (OR: 1.31 [95% Cl: 1.06-1.60],
I
p=0.011).DISCUSSION
This study sought to determine the association between physical activity
levels and depressive symptoms, and whether this association differed by
race/ethnicity, within a nationally representative sample of U.S. adolescents.
Generally speaking, what association exists between PA and depressive
symptoms is relatively weak, if present at all. Among non-Hispanic White
adolescent males, there was a trend towards a marginal inverse association
between weekly PA and depressive symptoms. On average, those reporting
High PA levels had lower CES-D scores than those reporting Low PA levels,
although the absolute difference in scores was one point. Given that the range of
significant. When looking at weekly PE participation, there was no significant
association between PE and CES-D score for both males overall, and in
racial/ethnic subgroups.
Among adolescent females, while there was no association between
moderate-vigorous PA and CES-D score overall, there was a relatively significant
inverse association among "Other'' females, with those reporting high PA levels
having CES-D scores 3.5 points lower on average than those reporting low PA
levels. Although this could be clinically meaningful, the fact that the "Other''
category encompasses a smorgasbord of racial/ethnic categories, it is difficult to
discern to whom these results apply. In addition, weekly PE participation was
positively associated with CES-D score overall among adolescent females,
i
although this association only persisted among non-Hispanic White females.
This could suggest that PE participation is harmful to adolescents' mental health,
as increasing PE participation was associated with higher CES-D scores.
However, the magnitude of increase (less than a point on a scale of 0-59)
suggests that such an association, while statistically significant, is not clinically
meaningful.
The most striking association between PA and depressive symptoms was
when one looked at suicidal behavior, specifically suicidal ideation. In general,
adolescent males who reported "High" weekly PA levels were 50% less likely to
also report suicidal ideation over the past year when compared to those who
reported "Low" weekly PA levels. This decreased likelihood of suicidal ideation
L
persisted only among non-Hispanic White adolescent males. However,
association between PA levels and suicidal ideation was not shared by
between PA and suicidal attempt, whether measured by weekly PA level or PE
participation among both males and females. This is not surprising given the
relatively small amount of adolescents reporting suicidal attempt over the past
year (3.6% of the sample). This rate is considerably less than that found by the
1995 Youth Risk Behavior Surveillance Survey (YRBSS), in which 8.7% of a
nationally representative sample of high school students reported one or more
suicidal attempts over the past year.46
Thus, through the available measures, it does not appear that PA and
depressive symptoms are strongly associated among adolescents, and this
association does not vary greatly by race/ethnicity. For those subgroups that
demonstrated a significant association, such associations were not particularly
large in magnitude, excluding that found for "Other" females. The apparent lack
of association could be due in part to the relatively low levels of activity among
study participants, specifically regarding weekly PE. With approximately 75% of
participants reporting no weekly PE participation, any potential mental health
benefit from institutionalized activity could be hard to demonstrate among the few
who reported regular PE.
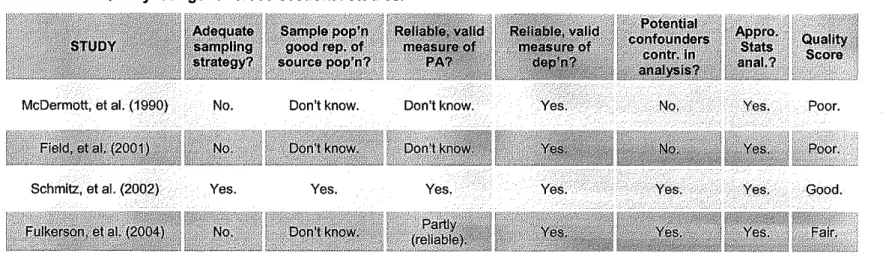
These findings are similar to others in the literature. Schmitz et al. (2002)
found that among young adolescents (mean age: 12.8 yrs), frequency and
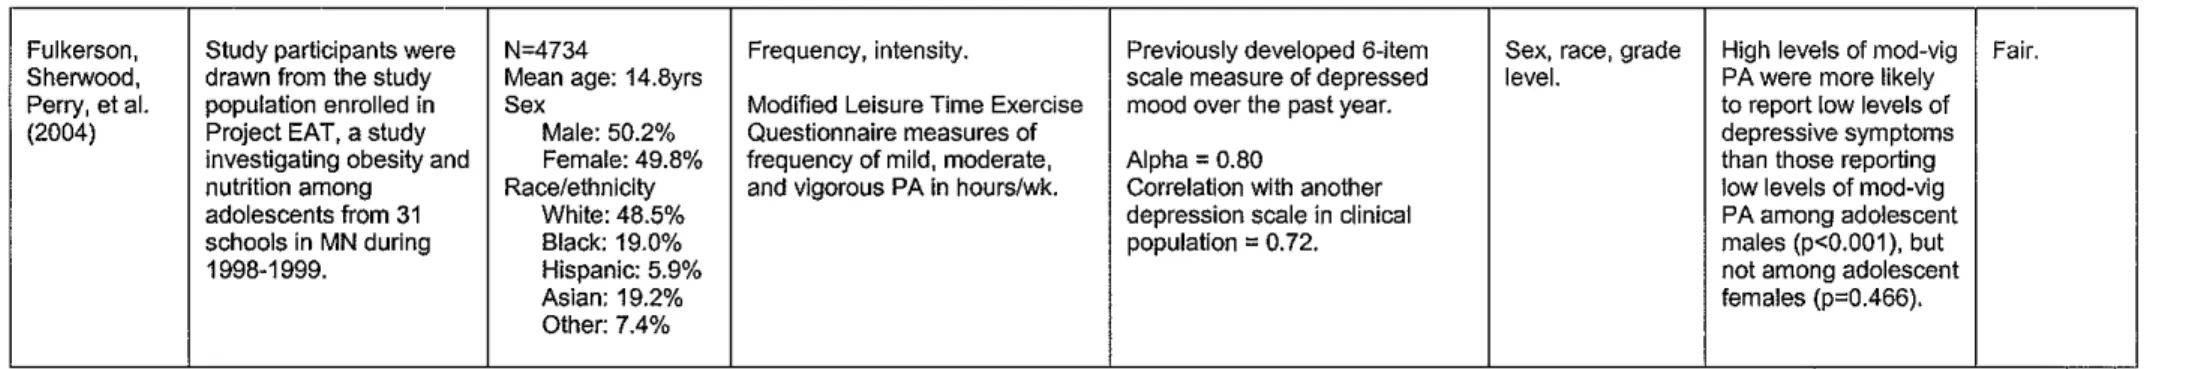
intensity of PA was not a significant predictor of CES-D score (p>0.05).47 In addition, Fulkerson et al. (2004) also demonstrated a significant inverse
relationship between moderate-vigorous PA and depressive symptoms among
adolescent males, but not females48 In addition, a longitudinal study by Moll et
al. (2004) found that, while natural changes in physical activity were significantly
associated with a change in depressive symptoms, the absolute change was not
I
I
'
clinically significant and thus the relationship between PA and depressive
symptoms is modest at best.49
This study has several limitations. First its cross-sectional design
prevents establishing directionality of the association between physical activity
and depression. Second, while the CES-D scale has been validated for use in
U.S. adolescents, less is known as to its validity for use in ethnically diverse
adolescent samples like that in the present study. It should be noted that this
study found no association between PA and depressive symptoms as measured
by the CES-D scale, which measures primarily depressive affect. Therefore
these findings cannot be applied to psychosomatic complaints that may
accompany depressive symptoms. Third, grouping Asians, Native Americans,
and multi-racial adolescents into one "Other'' racial category may have diluted
any true associations between physical activity and depressive symptoms for
these populations. Fourth, high number of subgroup analyses, while declared a
priori, could have increased the likelihood of finding a chance association which
does not truly exist. Fifth, these conclusions are based on data that is ten years
old, and drawn from one-third of the original Add Health sample. Sixth, results
from the present study cannot be generalized to adolescents who do not attend
school (e.g. dropouts, juvenile delinquents, and truants), who may be at greater
risk for depression when compared to those who regularly attend school. 5°
Finally, as this is a secondary data analysis I was constrained by the
methods used by the original researchers to measure variables of interest. For
example, using only one parent's educational attainment to define "high SES"
Black adolescents assumes both that parents' education strongly determines
social class, and that social class is a significant predictor of adolescent health
outcomes. In addition, self-reported height and weight were used to calculate
BMI. Given adolescents have been shown to systematically underestimate
weight and overestimate height, "measured" BMI as defined in this study is likely
to be lower than true values.51•52•53 However, there was a correlation between
weight perception and BMI for study participants, with those having relatively
high BMis more likely to consider themselves to be overweight. As well, the
questions used to measure suicidal attempt and ideation only extended to the
past year, so experiences of suicidal attempt or ideation dating back further than
a year were not included. Thus, an association between PA and ever having
thought of and/or attempted suicide cannot be determined by this study. Also, as
discussed below, the present state of measuring PA in adolescents via
self-report is imprecise and limited in scope.
There is still work to be done in the field of physical activity and
adolescent depression. Most importantly, as most studies regarding physical
activity and depression rely on some form of self-reported measure of PA, efforts
to improve the reliability/validity of such methods (or development of more
accurate instruments that are equally as cost-effective) should be continued and
reinforced. In addition, most studies of PA and depression focus on frequency of
activity. Few others, like Add Health, attempt to also categorize PAin terms of
intensity. Along with these dimensions, others that should be explored include
mode (e.g. aerobics, yoga, strength training) and duration (e.g. short vs. long
bouts of exercise). In addition, focus on PA's association with depressive
symptoms should be further explored in clinical populations of adolescents,
whether already diagnosed with depression and/or presenting with another
While policy efforts to increase physical activity among adolescents are
well-founded in PA's ability to improve physical and cardiovascular health, these
benefits may not extend to improvement of depressive symptoms given the
results of the present study. Benefits from physical activity include lower blood
pressure, improved lipid blood profile, increased endurance, interpersonal skills,
and elevated self-efficacy for physical activity. Unfortunately there does not
appear to be significant evidence to support the use of PA to improve depression
among adolescents in the community. The potential harms from physical activity
primarily include avoidable injury and sudden cardiac death. However, given its
favorable risk-benefit profile, it is good public health policy and clinical practice to
Table 1. Characteristics of Add Health Wave I respondents and their parents (N=4855).
CHARACTERISTIC MALES FEMALES
(N=2390) (N=2465)
Age, mean (SO), yrs 15.72 (0.11) 15.61 (0.11)
Racelethnicity, No. (%)
Non-Hispanic White 1470 (69.5) 1473 (67.8)
Non-Hispanic Black 530 (13.8) 570 (14.6)
Hispanic 242 (10.7) 266 (11.7)
Othel' 148 (6.0) 156 (5.9)
BMI, mean (SO), kglm• 22.4 (0.14) 22.0 (0.13)
Current smoker, No. (%) 626 (26.4) 573 (25.3)
Current alcohol use, No. (%) 674 (28.0) 606 (25.2)
Weight perception, No. (%)
Vety underweight 47 (1.8) 39 (1.6)
Slightly underweight 499 (21.1) 217 (8.3)
Normal weight 1324 (54.9) 1265 (51.3)
Slightly overweight 482 (20.4) 832 (34.0)
Verv overweight 38 (1.8) 112 '(4.7),
Parental education, No. (%)
Less than high school 311 (14.4) 344 (14.6)
High school and/or vocational training 964 (42.2) 1007 (44.2)
Some college 509 (20.4) 461 (18.0)
College/professional degree 606 (22.9) 653 (23.1\
Weekly PA level, No. (%)
Low 507 (21.4) 847 (35.2)
High 1883 (78.6) 1618 (64.7)
PE participation, No. (%)
Otimeslwk 1785 (74.7) 1939 (78.0)
1-4 times/wk 188 (8.3) 173 (7.6)
5 timeslwk 417 (17.0) 353 (14.3)
CES-0 Score, mean (SO) 9.73 (0.17) 11.52 (0.23)
Thought of suicide in past year, No. (%) 237 (1 0.0) 379 (15.6)
Attempted suicide in past year, No. (%) 54 (2.2) 119 (5.1)
Table 2. Demographic characteristics of Add Health Wave I male participants by racelethnicity (N=2390).
Non-Hispanic Non-Hispanic
Hispanic Other
White Black P-value
(N=1470) (N=530) (N=242) (N=148)
Age, mean (SO) 15.7 (0.12) 15.8 (0.25) 15.7 (0.21) 15.6 (0.21) 0.735
BMI, mean (SO) 22.3 0.14) 22.5 (0.32) 22.8 (0.29) 22.8 (0.72) 0.355
Current smoker, No. (%) 444 28.6) 89 (19.7) 59 (22.6) 34 (24.3) 0.015
Current alcohol use, No. (%) 475 30.4) 96 (19.5) 73 (26.4) 30(22.1) 0.009
Weight perception, No. (%)
Very underweight 24 (1.5) 14(3.1) 5 (1.9) 4 (2.5)
Slightly underweight 297 (20.7) 114 (21.3) 53 (22.0) 35 (24.1)
0.374
Normal weight 811 (54.6) 313 (59.8) 123 (52.6) 77 (50.9)
Slightly overweight 315 (21.5) 80 (13.7) 57 (21.9) 30 (20.6)
Very overweight 23 i1.8) 9 (2.1) 4 (1.7) 2 (1.9)
Parental education, No. (%)
Less than high school 129 (8.9) 66 (18.4) 97 (42.7) 19 (18.5)
High school and/or 657 (44.9) 189 (43.8) 69 (28.6) 49 (32.8)
vocational training <0.001
Some college 316 (21.2) 124 (20.6) 38 (15.4) 31 (20.0)
Co/lege/professional 368 (25.0) 151 (17.2) 38 (13.3) 49 (28.7)
degree
Table 3. Demographic characteristics of Add Health Wave I female participants by racelethnicity (N=2465).
Non-Hispanic Non-Hispanic
Hispanic Other
White Black P-value
(N=1473) (N=570) (N=266) (N=156)
Age, mean (SO) 15.6 0.13 15.7 (0.22) 15.6 (0.22) 15.8 (0.18) 0.724
BMI, mean (SO) 21.7 0.14 23.4 (0.26) 22.5 (0.26) 21.7 (0.44) <0.001
Current smoker, No. (%) 429 29.2 54 (9.8) 48 (18.7) 42 (25.4) <0.001
Current alcohol use, No. (%) 429 28.3) 67 (12.3) 62(22.1) 48 (28.4) <0.001
Weight perception, No. (%)
Very underweight 17(1.3) 10 (1.9) 7(2.1) 5 (3.6)
Slightly underweight 114 (7.5) 57(8.1) 24 (9.2) 22 (16.7)
0.003
Normal weight 773 (52.0) 307 (56.4) 121 (4.8) 64 (36.8)
Slightly overweight 499 (34.3) 179 (31.5) 100 (34.5) 54 (36.8)
Very overweight 70 (5.0). 17(2.1) 14 (6.0) 11 .(6.2).
Parental education, No. (%)
Less than high school 127 (8.6) 88 (19.4) 103 (40.4) 26 (19.8)
High school and/or 652 (46.1) 207 (46.6) 95 (35.3) 53 (34.0)
vocational training <0.001
Some college 286 (19.4) 115 (17.8) 37 (13.7) 23 (11.5)
Co/lege/professional 408 (25.6) 160 (16.1) 31 (10.5) 54 (34.6)
Table 4. Distribution of physical activity levels and mean CES-D score by race/ethnicity among male Add Health participants (N-2390)
-
mNon-
Non-Hispanic Hispanic Hispanic Other
P-value
White Black (N=242) (N=148)
(N=1470) (N=530) Weekly PA level, No (%)
Low 328 (22.2) 99 (17.9) 51 (21.4) 29 (19.1) 0.326
High 1142
m:h
431·(82.-i)
191 .(78.6) 119 .(80.9)Weekly PE, No. (%)
0 times 1135 (77.4) 371 (68.7) 173 (69.4) 106(67.1)
0.082
1-4 times 119(7.8) 41 (8.2) 16 (8.8) 12 (13.5)
5times 216 (14.8) 118(23.1) 53 {21.8) 30 /19.4}
CES-D Score, mean (SO) 9.33 (0.21) 10.67 (0.43) 1 0.43 (0.43) 10.84 (0.67) 0.013
Thought of suicide in
166(11.4) 37 (6.5) 15 (5.8) 19 (10.3) 0.007 past year, No. (%)
Attempted suicide in
34 (2.3) 13 (2.1) 3 (0.8) 4 (3.3) 0.359
past year, No. {%)
Table 5. Distribution of physical activity !!'vels and mean CES-D score by race/ethnicity among female Add Health participants (N-2465) "'
-Non- Non- Hispanic Other
Hispanic Hispanic (N=266) (N=156)
White Black
(N=1473) {N=570) Weekly PA level, No. (%)
Low 480 (33.0) 200 (39.8) 111 (41.0) 56 (39.2)
High 993 (67.0} 370 (60.2} 155 i59.0l 100.(60.8)
Weekly PE, No. {%)
Otimes 1186 (80.2) 424 (71.8) 208 (73.5) 121 (77.0)
1-4 times 115(7.9) 29 (5.8) 20 (9.0) 9 (6.2)
5times 172 (i 1.8) 117 (22.3) 38 <i7.6l 26 /16.7)
CES-D Score, mean (SD) 10.62 (0.24) 12.88 (0.52) 13.98 (0.65) 13.66 (0.80)
Thought of suicide in
212 (14.8) 78 (13.7) 52(18.7) 37 (23.6) past year, No. (%)
Attempted suicide in
62 (4.9) 31 (5.0) 14 (5.1) 12 (7.6) past year, No. (%)
Table 6. Multiple linear regression analyses investigating the association between physical activity levels
and mean CES-D scores after controlling for potential confounders, by sex and race.
Weekly PA Level Weekly PE Participation
Coeff. 95%CI p-value Coeff. 95%CI p-value
Males -0.74 [-1.60, 0.11] 0.087 0.24 [-0.17, 0.65] 0.245
Non-Hispanic White -1.02 [-2.06, 0.02] 0.054 0.21 [-0.33, 0.76] 0.438
Non-Hispanic Black 0.23 [-1.30, 1.77] 0.763 0.69 [-0.01' 1.40] 0.055
Hispanic -0.10 [-2.16, 1.95] 0.920 -0.03 [-0.96, 0.90] 0.949
Other -1.21 f-4.08, 1.67l 0.408 -0.22 f-1.85, 1.41i 0.787
Females -0.40 [-1.05, 0.24] 0.217 0.52 [0.05, 0.99] 0.029
Non-Hispanic White -0.45 [-1.25, 0.35] 0.266 0.67 [0.02, 1.32] 0.045
Non-Hispanic Black -0.20 [-2.15, 1.76] 0.842 0.35 [-0.89, 1.59] 0.575
Hispanic -0.73 [-2.86, 1.41] 0.501 -0.44 [-1.85, 0.98] 0.544
Other -3.59 (-6.07, -1.11.1 0.005 0.82 l-0.93, 2.57i 0.355
Table 7. Multiple logistic regression analyses investigating the association between PA levels and suicidal ideation/attempt after controlling for potential confounders, by sex and race.
Weekly PA Level Weekly PE participation
Suiciilii!;f~~~fion
. ..•· ••..•.:;,z(· .·· \ ··•· • . . . .
,,;i~z{>'
: •• ·
...•..••
,•.·•~~:~r·
•••·•· ••..
. ·..
J.~L~8
OR 95%CI p-value OR 95%CI p-value
Males 0.53 [0.37, 0.75] <0.001 0.89 [0.71, 1.12] 0.311
Non-Hispanic White 0.46 [0.31' 0.69] <0.001 0.82 [0.61' 1.09] 0.165
Non-Hispanic Black 0.93 [0.36, 2.41] 0.887 0.91 [0.57, 1.48] 0.712
Hispanic 1.60 [0.30, 8.55] 0.582 1.27 [0.65, 2.49] 0.481
Other 0.49 [0.13, 1.94\ 0.310 1.46 lo .64, 3 .33] 0.364
Females 1.22 [0.97, 1.52] 0.086 1.14 [0.98, 1.33] 0.093
Non-Hispanic White 1.19 [0.90, 1.57] 0.220 1.31 [1.06, 1.60] 0.011
Non-Hispanic Black 1.01 [0.52, 1.96] 0.970 1.07 [0.72, 1.59] 0.749
Hispanic 1.11 [0.57, 2.16] 0.749 0.76 [0.44, 1.33] 0.341
Other 2.49 [0.79, 7.82] 0.117 1.11 [0.65, 1.89] 0.704
Suicidiil ~!tempt ... ··
.
.•· ....•. \ ·..
·•.
..· • . ...
··...
·.· ... •·.·
·
..
···OR 95%CI p-value OR 95%CI p-value
Males 0.73 [0.34, 1.57] 0.419 0.69 [0.41, 1.15] 0.155
Non-Hispanic White 0.69 [0.27, 1.74] 0.427 0.59 [0.26, 1.35] 0.210
Non-Hispanic Black 1.23 [0.21, 7.16] 0.815 0.69 [0.32, 1.49] 0.340
Hispanic 0.32 [0.04, 2.43] 0.269
Other 1.88 [0.18, 19.7i 0.597 1.34 [0.42, 4.301 0.615
Females 1.21 [0. 73, 2.00] 0.456 1.31 [0.92, 1.85] 0.128
Non-Hispanic White 1.31 [0.62, 2.75] 0.472 1.47 [0.99, 2.16] 0.054
Non-Hispanic Black 1.01 [0.41' 2.50] 0.986 0.69 [0.36, 1.35] 0.281
Hispanic 1.24 [0.39, 4.01] 0.712 0.80 [0.32, 1.98] 0.622
REFERENCES
1
Birmaher B, Ryan ND, Williamson DE, et al. Childhood and adolescent depression: a review of the past 10 years: part I. JAm Acad Child Ado/esc Psych 1996; 35: 1427-1439.
2
Kessler RC, and Walters EE. Epidemiology of DSM-111-R Major depression and minor depression among adolescents and young adults in the National Comorbidity Survey. Depression and Anxiety
1998; 7: 3-14. 3
Fleming JE, and Offord DR. Epidemiology of childhood depressive disorders: a critical review. J Am Acad Child Ado/esc Psychiatry 1990; 29: 571-580.
4
Saluja G, lachan R, Scheidt PC, et al. Prevalence of and risk factors for depressive symptoms among young adolescents. Arch Pediatr Ado/esc Med 2004; 158: 760-5.
5
Lewinsohn PM, Rhode P, Klein DN, et al. Natural course of adolescent major depressive disorder, 1: continuity into young adulthood. JAm Acad Child Ado/esc Psychiatry 1999; 38: 56-63.
6
Fergusson DM, and Woodward LJ. Mental health, educational, and social role outcomes of adolescents with depression. Arch Gen Psychiatr 2002; 59: 225-231.
7
Haarasilta LM, Mart1unen MJ, Kaprio JA, et al. Correlates of depression in a representative nationwide sample of adolescents and young adults. Eur J Pub Health 2004; 14: 280-285. 8
Fergusson DM, Horwood J, Ridder EM, et al. Subthreshold depression in adolescents and mental health outcomes in adulthood. Arch Gen Psychiatr 2005; 62: 66-72.
9
Kubik MY, Lytle LA, Birnbaum AS, et al. Prevalence and correlates of depressive symptoms in
~oung adolescents. Am J Health Behav 2003; 27: 546-553. 0
Brosnahan J, Steffen LM, Lytle L, et al. The relation between physical activity and mental health among Hispanics and non-Hispanic white adolescents. Arch Ped Ado/esc Med 2004; 158:818-823. 11
Weissman MM, Wolk S, Goldstein RB, et al. Depressed adolescents grown up. JAMA 1999; 281:1707-1713.
12
Timimi S. Rethinking childhood depression. BMJ 2004; 329: 1394-1396, p1394. 13
Hazell P, O'Connell D, Healthcote D, et al. Efficacy of tricyclic drugs in treating child and adolescent depression: a meta-analysis. BMJ 1995; 310: 897-901.
14
Whittington CJ, Kendall T, Fonagy P, et al. Selective serotonin reuptake inhibitors in childhood depression: systematic review of published versus unpublished data. Lancet 2004; 363: 1341-1345.
15
Hazell P, O'Connell D, Healthcote D, et al. Tricyclic drugs for depression in children and adolescents. Cochrane Database Syst Rev 2000; 3: CD002317.
16
Henning, C. Pediatric antidepressant use declines after FDA warning. Last updated 24 Sept 2004. Accessed online (2 Feb 2005) at http://panicdisorder.about.com/b/a/114579.htm. 17
Harrington R, Whittaker J, Shoebridge P, et al. Systematic review of efficacy of cognitive behaviour therapies in childhood and adolescent depressive disorder. BMJ 1998; 316: 1559-1563. 18
Report of the Surgeon General: Physical activity and health, adolescents and young adults. Center for Disease Control and Prevention Fact Sheet. Last updated 17 Nov 1999. Accessed online (27 Jan 2005) at http://www.cdc.gov/nccdphp/sgr/adoles.htm.
19
Gordon-Larsen P, Adair LS, and Popkin BM. Ethnic differences in physical activity and inactivity
~atterns and overweight status. Obes Res 2002; 10: 141-149. 0
Zlotnick C, Shea MT, Pilkonis PA, et al. Gender, type of treatment, dysfunctional attitudes, social support, life events, and depressive symptoms over naturalistic follow-up. Am J Psychiatry. 1996; 153(8): 1021-7.
21
Barera M JR, and Garrison-Jones C. Family and peer social support as specific correlates of adolescent depressive symptoms. J Abnorm Child Psycho/ 1992; 20(1 ): 1-16.
22
Okun MA, Ruehlman L, Karoly P, et al. Social support and social norms: do both contribute to gredicting leisure-time exercise? Am J Health Behav 2003; 27(5): 493-507.
3
Orvaschel H, Beeferman D, and Kabacoff R. Depression, self esteem, sex, and age in a child and adolescent clinical sample. J Clin Child Psycho/ 1997; 26(3): 285-9.
24
Szabo A, Billett E, and Turner J. Phenylethylamine, a possible link to the antidepressant effects of exercise? Br J Sports Med 2001; 35: 342-343.
25
Schwarz Land Kinderrnann W. Changes in beta-endorphin levels in response to aerobic and anaerobic exercise. Sports Med 1992; 13: 25-36.
26
Gordon-Larsen P, McMurray RG, and Popkin BM. Determinants of physical activity and inactivity gatterns. Pediatrics 2000; 105: E83.
7
Dunn AL, Trivedi MH, and O'Neal HA. Physical activity dose-response effects on outcomes on depression and anxiety. Med Sci Sports Exer2001; 33S: S587-S597.
28
Paluska SA and Schwenk TL. Physical activity and mental health: current concepts. Sports Med
29
Add Health: the National Longitudinal Study of Adolescent Health. About Public-Use Data. Last
updated 6 Feb 2004. Accessed online (19 May 2005) at http://www.cpc.unc.edu/projects/addhealth/data/publicdata.
30
Turner CF. Ku L, Rogers SM, et al. Adolescent sexual behavior, drug use, and violence: increased reporting with computer survey technology. Science 1998; 280: 867-873.
31
Daniels J. Weight and weight concerns: are they associated with reported depressive symptoms in adolescents? J Pediatr Health Care 2005; 19(1): 33-41.
32
Choi WS, Patten CA. Gillin JC, et al. Cigarette smoking predicts development of depressive si'mptoms among U.S. adolescents. Ann Behav Med 1997; 19(1 ): 42-50.
3
Poulin C, Hand D, Boudreau B, et al. Gender differences in the association between substance use and elevated depressive symptoms in a general adolescent population. Addiction 2005;
100(4): 525-535.
34
Brooks TL, Harris SK, Thrall JS, et al. Association of adolescent risk behaviors with mental health symptoms in high school students. J Ado/ Health 2002; 31:240-6.
35
Aaron DJ, Dearwater SR. Anderson R, et al. Physical activity and the initiation of high-risk health behaviors in adolescents. Med Sci Sports Exerc 1995; 27(12): 1639-45.
36
Anderson RE, Crespo CJ, Bartlett SJ, et al. Relationship of physical activity and television watching with body weight and level of fatness among children: results from the Third National Health and Nutrition Examination Survey. JAMA 1998; 279: 938-942.
37
Pate RR, Heath GW. Dowda M, et al. Associations between physical activity and other health behaviors in a representative sample of US adolescents. Am J Pub Health 1996; 86: 1577-1581.
38
Sirard JR and Pate RR, Physical activity assessment in children and adolescents. Sports Med
2001; 31 (6): 439-454.
39
The Pocket Guide to Good Health for Children. Agency for Healthcare Research and Quality
(AHRQ) Pub No. 04-IP004-A. U.S. Department of Health & Human Services. Last updated May 2004. Accessed online (19 May 2005) at http://www.ahrq.gov/ppip/childguide/childguide.pdf.
40
Garrison CZ, Addy CL, Jackson KL, e tal. The CES-D as a screen for a depression and other psychiatric disorders in adolescents. JAm Acad Child Ado/esc Psychiatry 1991 ; 30 : 636-641.
41
Roberts RE, Lewinsohn PM, and Seeley JR. Screening for adolescent depression: a comparison of depression scales. JAm Acad Child Ado/esc Psychiatry 1991; 30: 58-66.
42
Shrier LA, Harris SK, and Beardslee WR. Temporal associations between depressive symptoms and self-reported sexually transmitted disease among adolescents. Arch Pediatr Ado/esc Med
2002; 156: 599-606. 43
StataCorp. 2003. Stata Statistical Software: Release Edition 8. College Station, TX: StataCorp
LP.
44
Chantala K and Tabor J. Strategies to perform a design-based analysis using the Add Health data. Carolina Population Center: University of North Carolina at Chapel Hill. June 1999.
45
Schraedley PK, Gotlib IH, and Hayward C. Gender differences in correlates of depressive s.!'mptoms in adolescents. J Ado/ Health 1999; 25:98-108.
4
Kann L, Warren CW, Harris WA, et al. Youth Risk Behavior Surveillance- United States, 1995.
MMWR CDC Surveil/ Summ 1996; 45(4):1-84.
47
Schmitz KH, Lytle LA, Phillips GA, et al. Psychosocial correlates of physical activity and sedentary leisure habits in young adolescents: the Teens Eating for Energy and Nutrition in School study. Prev Med 2002; 34: 266-278.
48
Fulkerson JA, Sherwood NE, Perry CL, et al. Depressive symptoms and adolescent eating and health behaviors: a multifaceted view in a population-based sample. Prev Med 2004; 38: 865-875.
49
Moll RW, Birnbaum AS, Kubik MY, et al. Naturally occurring changes in physical activity are inversely related to depressive symptoms during early adolescence. Psychosom Med 2004; 66:
336-342.
50
Glied S, and Pine DS. Consequences and correlates of adolescent depression. Arch Pediatr Ado/esc Med. 2002; 156: 1009-1014.
51
Brener ND, McManus T, Galuska DA, et al. Reliability and validity of self-reported height and weight among high school students. J Ado/ Health 2003; 32: 281-287.
52
Himes JH and Faricy A. Validity and reliability of self-reported stature and weight of U.S. adolescents. Am J Hum Biology 2001; 13: 255-260.
53
Strauss RS. Comparison of measured and self-reported weight and height in a cross-sectional sample of young adolescents. lnt J Obes Relat Metab Disord 1999; 23(8): 904-8.
i
APPENDIX 1: Systematic literature review regarding physical activity and depressive symptoms among adolescents in the general community.
PURPOSE AND RESEARCH QUESTION
Adult populations. In their 2001 review, Dunn, Trivedi, and O'Neal
determined that the evidence supporting the ameliorating effect of physical
activity on depressive symptoms was "suggestive but not convincing," as all
support was from B and C levels of evidence, , meaning it was derived from
limited quality studies, and/or consensus/expert opinion.'· 2 While this review applied adequate methods to systematically gather, appraise, and synthesize the
evidence regarding this relationship, the authors included only studies with
clinically depressed populations, making it hard to generalize their conclusions,
albeit lukewarm, to the general community. A review by Paluska and Schwenk
(2000) attempted to investigate the relationship between physical activity and
mental health among both clinical and nonclinical populations.3 They concluded that physical activity was inversely associated with depressive symptoms,
especially in those reporting mild to moderate depressive symptoms. However,
there was no apparent systematic approach to appraising the literature leading
one to question the validity of the authors' conclusions.3 In both cases, the
authors primarily focused on adult populations.
Adolescent populations. Sallis, Prochaska, and Taylor (2000) reviewed
the literature for determinants of physical activity in adolescents, including
depression as one of many potential correlates, in which they also concluded that
depression was one of few consistently supported correlates of physical activity,
demonstrating a negative association.• However, this was based solely on the
regard to the relative quality of each study. Moreover, the methods used to
critically appraise the studies were inadequate, as the authors only determined if
the sample population was described, and the measurement for physical activity
was reported to be reliable and valid. Thus it cannot be determined whether
there exists a true relationship between physical activity and depressive
symptoms or not among adolescents in the general community.
Research question. This systematic literature review aims to answer the
question: Among U.S. adolescents in the general community, is physical activity
associated with depressive symptoms? Particular attention will be given to
subgroup analyses (where included) related to sex, race/ethnicity, and age. In
addition, facets of physical activity to be addressed include measures of
frequency, intensity, duration, and mode.
METHODS
Search strategy. I conducted a literature search of MEDLIN E. Cochrane
Library of Systematic Reviews, Physical Education Index, and Psyclnfo for
articles published in peer-reviewed English journals between 1990 and March
2005 using the following keywords: adolescent or youth or teenager; depressive
disorder or depression or mood disorder or psychological distress; and physical
activity or exercise. Abstracts and associated reference lists were screened for
articles which met eligibility criteria. Eligible studies were observational studies
that included both measures of physical activity and depression, and adolescents
(aged 11-18 years old} in the study population. Due to the potential influence of
socio-cultural factors on depressive symptoms, only studies conducted in the
United States were included. Measurements of physical activity were classified