© 2018 Erin Frey
ABSTRACT
Erin Frey: Antimicrobial Resistance and Zoonotic Outbreaks of Salmonella enterica in the United States, 2015-2018
(Under the direction of Anna P. Schenck)
The emergence of antimicrobial resistance worldwide has threatened the
therapeutic viability of antimicrobial drugs. Non-typhoidal Salmonella enterica
subspecies enterica sickens 1.2 million Americans annually and can be transmitted to
people through food, water, animal contact, and animal environments. This paper
represents the first description of the epidemiology of multistate zoonotic outbreaks of
non-typhoidal Salmonella in the US and their representative patterns of antimicrobial
susceptibility and resistance of patient isolates. It evaluates the rate of concordance
between traditional phenotypic and newer genotypic predicted antimicrobial resistance
patterns to in the context of Salmonella surveillance and treatment in the US that rely on
the cooperation between local, state and federal public health organizations. Given the
complex public health challenges public health leaders are urged to take the role of
chief health strategists by using transformational leadership and systems thinking to
engage stakeholders in the One-Health effort to combat zoonotic salmonellosis and
ACKNOWLEDGEMENTS
To Anna Schenck in Public Health Leadership Department in the UNC Gillings
School of Global Public Health for her review and editing of this document and her
support throughout my MPH program. To the staff in the CDC’s Division of Foodborne,
Waterborne and Environmental Diseases, particularly, Megin Nichols, my preceptor and
Enteric Zoonoses Activity team lead, who with Louise Francois-Watkins on the NARMS
Team, created the original research idea and made it possible for me to work onsite
with the CDC team on this project. Their help with providing background material on
NARMS and outbreak surveillance in the United States as well as interpreting outbreak
data and resistance profiles was invaluable.
To Lia Koski and Lauren Stevenson, who helped to procure, compile, and
organize the original outbreak data, Zac Schneider, who linked the outbreak line listings
to the resistance data in the PulseNet system, Jessica Chen in the NARMS lab, who
screened whole genome sequences for predicted resistance determinants in PulseNet,
Meseret Birhane, who performed data collection and analysis, Heather Carleton, who
helped to interpret the whole genome sequencing tree descriptions, and Kaitlin Tagg,
who verified and reviewed discordant resistance profiles of outbreak isolates, all of your
TABLE OF CONTENTS
LIST OF TABLES ... ix
LIST OF FIGURES ... x
LIST OF ABBREVIATIONS... xi
CHAPTER 1: MASTER’S PAPER FORMAT ...1
Zoonotic Outbreaks of Salmonella Enterica and Surveillance Systems in the United States: Background ...1
Antimicrobial Resistance and Zoonotic Outbreaks of Salmonella Enterica in the United States, 2015 – 2018 ...1
A Public Health Practitioner’s Role as Chief Health Strategist to Combat Antimicrobial Resistance and Zoonotic Outbreaks of Salmonella Enterica in the United States ...2
CHAPTER 2: ZOONOTIC OUTBREAKS OF SALMONELLA ENTERICA AND SURVEILLANCE SYSTEMS IN THE UNITED STATES ...3
Introduction ...3
2.1 Salmonella enterica subspecies enterica...4
2.2 Salmonella Reporting – Public Health Surveillance ...5
2.3 Salmonella Outbreak Detection ...6
2.4 Enteric Zoonoses Activity in the Outbreak Response and Prevention Branch Division of Foodborne, Waterborne and Environmental Diseases ...7
2.5 Antimicrobial drug resistance threat from non-typhoidal Salmonella enterica ...8
2.6 Testing for antimicrobial drug resistance in non-typhoidal Salmonella enterica: Phenotypic and genotypic testing ...10
CHAPTER 3: ANTIMICROBIAL RESISTANCE AND ZOONOTIC OUTBREAKS
OF SALMONELLA ENTERICA IN THE UNITED STATES, 2015 – 2018 ...14
3.1 Abstract ...14
3.2 Introduction ...15
3.3 Methods ...17
Data and specimen collection ...17
Data and specimen disposition ...18
Outbreak Identification ...18
Laboratory Analysis ...19
Epidemiologic Analysis ...20
3.4 Results...22
Outbreak Epidemiology ...22
Comparison to subsets based on proportion of outbreak isolates with WGS ...25
Epidemiologic Comparison between full case data to subset of isolates with antimicrobial resistance data ...26
Descriptive Epidemiology of Antimicrobial Resistance ...27
Whole Genome Sequencing Trees ...32
Resistance Concordance ...32
Discussion ...33
Epidemiologic Trends ...33
Extent and persistence of outbreaks and pattern of outbreaks by vehicle type ...35
Antimicrobial Resistance ...36
Limitations ...39
Opportunities for Further Research ...41
Conclusions...43
CHAPTER 4 PUBLIC HEALTH LEADERSHIP CONTEXT OF ZOONOTIC SALMONELLOSIS AND ANTIMICROBIAL RESISTANCE ...45
4.1 Public Health Threat of Zoonotic Salmonellosis and Antimicrobial Resistance ...45
4.2 One Health and Antimicrobial Stewardship ...48
4.3 Public Health Professionals as Chief Health Strategist ...48
4.4 Stakeholder Analysis ...49
4.5 Leadership at all levels ...52
4.5 Change Management ...54
4.6 Conclusion ...55
APPENDIX 1. RESISTANCE PROFILES FOR OUTBREAKS OF ZOONOTIC SALMONELLOSIS BY WHOLE GENOME SEQUENCING TREE CLADE DESCRIPTIONS, 2015-2018 ...69
LIST OF TABLES
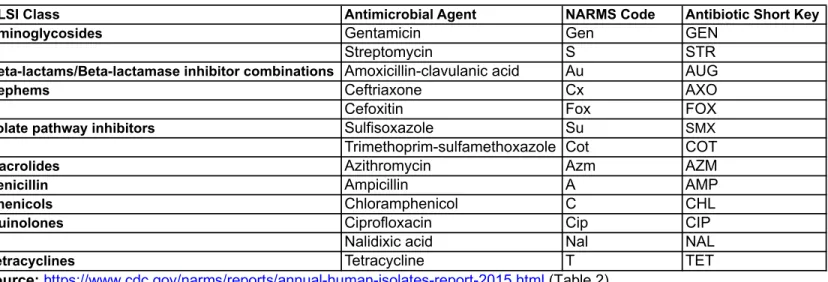
Table 1: Antimicrobial agents used for susceptibility testing for Salmonella
isolates by the NARMS laboratory in the US, 2015–2018 ...57
Table 2: Comparison of case and outbreak counts based on proportion and number of isolates with whole genome sequencing in zoonotic salmonellosis
outbreaks in the US, 2015–2018 ...57
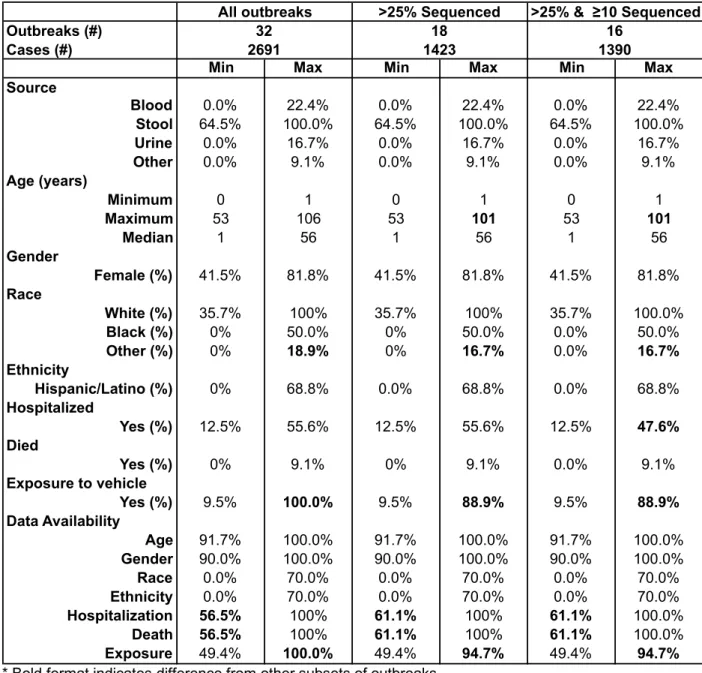
Table 3: Comparative Epidemiology of Outbreaks of Zoonotic Salmonellosis in the United States between all outbreaks, a subset of outbreaks that had WGS for > 25%, and a subset of outbreaks with at least 10 isolates with WGS
that constitute > 25% of isolates, 20 ...58
Table 4: Human Cases of Zoonotic Salmonellosis Compared by Implicated
Vehicle and Presence of Antimicrobial Resistance in the US, 2015–2018 ...59
Table 5: Antimicrobial Resistance in Zoonotic Salmonella enterica outbreaks for
antimicrobial drugs included in the standard NARMS AST Panel, 2015–2018 ...59
Table 6: Resistance Patterns among Human Isolates of Zoonotic Salmonellosis
in the US by Vehicle, 2015–2018 (n=198 isolates with resistance) ...60
Table 7: Epidemiology of Isolates tested with AST or Pred-R from Zoonotic
Outbreaks of Salmonellosis Compared by the Presence Antimicrobial Resistance
in the US, 2015–2018 ...61
Table 8: Epidemiology of Isolates tested with AST or Pred-R from Zoonotic Outbreaks of Salmonellosis Compared by the Presence of Absence of
LIST OF FIGURES
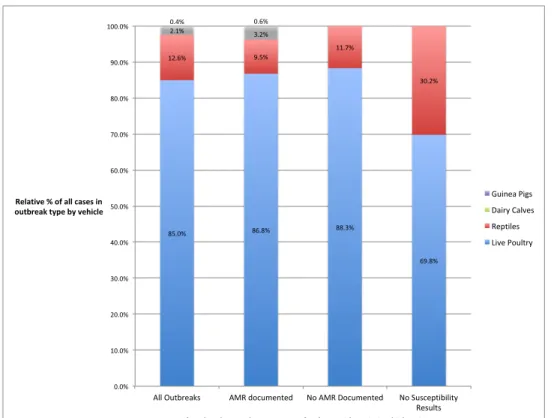
Figure 3.1 Relative Prevalence of Implicated Vehicles in Zoonotic Salmonellosis Outbreaks Categorized by the Presence of Outbreak
Level Antimicrobial Resistance in the US, 2015–2018 ...63
Figure 3.2 Prevalence of Resistance to Individual NARMS Antimicrobial Drugs Among 195 Human Isolates of Zoonotic Salmonellosis with
Documented Resistance by AST and/or WGS, 2015–2018 ... 64
Figure 3.3 Prevalence of Antimicrobial Resistance in 195 Human Isolates of Zoonotic Salmonellosis with Documented Resistance in the US by
Vehicle, 2015–2018 ...65
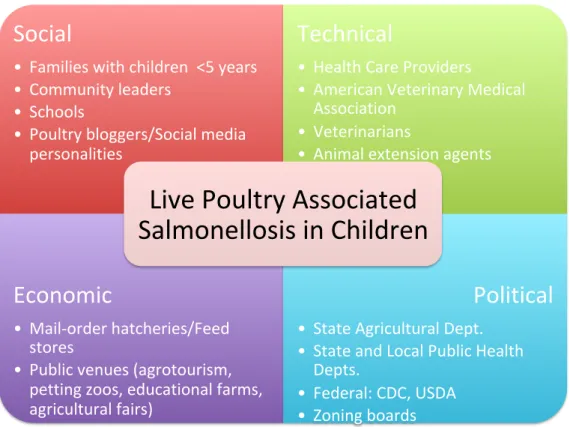
Figure 4.1 Example of STEP Scan for Stakeholders in the Context of Live
poultry-associated Salmonellosis in the United States ...66
Figure 4.2 Example of the IAP2 Spectrum of Public Participation in the
Context of Live poultry-associated Salmonellosis in the United States ...66
Figure 4.3 Example of IAP2’s Type of Involvement in the Context of Live
poultry-associated Salmonellosis in the United States ...67
Figure 4.4 Example of Stakeholder Mapping in the Context of Live
LIST OF ABBREVIATIONS
APHIS Animal Plant Health Inspection Service
AST Antimicrobial Susceptibility Testing
AVMA American Veterinary Medical Association
CDC Centers for Disease Control and Prevention
CFR Code of Federal Regulations
DFWED Division of Foodborne, Waterborne and Environmental Diseases
EDEB Enteric Disease Epidemiology Branch
EZA Enteric Zoonoses Activity
FAO Food and Agriculture Organization
FDA Food and Drug Administration
FSIS Food Safety and Inspection Service
hqSNP High-quality Single Nucleotide Polymorphism
IAP2 International Association for Public Participations
NARMS National Antimicrobial Resistance Monitoring System
NCEZID National Center for Emerging and Zoonotic Infectious Diseases
NNDSS Nationally Notifiable Disease Surveillance System
NORS National Outbreak Response System
OIE World Organisation for Animal Health
ORPB Outbreak and Response Prevention Brach
PFGE Pulsed-field Gel Electrophoresis
Pred-R Predicted Resistance
USDA United States Department of Agriculture
wgMLST Whole Genome Multilocus Sequence Type
WGS Whole Genome Sequencing
CHAPTER 1: MASTER’S PAPER FORMAT
The focus of this paper is to describe the epidemiology of zoonotic outbreaks of
non-typhoidal Salmonella enterica in the United States between 2015 and 2018. This
analysis includes the descriptive epidemiology of those identified in outbreaks and the
characterization of the resistance pattern of the bacterial isolates including comparing
phenotypic resistance patterns from antimicrobial susceptibility testing and predicted
resistance from whole genome sequencing. The paper is organized into the following
three chapters.
Zoonotic Outbreaks of Salmonella Enterica and Surveillance Systems in the United States: Background
Chapter 2 is an introduction to the importance of antimicrobial drugs in treating
human and animal illness, the burden of zoonotic salmonellosis in the United States, the
context of state and federal surveillance programs for non-typhoidal Salmonella, and
mechanisms for and patterns of antimicrobial resistance in a local and global context.
Antimicrobial Resistance and Zoonotic Outbreaks of Salmonella Enterica in the United States, 2015 – 2018
Chapter 3 is the output of my master’s practicum with colleagues at the Centers
for Disease Control and Prevention in the National Center for Emerging and Zoonotic
Infectious Diseases (NCEZID) in the Division of Foodborne, Waterborne and
Environmental Diseases (DFWED) in the Enteric Disease Epidemiology Branch (EDEB)
and Outbreak Response and Prevention Branch (ORPB). This section will be reviewed
inform current surveillance protocols during multi-state outbreaks of zoonotic disease
including protocols for sample submission and testing for antimicrobial resistance.
A Public Health Practitioner’s Role as Chief Health Strategist to Combat
Antimicrobial Resistance and Zoonotic Outbreaks of Salmonella Enterica in the United States
Finally, Chapter 4 describes opportunities to apply public health leadership
concepts to the topic of enteric zoonotic disease and antimicrobial resistance including
using a systems thinking approach to combatting zoonotic outbreaks of non-typhoidal
Salmonella enterica and promoting antimicrobial stewardship in the United States. It
explores ways to identify stakeholders at multiple levels of society and to describe their
role level of interest and influence in the problem as well as their relative support and
contribution to success public health interventions. The role of the public health
professional as the chief health strategist to promote antimicrobial stewardship and
outbreak prevention and value of transformational leadership and leadership at all levels
is explored to achieve these goals. These concepts are related to my personal journey
CHAPTER 2: ZOONOTIC OUTBREAKS OF SALMONELLA ENTERICA AND SURVEILLANCE SYSTEMS IN THE UNITED STATES
Introduction
The discovery of antibiotics has been lauded as one the ten greatest public
health achievements of the 20th century (CDC, 1999). With their discovery previously fatal infections from bacteria such as Staphylococcus spp. and Streptococcus spp. were
no longer incurable. Unfortunately, these once seemingly miraculous drugs are in
danger of becoming obsolete since the prevalence of antimicrobial resistance is
increasing locally and globally. The use of antimicrobial drugs causes selection
pressure on bacterial populations, whether pathogenic or commensal microbiota, that
can lead to the development or uncovering of resistant subpopulations of bacteria. In
the instance when a bacterial strain or subpopulation stops being susceptible to an
antimicrobial drug, it is considered to have acquired resistance (UMN, AMRLS, 2018).
This is distinct from the innate or inherent resistance that bacterial species may have to
certain antimicrobial drugs or drug classes, referred to as intrinsic resistance. While
clinicians are accustomed to taking into account intrinsic resistance when choosing
antimicrobial drugs for their patients’ infection, the possibility of acquired antimicrobial
resistance makes treatment failure more likely and increases the need for antimicrobial
susceptibility testing as a part of diagnostic and treatment plans.
Antimicrobial use, even when judicious or appropriate, is a driver of the
antimicrobial drugs have been discovered, resistance to those antimicrobials has
developed (CDC, 2013, AR Threats; CDC, 2018, What is Resistance?) The World
Health Organization (WHO) has called antimicrobial resistance, “one of the biggest
threats to global health, food security, and development today,” and cautions that
resistant bacterial strains can lead to “longer hospital stays, higher medical costs and
increased mortality” (WHO, Antibiotic Resistance, 2018). The current number of
antimicrobial drugs under development has slowed, and according to the WHO “none of
them are expected to be effective against the most dangerous forms of
antibiotic-resistant bacteria” (WHO, Antibiotic Resistance, 2018). This has threatened to stall
progress on the control of infectious diseases such as tuberculosis and raises concerns
that routine surgery and cancer chemotherapy may no longer be successful (WHO,
Antimicrobial Resistance, 2018).
2.1 Salmonella enterica subspecies enterica
Salmonella enterica subspecies enterica is a gram-negative, rod-shaped bacillus
that is further subdivided into serotypes that cause typhoid fever and those that do not,
called non-typhoidal Salmonella. The focus of this paper is on the latter, non-typhoidal
Salmonella, which is transmitted by the fecal-oral route and typically causes acute
diarrhea with or without blood, abdominal cramps, fever, and possibly nausea, vomiting,
or headache. More serious outcomes of Salmonella infection include bacteremia,
meningitis, osteomyelitis, septic arthritis, and death (CDC, Information for Healthcare
Providers, 2018). Every year in the US there are an estimated 1.2 million illnesses,
23,000 hospitalizations, and 450 deaths caused by non-typhoidal Salmonella. 1.1
million (or an estimated 15.2 illnesses per 100,000 people) result from exposure to a
contaminated food source (CDC, Information for Healthcare Providers, 2018; CDC,
Q&A, 2018; Scallan et al., 2011). The remaining vehicles for transmission include
contact with contaminated pet food, infected animals or animal surroundings including
enclosures (e.g., cage, tank, pen) or environments (e.g., barn or kennel surfaces,
railings, straw) (CDC, Information for Healthcare Providers, 2018).
2.2 Salmonella Reporting – Public Health Surveillance
National surveillance for Salmonella relies on several passive and active forms of
reporting. Although salmonellosis has been part of the National Notifiable Disease
Reporting System (NNDSS) since 1944, in 2018, the case definition for reporting
Salmonella was split into two categories to differentiate Salmonellosis (excluding
paratyphoid fever and typhoid fever) and Paratyphoid fever (caused by Salmonella
serotypes Paratyphi A, Paratyphi B [tartrate negative] and Paratyphi C) (CDC, n.d.,
Salmonella Case Definition 2017; CDC, Salmonella, Summary NNDSS, n.d.). Clinicians
voluntarily report cases as part of the NNDSS system and send isolates to public health
laboratories that confirm, serotype and forward on unusual or untypable isolates to the
CDC for further testing as part of the Laboratory-based Enteric Disease Surveillance
System (LEDS) (CDC, Salmonella | Surveillance, 2018). To enhance epidemiological
reporting from laboratory-confirmed cases of salmonellosis, the Foodborne Diseases
Active Surveillance Network (FoodNet) conducts active surveillance using 10 sites
nationally that cover an estimated 15% of the US population (CDC, FoodNet, 2016).
The National Outbreak Reporting System (NORS) assists local, state and territorial
parasitic, chemical, toxin, and unknown agents, as well as foodborne and waterborne
outbreaks of non-enteric disease” that include non-typhoidal Salmonella regardless of
whether it is spread through water, food, people, animals, or environmental
contamination (CDC, National Outbreak Reporting System (NORS), 2018). Even with
these surveillance system underdiagnosis does occur, and in the case of foodborne
outbreaks of non-typhoidal Salmonella, the true number of cases is estimated at 29.3
times the number diagnosed (Scallan et al., 2011).
2.3 Salmonella Outbreak Detection
The timeline from when a person is infected with Salmonella bacteria to when the
person is determined to be part of an outbreak can take from two to four weeks. For a
patient to be included in an outbreak case count requires action and resources (e.g.,
money, time and personnel) from patients, health care providers and public health
laboratories. This process starts when a person develops symptoms of illness and
proceeds to an exam by a health care professional, who submits a patient sample to the
lab for bacterial testing. If the laboratory determines that the bacterial sample contains
Salmonella, state regulations require that it be sent to a public health laboratory, such
as any one of the 83 PulseNet laboratories across the country, where they undergo
pulsed-field gel electrophoresis (PFGE) and whole genome sequencing (WGS) to
determine their genetic fingerprint for serotyping and DNA fingerprinting (CDC, Timeline
for Reporting, 2015). These patterns are then uploaded to PulseNet, which is the
molecular subtyping network for foodborne disease surveillance, and if two or more
patterns match, CDC scientists evaluate the cluster to determine whether it constitutes
PFGE pattern testing in cluster investigations with WGS because it quantifies isolate
relatedness more precisely using allele or single nucleotide polymorphism differences
between isolates rather than the less discriminatory PFGE “fingerprint” band pattern.
If a patient meets the established outbreak case definition including clinical (e.g.,
diarrhea, abdominal pain, nausea and sometimes vomiting), laboratory (e.g., a culture
independent test supports and culture confirms the presence of Salmonella), and
epidemiologic criteria (e.g., person, place, time), they are added to the outbreak count
(CDC, Surveillance Case Definition | Salmonella, 2017). Throughout this process health
departments conduct hypothesis generating and hypothesis testing questionnaires,
traceback and food and environmental testing to determine the source of the outbreak
(CDC, Outbreak Infographic, n.d.). In the case of salmonellosis linked to animal
outbreaks this might include testing animals (e.g., fecal or cecal samples) or their
environment (e.g., turtle water, animal pens or bedding).
2.4 Enteric Zoonoses Activity in the Outbreak Response and Prevention Branch Division of Foodborne, Waterborne and Environmental Diseases
Within the CDC’s Outbreak Response and Prevention Branch (ORPB) of the
Division of Foodborne, Waterborne and Environmental Diseases (DFWED), the Enteric
Zoonoses Activity (EZA) team is responsible for conducting multistate enteric zoonoses
outbreak investigations (CDC, Enteric Zoonoses Activity, 2018). When
hypothesis-generating interviews from patients identified as part of an outbreak indicate a pattern of
animal exposure that is greater than expected, outbreak response teams work to secure
samples from animals and animal environments that people had contact with before
becoming ill to enable comparisons with PFGE and/or WGS patterns from the ill people.
geckos, lizards, and snakes), dairy calves, and most recently guinea pigs (CDC,
Salmonella | Healthy Pets/Healthy People, 2018).
For example, between 1990 and 2015, there were 57 outbreaks linked to
Salmonella from baby poultry that included 2,885 illnesses, 450 hospitalizations, and
five deaths(CDC, Don’t Play Chicken with Your Health, n.d.). Children aged < five years
typically get sick at higher rates than other groups, and young children, the elderly, and
those with weakened immune systems, such as people undergoing chemotherapy,
typically have higher rates of serious outcomes such as hospitalization or death. While
antibiotics are not generally needed or recommended for mild cases of salmonellosis,
they are sometimes used in severe cases or in the aforementioned vulnerable groups
and include first line (i.e., ciprofloxacin (adults), azithromycin (children, pregnant
women), or ceftriaxone) and alternative options (e.g., ampicillin,
trimethoprim-sulfamethoxazole) (CDC, Information for Healthcare Providers, 2018; Shane et al.
2017).
2.5 Antimicrobial drug resistance threat from non-typhoidal Salmonella enterica
The CDC, in its 2013 Antimicrobial Resistance Threats Report, gave
non-typhoidal Salmonella the middle threat level of Serious, defined as “significant
antibiotic-resistant threats. For varying reasons (e.g., low or declining domestic incidence or
reasonable availability of therapeutic agents), they are not considered urgent, but these
threats will worsen and may become urgent without ongoing public health monitoring
and prevention activities.” (CDC, AR Threats, 2013)
In light of growing numbers of antimicrobial resistant strains of bacteria globally,
tracking “changes in the antimicrobial susceptibility of certain enteric (intestinal) bacteria
found in ill people (CDC), retail meats (FDA), and food animals (USDA) in the United
States” (CDC, 2018, NARMS). Additional goals of the NARMS surveillance program
include communicating findings to stakeholders in the US and abroad for the purpose of
instituting preventive strategies, engaging in research on the “emergence, persistence,
and spread of antimicrobial resistance,” and sharing data with the FDA that can be used
to inform decisions about antimicrobial drug approval for animal use (Karp, 2017).
While NARMS focuses on resistance data, resistance information from NARMS
is integrated with other national surveillance efforts. Isolates tested by NARMS may be
linked using a common isolate identifier to records from PulseNet, NORS, and FoodNet
(Karp, 2017). If an isolate is matched to an outbreak, the CDC links epidemiologic and
laboratory data from PulseNet and NARMS to aid in outbreak investigation and
response (Karp, 2017). Currently states are asked to submit a minimum of three
representative isolates from each single-state outbreak to the CDC for NARMS testing
(CDC, NARMS Human Isolates Surveillance Report for 2015; CDC, EDLB Submission
Table, 2018). In addition to submitting every 20th sample of nontyphoidal Salmonella for
surveillance, CDC requests that states submit additional isolates for multistate
outbreaks; typically three to five isolates are requested per multistate outbreak, but
additional isolates are requested when the epidemiology (e.g., subclusters of cases
linked by common exposure) or molecular characteristics (e.g., PFGE patterns or WGS
clades) indicate diversity within the outbreak (CDC, NARMS Human Isolates
2.6 Testing for antimicrobial drug resistance in non-typhoidal Salmonella enterica: Phenotypic and genotypic testing
Salmonella isolates cultured from patient samples (typically stool, urine, or blood)
were previously tested using antimicrobial susceptibility testing (AST) to determine
whether the bacterial strain had phenotypic resistance to a defined set of antimicrobial
drugs. Antimicrobial susceptibility testing methods and interpretive criteria used by the
CDC were developed through work with the Clinical Laboratory Standards Institute
(CLSI) and the European Committee on Antimicrobial Susceptibility Testing (EUCAST)
(Karp, 2017). Of the 18 antibiotics from 12 drug classes that NARMS uses to test
bacteria for resistance, the panel for testing Salmonella bacteria from 2015–2018
included 15 antibiotics, of which 13 were used throughout the entire period, one
(ceftiofur) was included until 2015, and one (meropenem) was included beginning in
2016 (CDC, NARMS Report 2015, Table 2, 2018) (Table 1).
One challenge of traditional AST testing is the time (e.g., days) it takes to
physically ship bacteria from state health departments to CDC, to grow bacteria in
culture and to perform identification and susceptibility testing. With the newer method of
WGS bacteria can be screened rapidly for genetic determinants of resistance and
compared to strains from different sources for genetic relatedness (Karp, 2017). In
2015, the EZA was created at CDC and began requesting WGS of outbreak isolates in
addition to the epidemiologic data from outbreak questionnaires and surveys. WGS can
be used to detect resistance genes for antimicrobial drugs that are not part of the
phenotypic resistance testing (i.e., AST panel) and can differentiate genetic
mechanisms of resistance that lead to the same predicted resistance pattern (i.e.,
(McDermott, 2016). Having a whole genome sequence of an outbreak isolate
strengthens the epidemiologic and laboratory evidence between outbreak cases and
between samples from people, animals, foods, and the environment.
These data are compiled into a WGS “tree” that depicts the genomic relatedness
of samples in an outbreak, either through high-quality single nucleotide polymorphism
(hqSNP) or whole genome multilocus sequence typing (wgMLST) trees that show the
number of SNP or allele differences between isolates, respectively. Because the data
from past outbreaks remains in the PulseNet database, WGS trees also include
historical samples from past outbreaks (whether human, animal, food, or environmental)
to put current outbreaks in context (Karp, 2017).
One drawback of WGS is it relies on known resistance genes, which is why
phenotypic testing of bacteria through AST will still be necessary to uncover new
resistance patterns (Karp, 2017). Additionally, while AST demonstrates the expressed
phenotypic resistance of an isolate (i.e., how it would respond to antimicrobials given to
a patient), WGS detects the presence but not necessarily the expression of resistance
genes (i.e., having genes that code for resistance does not guarantee that the bacteria
will express those genes and induce resistance to that antimicrobial drug in the person
or animal, from which it was isolated). Although WGS has been shown to predict
antimicrobial resistance with a high degree of accuracy in non-typhoidal Salmonella,
phenotypic resistance profiles derived from AST results are considered the gold
standard when both types of testing are performed (McDermott et al., 2016).
Although the CDC currently requests three to five isolates per outbreak, with the
many outbreak samples and what type of testing (i.e., AST vs. WGS) are needed to
characterize the etiological agent and resistance patterns of an outbreak. Given limited
personnel and monetary resources and the demands on time for the health care
professionals, laboratorians, and health department employees, the protocol for sample
submission will likely be a trade off between a desire for the greatest accuracy and
precision while using resources efficiently.
2.7 Significance of this paper
The convention for outbreak reporting whether foodborne or zoonotic is to post a
summary on the CDC website and share it with the media. On occasion outbreaks
findings are presented as reports in the CDC’s Morbidity and Mortality Weekly (MMWR),
or trends for one vehicle type are explored in more detail, such as live
poultry-associated outbreaks from 1990–2014 (Robertson et al., 2018; Basler et al., 2016). This
paper represents the first time outbreak data from multiple years and from multiple
zoonotic vehicles has been compiled and analyzed to evaluate the epidemiology and
health outcomes of patients and to characterize antimicrobial resistance patterns by
vehicle type. Knowing which groups are most affected will allow public health
professionals to shape messaging and outreach to those groups. In addition, being able
to characterize outbreaks by vehicle type and expected resistance will aid in drafting
diagnosis and treatment guidelines for frontline health care professionals.
It also is the first time that phenotypic and genotypic antimicrobial resistance
patterns have been compared in a comprehensive manner across years and zoonotic
vehicles to look for concordance between testing methodologies. By gaining an
outbreak, the NARMS team can update surveillance protocols and develop
standardized guidance for testing and interpretation of results to aid health care
CHAPTER 3: ANTIMICROBIAL RESISTANCE AND ZOONOTIC OUTBREAKS OF SALMONELLA ENTERICA IN THE UNITED STATES, 2015 – 2018
3.1 Abstract
The emergence of antimicrobial resistance worldwide has threatened the
therapeutic viability of antimicrobial drugs. Non-typhoidal Salmonella enterica
subspecies enterica sickens 1.2 million Americans annually and can be transmitted to
people through food, water, animal contact and animal environments. This paper
represents the first summary description of the epidemiology of multistate zoonotic
outbreaks of non-typhoidal Salmonella in the US and their representative patterns of
antimicrobial resistance in patient isolates. Thirty-two outbreaks (n=2691 patients) of
zoonotic salmonellosis attributed to contact with live poultry, reptiles, dairy calves, and
guinea pigs affected infants aged <1 month to adults aged >100 years and resulted in
638 hospitalizations and 6 deaths between 2015 and 2018. Outbreaks linked to contact
with live poultry represented the majority (>85%) of outbreaks and patients over the
study period. Thirty-eight percent (n=1030/2691) of patient isolates underwent
traditional antimicrobial susceptibility testing and/or whole genome sequencing for
predicted resistance, and 40 distinct patterns of antimicrobial resistance emerged. Of
the isolates tested (n=1030),19.2% (n=198) demonstrated resistance to at least one
antimicrobial drug, and 13.8% (n=142) were resistant to 3 or more antimicrobial drugs.
Resistance to streptomycin, sulfisoxazole, tetracycline, and ampicillin were the most
with or were explained by differences in phenotypic and genotypic testing protocols in
over 90% of patient isolates. These results will be used to inform national Salmonella
surveillance protocols and to coordinate local, state and federal outbreak response.
3.2 Introduction
In the United States the National Antimicrobial Resistance Monitoring System
(NARMS) was established to integrate surveillance and tracking of antimicrobial
resistance patterns in enteric pathogens from people, retail meats, and animals. It is a
collaboration of the Centers for Disease Control and Prevention (CDC), Food and Drug
Administration (FDA), and the United States Department of Agriculture (USDA) with
cooperation and support from local, state, and territorial health departments who submit
bacterial isolates. Health departments are asked to submit every 20th Salmonella isolate to CDC-NARMS for antimicrobial resistance testing as well as three to five
representative isolates from each outbreak of the above pathogens. Samples submitted
to NARMS by 54 state and large urban health departments undergo antimicrobial
susceptibility testing (AST) by broth microdilution using a 14-drug Sensititre® panel
(CDC, NARMS Report 2015, 2018). Previous internal assessments of NARMS data by
CDC staff indicated that the current protocol of submitting three to five isolates per
outbreak was generally sufficient to acquire an outbreak’s major resistance profile.
The phenotypic resistance profile determined by AST is complemented by the
predicted resistance from genetic profile of sequenced isolates submitted to PulseNet.
Although PulseNet was originally envisioned and piloted in 1996 as a way to detect and
respond to outbreaks of foodborne disease, bacterial isolates from ill persons have
lakes, pools) (CDC, FAQs PulseNet, 2016; CDC, Outbreak Detection, 2016). Through
partnerships with state and large urban health departments PulseNet performs whole
genome sequencing (WGS) on outbreak isolates, and sequence differences are
compared using whole genome multilocus sequence type (wgMLST) or high-quality
single nucleotide polymorphism (hqSNP) analysis and displayed visually on a tree that
depicts isolate relatedness and clustering into distinct clades. Isolates submitted to
PulseNet can be compared via wgMLST or hqSNP analysis to outbreak-associated
isolates including those from human cases and implicated vehicles (e.g., food or animal
origin). Outbreak isolates are typically selected for submission to NARMS before the
outbreak investigation is complete for both single-state and multistate outbreaks. The
selection of isolates for susceptibility testing is independent of the decision to create a
WGS tree to aid the epidemiologic investigation. Therefore, isolates from a given
outbreak may be selected for susceptibility testing without prior knowledge of their
genetic relationship to other isolates in the outbreak. Susceptibility testing results from
NARMS are linked to data in PulseNet at the level of the individual isolate once the
results have laboratory approval. Susceptibility testing results are linked to
epidemiologic data from each outbreak reported to NORS at the level of the outbreak
after NARMS and NORS have completed data cleaning for the annual cycle (typically >
1 year after the conclusion of the outbreak).
Enteric pathogen isolates are evaluated for the presence of resistance
determinants (i.e., genes and mutation) using a modified version of ResFinder software
(BioNumerics), and these resistance determinants are used to predict the resistance of
AST panel. WGS has been shown to predict antimicrobial resistance with a high degree
of accuracy in non-typhoidal Salmonella (McDermott et al., 2016). Although
concordance between predicted and genotypic resistance patterns has been found
human and retail meat isolates (McDermott et al, 2016), no such study has compared
phenotypic resistance by AST with genotypic resistance from WGS for human isolates
from zoonotic outbreaks of Salmonella.
Since 2015 when the CDC began requesting WGS for isolates from zoonotic
outbreak of enteric disease (specifically non-typhoidal Salmonella), the proportion of
samples with sequencing data has increased. Using existing epidemiologic, AST and
WGS data from zoonotic outbreaks of non-typhoidal Salmonella that have occurred
since widespread use of WGS methodology (2015 through 2018), we performed
descriptive epidemiology of enteric zoonotic disease outbreaks and described
antimicrobial resistance in zoonotic outbreaks and the frequency of resistance
discordance.
3.3 Methods
Data and specimen collection
Epidemiologic data used in this analysis were collected during outbreak
investigations to aid outbreak response. Records reside at both the CDC and state and
large urban health departments since the latter usually interviews case-patients and
submits certain elements of the resulting epidemiologic data to the CDC. To fulfill
requirements of the National Notifiable Diseases Surveillance System (NNDSS),
Salmonella isolates were submitted to state or large urban health departments, and a
susceptibility testing (AST), whole genome sequencing (WGS), or both. All specimens
were identified with a corresponding isolate ID, which is a coded variable that protects
personal identifiers. The original health department, from which the sample originated,
has access to the key to personal identifiers.
Data and specimen disposition
Isolates previously submitted to CDC-NARMS for AST and/or WGS testing were
frozen and will be stored indefinitely at CDC according to standard NARMS protocol.
Isolates previously submitted and sequenced at local and state health departments will
be subject to individual site disposition protocol, which usually entails storage for
months to years but not indefinitely. Whole genome sequencing data will be stored in
the PulseNet database according to PulseNet protocol. Finally epidemiologic data will
be stored indefinitely in the CDC’s outbreak database according to ORPB protocol. A
coded isolate ID to protect personal identifiers will identify specimens, and data will be
presented in aggregate to avoid discerning individual-level patient information
Outbreak Identification
Zoonotic outbreaks of enteric disease with a known or suspected vehicle from
2015–2018 were identified from the CDC’s Enteric Zoonoses Activity (EZA) team, a
subset of ORPB. Although other outbreaks of zoonotic disease covered by ORPB and
NARMS (e.g., Campylobacter jejuni in puppies in 2017) were noted during the time
period, only outbreaks of non-typhoidal Salmonella were included in this analysis
because it was the primary zoonotic outbreak pathogen identified and because NARMS
submission protocols were expected to yield adequate data for analysis of both
Some outbreak investigations involved more than one Salmonella serotype but
were investigated under a single outbreak code due to the cases’ shared exposure to a
common transmission vehicle (i.e., animal type); however, distinct serotypes are neither
closely genetically related nor expected to share a common resistance profile. Prior to
2017, outbreaks of live poultry-associated salmonellosis were assigned a unique
outbreak code based on the Salmonella serotype of the cluster; however, beginning in
2017, all live poultry outbreaks from the calendar year were grouped under one
outbreak code due to the common outbreak vehicle. Given that WGS trees were
constructed from individual serotypes and even subsets of a serotype based on the
predominant PFGE pattern(s), live poultry outbreaks for the entirety of the study period
were treated as distinct outbreaks based on the serotype/PFGE pattern combination
regardless of the outbreak code used to identify them. Despite having one outbreak
code, an outbreak of turtle-associated salmonellosis from 2015 was also treated as two
separate outbreaks because two serotypes were identified, of which only one serotype
had WGS analysis.
Laboratory Analysis
Completed outbreak investigations from 2015–2018 with existing WGS trees
were identified, and individual isolates were classified according to their position on the
tree (e.g., main clade, clade B, clade C, outlier) when included. Isolates were screened
for the presence of resistance determinants using ResFinder 3.0 and for the presence
of plasmids using PlasmidFinder 3.0 (Center for Genomic Epidemiology, DTU).
Resistance patterns were predicted for each isolate based on the presence of
al., 2016). When both AST and WGS were performed on the same isolate, the predicted
resistance (Pred-R) pattern from WGS was compared to the phenotypic resistance
pattern from AST to ensure that no information was lost with updated sampling
protocols. When phenotypic and genotypic resistance patterns were discordant for an
antimicrobial drug on the standard NARMS panel, phenotypic AST results were given
precedence over Pred-R from WGS.
Epidemiologic Analysis
Outbreak records from the ORPB database were obtained for each outbreak
identified as above. Since reporting and grouping of data were not standardized during
this period, and since outbreak questionnaires varied based on the suspected or
confirmed vehicle, a core set of epidemiologic variables common to all outbreaks was
determined. These include age (minimum, maximum, and median), gender
(male/female), race (white/black/other), ethnicity (Hispanic/Latino: yes/no),
hospitalization (yes/no), died (yes/no), and exposure to the implicated outbreak vehicle
(yes/no). Data were considered missing if the record was blank or had the answers of
‘don’t know,’ ‘unknown,’ or ‘no answer.’ Where possible, missing data from compiled
multiple line listings for outbreak epidemiology was supplemented from demographic
information derived from matched PulseNet records, which were only available for a
subset of patients whose isolates were submitted for AST or WGS analysis.
Epidemiology of the complete set of outbreaks was compared to a subset of outbreaks
with at least 25% of outbreak isolates having WGS and a further subset that had WGS
for 10 or more isolates totaling at least 25% of outbreak isolates. These cut-offs were
subset of case isolates within an outbreak with WGS and Pred-R data would be
representative of the whole outbreak case set.
Descriptive epidemiologic methods were used to characterize overall resistance
profiles of each outbreak including resistance patterns, resistance to individual
antimicrobial drugs or drug classes, and frequency of resistance by outbreak vehicle
type, and resistance discordance was examined at the isolate level. For each outbreak,
epidemiologic variables (as noted above) were compared between the full set of
outbreak isolates and the subset of isolates, which had been analyzed for resistance
using phenotypic (AST) and/or genotypic (WGS) predicted resistance testing.
Outbreak isolates were analyzed for resistance to the 13 antimicrobials in nine
CLSI drug classes that were part of the standard NARMS AST panel throughout the
entire study period (2015–2018). These include aminoglycosides (gentamicin,
streptomycin), beta-lactams/beta-lactamase inhibitor combinations
(amoxicillin-clavulanic acid), cephems (ceftriaxone, cefoxitin), folate pathway inhibitors
(sulfisoxazole, trimethoprim-sulfamethoxazole), penicillin (ampicillin), phenicols
(chloramphenicol), quinolones (ciprofloxacin, nalidixic acid), and tetracyclines
(tetracycline) (Table 1). Ceftiofur and meropenem were excluded because they were not
included over the complete study period. Ceftiofur was included in the NARMS AST
panel until 2015, and meropenem was added to the AST panel in 2016. An additional
aminoglycoside antibiotic, kanamycin, was included in the analysis because genetic
patterns of predicted resistance are included in Pred-R testing.
Outbreak resistance patterns were further compared based on the implicated
size of outbreaks linked to reptiles (11–102 cases) and the small number of isolates
sequenced in each outbreak (0–49), for the purpose of comparison by resistance
patterns, all reptile-associated outbreaks (i.e., gecko, turtle, snake) were compiled into
one category. This is in keeping with how public health interventions are described by
the CDC and other regarding reptiles and amphibians. Although dairy calves and guinea
pigs are both mammals, their husbandry (on farm vs. in homes or schools) is different
enough to warrant that these outbreaks be kept as distinct categories. Epidemiologic
variables were compared between cases with resistant and susceptible isolates. The
analysis was also stratified by the implicated vehicle or source type. Finally,
antimicrobial resistance patterns for isolates within each outbreak were examined in
regards to their position on the associated WGS tree (i.e., wgMLST or hqSNP) where
available.
3.4 Results
Outbreak Epidemiology
From 2015 to 2018 there were 33 multistate zoonotic outbreaks of enteric
non-typhoidal Salmonella investigated by the CDC Enteric Zoonoses Activity. One outbreak
traced to turtles in 2016 was excluded from further analysis because it contained four
distinct serotypes/PFGE patterns, a small number of isolates (n=6), of which only one
sample had whole genome sequencing performed. From the remaining 32 outbreaks,
23 outbreaks or 85.0% (2287/2691) of cases were linked to live poultry, seven
outbreaks or 12.6% (338/2691) of cases to reptiles (i.e., geckos, turtles, and snakes),
one outbreak or 2.1% (26/2691) of cases to dairy calves, and one outbreak or 0.4%
whole genome sequencing results, and 38.3% (n=1030) had either AST or WGS
performed to look for antimicrobial resistance.
Salmonella testing was performed on blood, urine and stool samples. From
64.5% to 100% of bacterial isolates were obtained through human stool samples
compared to blood (0–22.4%), urine (0–16.7%), and other (0–9.1%). Other sample
sources included rectal swab (n=7), wound (n=7), other (n=5), isolated organisms (n=3),
and 1 each of abscess, bone, gallbladder, peritoneal fluid, rectum, sputum, swab and
tissue.
Age data were available for between 91.7% and 100% of patients within each
outbreak. 46.9% of outbreaks had age data for all patients, and all outbreaks had age
data for more than 66% of their respective patients. Patients ranged from infants aged
<1 month to a maximum of 106 years. At the outbreak level, patient age ranged from
infants aged <1 month to one year, maximum age from 53 to 106 years, and median
patient age as low as one year and as high as 56 years.
Data on patient gender (male/female) were available for 90.0%–100% of patients
within each outbreak. Complete gender data was available in 28.1% of outbreaks, and
all outbreaks had data for more than 66% of their respective cases. From 41.5% to
81.8% of outbreak patients were female with women representing the majority in 65.6%
(21/32) of outbreaks.
Race and ethnicity data were only available from 34% (11/32) of outbreaks, in
which race was recorded for 5.6%–70.0% of patients, and ethnicity was recorded for
7.1–70.0% of patients. No outbreaks had complete race or ethnicity data. For outbreaks
33% of cases, and 18% (2/11) of outbreaks had racial data in more than 66% of cases.
For outbreaks where race was reported, 37.5 to 100.0% of cases were white and 0–
50.0% of cases were Black/African American. The remaining cases were from other
racial groups including American Indian/Alaska Native (n=2), Asian (n=4), Hispanic
(n=1), Latino (n=1), other (n=6), and Yemeni (n=1) (total = 15/177 available). Of
outbreaks where ethnicity data were available, 36% (4/11) of outbreaks had ethnicity
data in less than 33% of cases, and 9% (1/11) of outbreaks had ethnicity data in more
than 66% of cases. For outbreaks from which ethnicity was available (11/32 outbreaks;
221 cases) from 0–68.8% of cases were of Hispanic/Latino descent.
Hospitalization and death data were available for 31 of 32 of outbreaks and from
56.5–100% of cases depending on the outbreak. Complete data on hospitalization and
death were available from one outbreak each (3.1% of outbreaks). Reported health
outcomes (hospitalization and death) were available for greater than 66% of case
isolates in 90.6% of outbreaks. A total of 638 people were hospitalized, and the
proportion of hospitalization at the outbreak level varied from 12.5%–55.6%. Zero
deaths were reported in 81.3% (26/31) of outbreaks, one death was reported in 12.9%
(4/31) of outbreaks, and two deaths were reported in the remaining outbreak for a total
of 6 deaths reported overall. In the outbreak with two deaths, this resulted in an over
case fatality rate of 9.1%.
Data on case contact with the implicated animal were available for 31 of 32
outbreaks. Complete exposure data was available in only one outbreak, but 81.3% of
cases had known contact with the vehicle, and in the remaining 30 outbreaks, 33.3% to
100% of cases reported contact with the vehicle before becoming ill.
Comparison to subsets based on proportion of outbreak isolates with WGS
Eighteen outbreaks had WGS results for at least 25% of samples, of which 10
outbreaks or 78.8% (1121/1423) were linked to live poultry, six outbreaks or 16.6%
(236/1423) to reptiles, one outbreak or 3.9% (56/1423) to dairy calves and one outbreak
or 0.7% (10/1423) to guinea pigs (Table 2). 62.4% (888/1423) of isolates had AST
and/or WGS results. Of the 16 outbreaks that had WGS for at least 25% of samples and
had 10 or more isolates sequenced, nine outbreaks or 79.9% (1110/1390) of cases
were linked to live poultry, five outbreaks or 15.4% (214/1390) of cases to reptiles, one
outbreak or 4.0% (56/1390) of cases to dairy calves and one outbreak or 0.7%
(10/1390) to guinea pigs (Table 2). 62.9% (874/1390) had AST and/or WGS results.
When comparing the epidemiology of all outbreaks to the above subsets with
>25% WGS (n=18 outbreaks) and ≥ 10 isolates and >25% with WGS (n=16 outbreaks),
the only percentages that differed between the groups (32, 18, 16) were the maximum
age (106 years, 101 years, 101 years), maximum % hospitalized (55.6%, 55.6%,
47.6%), maximum % exposed to the vehicle (100%, 88.9%, 88.9%), minimum data
availability for hospitalization (56.5%, 61.1%, 61.1%) and death (56.5%, 61.1%, 61.1%)
and maximum data availability for hospitalization (100%, 94.7%, 94.7%) and death
(100%, 94.7%, 94.7%) (Table 3). Because epidemiologic variables were identical or
very similar between the complete group and subsets, the full data set was reviewed for
Epidemiologic Comparison between full case data to subset of isolates with antimicrobial resistance data
For the outbreaks in which more than 25% of the isolates were sequenced for
predicted (genotypic) resistance (n=18), the subset of patients with resistance data
within each outbreak were not substantively different from the full patient set. All
outbreak minimum ages were within 1 year (67% were identical), and 89% of maximum
and median ages were with 10 years of each other (67% and 17% were identical).
Outbreak level epidemiologic variables were within 10 percentage points in 89% of
outbreaks for the percent female, hospitalized, and exposed. 94% of outbreaks had
identical rates of death between the full set and subset with resistance data.
Of the remaining 14 outbreaks that did not meet that 25% sequenced threshold,
a further eight outbreaks had whole genome sequencing performed on 10–23% of
cases representing between three and 30 isolates. Between the full set and the subset
with resistance data outbreak level minimum ages were within one year for 75% of
outbreaks (three were identical), maximum ages were within 10 years for 50% of
outbreaks, and median ages were within 10 years for 88% of outbreaks. Outbreak level
epidemiologic variables were within 10 percentage points of each other for female in
38% of outbreaks, hospitalization in 38% of outbreaks, death in 100% of outbreaks, and
exposure in 50% of outbreaks.
Due to the minimal data available for race and ethnicity, these variables were not
compared or analyzed between the complete outbreak epidemiology and the subset
with resistance data. Even though outbreaks with less than 25% of isolates sequenced
were not as representative of the whole as the outbreaks with a larger percentage with
data on resistance patterns and resistance concordance between AST and WGS
results. These limitations were taken into account when interpreting the resistance
patterns.
Descriptive Epidemiology of Antimicrobial Resistance
From the 32 outbreaks associated with zoonotic salmonellosis 85.0% of cases
were from outbreaks linked to live poultry, 12.6% of cases were from reptile-associated
outbreaks, 2.1% of cases were from dairy calf-associated outbreaks, and 0.4% of cases
were from guinea pig-associated outbreaks (Table 4; Figure 1). Of the 16 outbreaks
where at least one isolate was found to have antimicrobial resistance, 11 were
associated with live poultry (n=1522, 86.8% of cases), three with reptiles (n=166, 9.5%
of cases), one with dairy calves (n=56 cases, 3.2% of cases), and one with guinea pigs
(n=10, 0.6% of cases) (Figure 1). Of the 10 outbreaks (n=599) where no isolates were
found to have antimicrobial resistance, seven were associated with live poultry (n=529,
88.3% of cases) and three were associated with reptiles (n=70, 11.7% of cases). Finally
of the 6 outbreaks (n=338) where antimicrobial susceptibility testing was not available,
five were associated with live poultry (n=236, 69.8% of cases) and one with reptiles
(n=102, 30.2% of cases).
Salmonella serotypes represented in outbreaks with documented resistance
included Braenderup, Enteritidis, Hadar, Infantis, I 4,[5],12:I, Indiana, Litchfield,
Mbandaka and Typhimurium in live poultry, Heidelberg in dairy calves, Agbeni,
Mbandaka, and Paratyphi B Var. L(+) Tartrate in reptiles, and Enteritidis in guinea pigs.
Indiana, Infantis, Mbandaka, Muenchen, and Muenster in live poultry-associated
outbreaks and Muenchen, Pomona, and Fluntern in reptile-associated outbreaks.
Of the 1030 isolated tested for antimicrobial resistance with AST or Pred-R,
19.2% (n=198) were resistant to at least one antimicrobial agent. Isolates from live
poultry-associated outbreaks made up 82.2% (n=847) of isolates tested and 71.7%
(n=142) of isolates with resistance; those from reptile-associated outbreaks made up
11.4% (n=117) of isolates tested and 4.0% (n=10) of resistant isolates; and guinea pig
isolates comprised 1.0% (n=10) of isolates tested and 0.5% (n=1) of antimicrobial
resistant isolates. In contrast isolates from dairy calf outbreaks were overrepresented
since they included 4.7% (n=48) of isolates tested and 24.1% (n=47) of isolates with
antimicrobial resistance. Overall 16.4% (139/847) of isolates from live
poultry-associated outbreaks, 6.8% (8/117) of isolates from reptile-poultry-associated outbreak, 97.9%
(47/48) of isolates from the dairy calf-associated outbreak, and 10.0% (1/10) of isolates
from the guinea pig-associated outbreak had documented resistance to at least one
antimicrobial agent (Table 4).
For each of the 13 antimicrobial drugs included in the NARMS AST panel
between 2015-2018, resistance to each drug was noted in four to eleven outbreaks
(median = 8) (Table 5). Of the 16 outbreaks where any type of resistance was
documented, resistance to azithromycin was noted in the smallest number of outbreaks
(4/16, 25%) and resistance to Streptomycin was noted in the most number of outbreaks
(11/16,68.8%). Two antimicrobial drugs, for which there are known resistance genes,
and which were also found in outbreak WGS data, were fosfomycin (n=1 outbreak) and
was predicted from WGS, AST results showed no phenotypic resistance because
fosfomycin is not part of the standard NARMS panel.
For the 16 outbreaks and 198 isolates demonstrating resistance to at least one
antimicrobial drug, there were 40 unique patterns of resistance to between one and
eleven antimicrobial drugs. The most common patterns were
ACSSuTAuCxFoxCip(I)Kan (n=30, 15.4% from three outbreaks), SSuGen (n=26, 13.3%
from 10 outbreaks), T (n=23, 11.8% from 10 outbreaks), AAuCxFox (n=22, 11.3% from
12 outbreaks), and SSuTGen (n=17, 8.7% from 8 outbreaks) (Table 6). The remaining
35 patterns were seen in one (0.5%) to eight (4.1%) isolates. All but one pattern (NalCip
= nalidixic acid, ciprofloxacin), which was found in both live poultry and
reptile-associated outbreaks, were unique to the implicated vehicle. Live poultry-reptile-associated
outbreaks included 28 unique resistance patterns, reptile-associated included four, dairy
calf-associated included nine, and guinea pig-associated included only one resistance
pattern (Table 6). 71.7% of isolates with documented resistance (13.8% of isolates
tested) demonstrated multidrug resistance (i.e., defined as resistance to three or more
antimicrobial drugs).
When broken down by frequency of resistance to each antimicrobial drug,
resistance to streptomycin (S) was the most prevalent among isolates with resistance
(126/198, 63.6%) followed by sulfisoxazole (Su) (117/198, 59.1%), tetracycline
(109/198, 55.1%), and ampicillin (88/198, 44.4%) (Figure 3.3). The antimicrobial drug
with the lowest prevalence of resistance was azithromycin (2% of isolates with
resistance) found only in live poultry and reptile outbreaks. When resistance to
farm animals (i.e., live poultry and dairy calves) show resistance to 12 and 13
antimicrobial drugs (including kanamycin) while outbreaks linked to pets (i.e., reptile and
guinea pig) show resistance to nine and three antimicrobial drugs respectively.
The outbreak involving dairy calves stands out from the other outbreak vehicles
in having isolates with both a diversity of resistance (12 different antimicrobial drugs,
eight of nine CLSI Drug Classes) as well as the high prevalence of resistance (over
70%) to 10 antimicrobial drugs (Figure 3.3). All resistant isolates (n=47) were resistant
to 4 antibiotics (i.e., streptomycin, sulfisoxazole, chloramphenicol, and tetracycline) and
46 of 47 were resistant to a further 4 antibiotics (ampicillin, amoxicillin-clavulanic acid,
ceftriaxone, and cefoxitin), Although outbreak isolates were all Salmonella serotype
Heidelberg, there were six distinct PFGE patterns with resistance patterns in the
outbreak compared to live poultry outbreaks, of which seven of eleven outbreaks with
antimicrobial resistance had only one PFGE pattern for the resistant isolates.
Resistant isolates from live poultry outbreaks showed the highest prevalence of
resistance to streptomycin (54.7%), sulfisoxazole (48.9%), tetracycline (43.9%) and
gentamicin (32.4%). In contrast, resistance among reptile outbreak isolates was the
highest for ciprofloxacin (75%) and nalidixic acid (75%). The single isolate with
resistance from the outbreak associated with guinea pigs showed resistance to
streptomycin, sulfisoxazole, and trimethoprim-sulfamethoxazole. While resistance to 11
of the 14 possible antimicrobials was found in isolates three of the four outbreak vehicle
types, resistance to kanamycin and azithromycin was found only in live poultry and
reptile-associated outbreaks, and resistance to gentamicin was only seen in live poultry
When the epidemiology of the resistant isolates was compared to the
non-resistant isolates, the maximum (89 yrs., 101 yrs.) and median (20 yrs., 25 yrs.) patient
age was lower in cases with resistant isolates, and the percent hospitalized and with
known exposure was higher in cases with resistant isolates (32.2%, 27.8% and 68.5%
vs. 56.0%) (Table 7). A lower proportion of resistant isolates were from blood (2.6% vs.
4.9%) and from females (52.7% vs. 55.5%). Although race and ethnicity differed, the
number with available data made it impossible to compare the two groups.
When comparing cases of live poultry-associated salmonellosis with resistant
isolates (n=142) to those with non-resistant isolates (n=713), those with resistant
isolates had lower maximum (83 yrs., 101 yrs.) and median (26.0 yrs., 28.0 yrs.) ages, a
lower proportion of females (49.6%, 55.4%), and a higher rate of hospitalization (33.3%,
25.2%) and reported exposure to the vehicle (69.4%, 56.3%) (Table 8). In
reptile-associated outbreaks of salmonellosis, cases with resistant isolates (n=8) had a higher
proportion of females (87.5%, 57.5%), a lower maximum (40 yrs., 100 yrs.) and median
(9.0 yrs., 13 yrs.) age, a lower hospitalization rate (0%, 46.4%), and a higher rate of
exposure to the vehicle (80.0% vs. 52.1%) than cases with non-resistant isolates
(n=109). No persons with resistant isolates died compared to one person with a
non-resistant isolate each for a live poultry and reptile-associated outbreak. A similar
comparison between resistant and susceptible isolates was not possible for guinea pigs
and dairy calves because there was only one resistant isolate from the guinea
pig-associated outbreak and only one susceptible isolate from the dairy calf-pig-associated
Whole Genome Sequencing Trees
The NARMS lab created WGS trees for 26 of 32 outbreaks (i.e., 24 hqSNP trees,
2 wgMLST trees). In addition, three samples from the 2015 outbreak of Salmonella
Hadar were included on the 2016 hqSNP tree of Salmonella Hadar because they were
highly related to the 2016 outbreak strains. In some WGS trees, antimicrobial-resistant
isolates were spread across clades, such as in the 2015–2017 outbreak of Salmonella
Heidelberg linked to dairy calves that had resistant isolates in both main clades. Clade
A isolates were 0–21 SNPs apart, and they were 15–39 SNPs apart from Clade B,
which included isolates 2–13 SNPs apart. In contrast, the 2017 live poultry-associated
outbreak of Salmonella Hadar, which had five clades, showed antimicrobial-resistant
isolates limited to clade E or after.
Of the 198 isolates for which resistance was documented through phenotypic
and genotypic testing, 44% (n=87) were included on the trees, and 56% (n=111) were
not included on the trees. During the Salmonella Litchfield outbreak associated with live
poultry in 2017, no WGS tree was requested; however, sequencing and resistance data
were available from patient isolates from this outbreak.
Resistance Concordance
Of the 116 samples with both AST and WGS results, 78% had identical
phenotypic and genotypic resistance profiles. The remaining 22% (n=26) of isolates
were found to have discordant antimicrobial resistance patterns for one (n=17), three
(n=5), four (n=3), or five antimicrobial drugs (n=1) that included amoxicillin-clavulanic
acid, azithromycin, chloramphenicol, fosfomycin, kanamycin, nalidixic acid,
occurred for more than one antimicrobial, an explanation was needed for each
discrepancy. An expert biostatistician in the CDC NARMS verified the reason for
discrepancies in 19 of these 26 isolates based on knowledge of AST panel versus WGS
Pred-R protocols and established characteristics of resistance determinance genes
bringing the rate of concordance up to 94% of isolates with both phenotypic and
genotypic resistance testing (KT, personal communication). In 18 isolates the predicted
resistance determinant found on WGS was not part of the standard NARMS AST panel
at the time of testing (fosfomycin, n=10, kanamycin, n=8). For the remaining isolates
antimicrobial resistance was documented on AST but not on the Pred-R because of the
presence of the novel gene dfrA34 (trimethoprim-sulfamethoxazole, n=8 isolates),
because the qnrB19 gene is not used to predict nalidixic acid resistance (n=6 isolates),
and on Pred-R but not on AST because a mutation in the floR gene caused a
nonfunctional gene product conferring no resistance to chloramphenicol (n=6 isolates).
The remaining seven discrepancies, representing 6.4% (7/109) of isolates with both
AST and WGS, have theorized reasons for discrepancies including a known
streptomycin mismatch between AST and Pred-R results due to lower specificity and
positive predictive value than other antibiotics (McDermott et al, 2016) (n=2),
susceptibility testing at the edge of the susceptible bell curve (n=2), and the possibility
of plasmid loss prior to testing or low coverage genes (n=3).
Discussion
Epidemiologic Trends
Regardless of vehicle type the minimum age in all outbreaks was aged <1 year,
seven months to 56 years, and in 28% of outbreaks (n=9), the median patient age was
<10 years, which suggests that parents and caregivers of young children are
appropriate targets for public health education and interventions (CDC, Information for
Health Care Professional and Laboratories, 2018). Since outbreak level maximum age
exceeded 65 years in 90% of outbreaks, the elderly should also be considered a
vulnerable group for zoonotic salmonellosis. These two groups (infants and individuals
aged >65 years) are known to be at increased risk of serious disease or complications
from Salmonella infections (CDC, Information for Health Care Providers, 2018). Since
the age demographic held true all animal vehicles of salmonellosis, public health
messaging regarding vulnerable groups can be consistent for zoonotic salmonellosis in
general.
Additionally, women were the majority of the patients in 66% of outbreaks, and
they continued to represent the majority of cases even after stratifying by the outbreak
vehicle. Although the 90% to 100% outbreak level data availability on gender made
conclusions possible, the lack of consistent racial and ethnicity data made it difficult to
draw any firm conclusions about overall trends; however, for the 34.4% of outbreaks
(n=11/32) in which racial data were available, the majority of cases reported being white
in all but 1 outbreak.
Data on health outcomes (i.e., hospitalization and death) were available for over
66% of patients in over 90% of outbreaks. Prevalence of hospitalization was as low as
12.5% and as high as 55.6% at the outbreak level, but at least 25% of patients were
hospitalized in 72% of all outbreaks. When stratified by outbreak vehicle,
higher rates of hospitalization than outbreaks associated with live poultry (28.9%) and
guinea pig (12.5%). This higher rate of hospitalization for reptile and dairy calf outbreaks
held true for outbreaks in which AST and WGS were carried out (n=26) regardless of
whether any isolates in the outbreak were found to have antimicrobial resistance.
Death occurred in 0.2% of the 2691 patients identified, of which five were in live
poultry outbreaks and one was in reptile-associated outbreak representing 0.3% and
0.4% of cases respectively. Given the relatively small number of cases associated with
dairy calves and guinea pigs compared to live poultry and reptiles, no conclusion about
trend can be made from this data.
Extent and persistence of outbreaks and pattern of outbreaks by vehicle type
Outbreaks associated with live poultry contact represented the majority (85.0%,
2287/2691) of patients over the study period compared to reptiles (12.6%), dairy calves
(2.1%) or guinea pigs (0.4%). This difference persisted for the subset of outbreaks that
had at least 25% of isolates sequenced (18 outbreaks, 78.8% linked to live poultry) and
those that had both more than 25% of isolates sequenced and a minimum of 10 isolates
sequenced (16 outbreaks, 79.2% linked to live poultry). Although not recorded in this
paper because the outbreak was ongoing during the data analysis phase, there was
another outbreak of live poultry-associated salmonellosis in 2018 involving a further 334
cases, 56 hospitalizations, and zero deaths, and the outbreak investigation of
Salmonella Heidelberg from 2015–2017 was also reopened in 2018 (CDC, Multistate
Outbreaks of Salmonella Infections Linked to Contact with Live Poultry, 2018). These
outbreaks were not included in this analysis because the data analysis including AST