Monica Ann Kuroki
A technical report submitted to the faculty at the University of North Carolina at Chapel Hill in partial fulfillment of the requirements for the degree of Master of Science in Environmental
Engineering in the Department of Environmental Sciences and Engineering in the Gillings School of Global Public Health.
Chapel Hill 2015
ABSTRACT
Monica Ann Kuroki: “Model Prediction of HAA9 Values for Chlorinated and Chloraminated Disinfection in Drinking Water Using ICR Data”
(Under the direction of Dr. Howard Weinberg)
prediction. Statistical analysis was framed in terms of a linear regression and intraclass
ACKNOWLEDGEMENTS
TABLE OF CONTENTS
LIST OF TABLES ……….. vi
LIST OF FIGURES ………. viii
LIST OF ABBREVIATIONS ………....xvii
SECTION 1: INTRODUCTION ……….... 1
1.1 Regulatory History………...1
1.2 Disinfection………... 6
1.2.1 Chlorine Treatment and Byproducts……….….. 7
1.2.2 Chloramine Treatment and Byproducts……….. 9
1.3 Disinfection Byproducts………...11
1.3.1 Trihalomethanes……… 12
1.3.2 Haloacetic Acids………... 14
1.4 ICR Database………... 16
SECTION 2: RESEARCH OBJECTIVES AND MODEL DEVELOPMENT ……… 19
2.1 Specific Objectives………...19
2.2 Hypotheses………... 20
2.3 Review of HAA3 Predictive Model………. 21
SECTION 3: METHODOLOGY AND PROCEDURES………...…... 25
3.1 ICR Dataset Information……….. 25
3.1.1 Data Acquisition………25
3.1.2 Data Clean Up………... 28
3.2 Prediction of HAA3, HAA9……… 31
3.3 Data Analysis………... 33
SECTION 4: RESULTS ………..………. 35
4.1 Results Summary………. 35
4.2 Comparing Measured, Predicted and Estimated HAA9 Values……….. 54
4.3 HAA3 to HAA9 Ratio………. 56
SECTION 5: DISCUSSION ………61
SECTION 6: CONCLUSIONS ………..………... 67
APPENDIX ……….. 68
A1. “Zero” Imputation………... 68
A2. “One-Tenth” Imputation………. 78
A3. “One-Fifth” Imputation………...88
A4. “One-Fourth” Imputation ………98
A5. “One-Half” Imputation………..108
B1. Histograms of Estimated HAA9 Concentrations for first filter data ……... 118
B2. Tables of HAA3 Concentrations with respect to total HAA9 concentrations for first filter data.………..….. 120
LIST OF TABLES
Table 1: DBPs regulated under Stage 2 D/DBP Rule………..……... 5 Table 2.1.1: Reporting limits for DBPs as provided in the ICR Database……… 20 Table 2.1.2: Assumed reporting limit for DBP groups………..…… 20 Table 3.2.1: Sample calculation concentrations taken from ICR database for
event id: 886102………..…..………. 32 Table 4.1.1: Percentile Distribution of Raw Data from ICR Database. “BRL”
indicates below reporting limit. Concentrations are measured in μg/L. ………... 37 Table 4.1.2: Statistical analysis table for measured, predicted and estimated HAA9
values in the ICR database considering all disinfection. ………..….41 Table 4.1.3: Demographic table for measured, estimated and predicted HAA9
values in the ICR database considering only chlorine disinfection. ………. 44 Table 4.1.4: Demographic table for measured, estimated and predicted HAA9
values in the ICR database considering only chloramine disinfection. ……… 47 Table 4.1.5: Demographic table for measured, estimated and predicted HAA9
values in the ICR database considering only combined disinfection. ……….. 50 Table 4.2.1: Summary of models according to R2
, ICC, mean difference,
standard deviation, error and standard error for samples using all disinfection methods……….. 54 Table 4.2.2: Summary of models according to R2
, ICC, mean difference,
standard deviation, error and standard error for samples using only chlorine disinfection……... 54 Table 4.2.3: Summary of models according to R2
, ICC, mean difference, standard deviation, error and standard error for samples using only
chloramine disinfection………..…..……….. 55 Table 4.2.4: Summary of models according to R2
, ICC, mean difference, standard deviation, error and standard error for samples using only
combined disinfection………..…..……… 55 Table 4.3.1: HAA3 concentration with respect to total HAA9 concentration
using all disinfection methods, final filter data. ………..………….. 57 Table 4.3.2: HAA3 concentration with respect to total HAA9 concentration
LIST OF TABLES
Table 4.3.3: HAA3 concentration with respect to total HAA9 concentration
using chloramine disinfection method, final filter data. ………..…..59 Table 4.3.4: HAA3 concentration with respect to total HAA9 concentration
using combined disinfection method, final filter data. ………..……60 Table B2.1: HAA3 concentration with respect to total HAA9 concentration
using all disinfection methods, first filter data.………..…………. .120 Table B2.2: HAA3 concentration with respect to total HAA9 concentration
using chlorine disinfection method, first filter data. ………..……. 121 Table B2.3: HAA3 concentration with respect to total HAA9 concentration
using chloramine disinfection method, first filter data.……….….. 121 Table B2.4: HAA3 concentration with respect to total HAA9 concentration
LIST OF FIGURES
Figure 1.3.1: THM Chemical Structures……… 12 Figure 1.3.2: HAA9 Chemical Structures……….. 15 Figure 4.1.1: Histogram for measured HAA9 values in the ICR database considering
all disinfection according to the final filter data……… 39 Figure 4.1.2: Histogram for predicted HAA9 values in the ICR database considering
all disinfection according to final filter……….. 39 Figure 4.1.3: Histogram of estimated HAA9 concentrations for all disinfection
methods according to final filter data ………40 Figure 4.1.4: Histogram for measured HAA9 values in the ICR database considering
only chlorine disinfection according to final filter data.……… 42 Figure 4.1.5: Histogram for predicted HAA9 values in the ICR database considering
only chlorine disinfection according to final filter data.……… 42 Figure 4.1.6: Histogram for estimated HAA9 values in the ICR database considering
only chlorine disinfection according to the final filter data. ………. 43 Figure 4.1.7: Histogram for measured HAA9 values in the ICR database considering
only chloramine disinfection according to the final filter data. ……… 45 Figure 4.1.8: Histogram for predicted HAA9 values in the ICR database considering
only chloramine disinfection according to the final filter data..……… 45 Figure 4.1.9: Histogram of estimated HAA9 concentrations for chloramine disinfection
method according to the final filter data. ……….. 46 Figure 4.1.10: Histogram for measured HAA9 values in the ICR database considering
only combined disinfection according to the final filter data……… 48 Figure 4.1.11: Histogram for predicted HAA9 values in the ICR database considering
only combined disinfection according to the final filter data……… 48 Figure 4.1.12: Histogram of estimated HAA9 concentrations for combined disinfection
LIST OF FIGURES
Figure 4.1.13: Measured versus predicted HAA9 values for all disinfection methods,
according to the final filter criteria. ……….. 51 Figure 4.1.14: Measured versus predicted HAA9 values for chlorine disinfection only,
according to the final filter criteria……….51 Figure 4.1.15: Measured versus predicted HAA9 values for chloramine disinfection
only, according to the final filter criteria………52 Figure 4.1.16: Measured versus predicted HAA9 values for combined disinfection
only, according to the final filter criteria………52 Figure A1.1: Measured versus predicted HAA9 values including
all disinfection methods, according to “raw” data……….68 Figure A1.2: Measured versus predicted HAA9 values including
chlorine disinfection method, according to “raw” data………. 69 Figure A1.3: Measured versus predicted HAA9 values including
chloramine disinfection method, according to “raw” data. ………... 69 Figure A1.4: Measured versus predicted HAA9 values including
combined disinfection method, according to “raw” data………... 70 Figure A1.5: Measured versus predicted HAA9 values including
all disinfection methods, according to first filtered data………... 70 Figure A1.6: Difference versus Mean of HAA9 values including
all disinfection methods, according to first filtered data………... 71 Figure A1.7: Measured versus predicted HAA9 values including
chlorine disinfection method, according to first filtered data……… 71 Figure A1.8: Difference versus Mean of HAA9 values including
chlorine disinfection method, according to first filtered data……… 72 Figure A1.9: Measured versus predicted HAA9 values including
chloramine disinfection method, according to first filtered data………72 Figure A1.10: Difference versus Mean of HAA9 values including
chloramine disinfection method, according to first filtered data………73 Figure A1.11: Measured versus predicted HAA9 values including
LIST OF FIGURES
Figure A1.12: Difference versus Mean of HAA9 values including
combined disinfection method, according to first filtered data………. 74 Figure A1.13: Measured versus predicted HAA9 values including
all disinfection methods, according to final filtered data………... 74 Figure A1.14: Difference versus Mean of HAA9 values including
all disinfection methods, according to final filtered data………... 75 Figure A1.15: Measured versus predicted HAA9 values including
chlorine disinfection method, according to final filtered data………75 Figure A1.16: Difference versus Mean of HAA9 values including
chlorine disinfection method, according to final filtered data………... 76 Figure A1.17: Measured versus predicted HAA9 values including
chloramine disinfection method, according to final filtered data………76 Figure A1.18: Difference versus Mean of HAA9 values including
chloramine disinfection method, according to final filtered data………77 Figure A1.19: Measured versus predicted HAA9 values including
combined disinfection method, according to final filtered data………..77 Figure A1.20: Difference versus Mean of HAA9 values including
combined disinfection method, according to final filtered data………..78 Figure A2.1: Measured versus predicted HAA9 values including
all disinfection methods, according to “raw” data………. 78 Figure A2.2: Measured versus predicted HAA9 values including
chlorine disinfection method, according to “raw” data………. 79 Figure A2.3: Measured versus predicted HAA9 values including
chloramine disinfection method, according to “raw” data. ………... 79 Figure A2.4: Measured versus predicted HAA9 values including
combined disinfection method, according to “raw” data………... 80 Figure A2.5: Measured versus predicted HAA9 values including
LIST OF FIGURES
Figure A2.6: Difference versus Mean of HAA9 values including
all disinfection methods, according to first filtered data………... 81 Figure A2.7: Measured versus predicted HAA9 values including
chlorine disinfection method, according to first filtered data……… 81 Figure A2.8: Difference versus Mean of HAA9 values including
chlorine disinfection method, according to first filtered data……… 82 Figure A2.9: Measured versus predicted HAA9 values including
chloramine disinfection method, according to first filtered data………82 Figure A2.10: Difference versus Mean of HAA9 values including
chloramine disinfection method, according to first filtered data………83 Figure A2.11: Measured versus predicted HAA9 values including
combined disinfection method, according to first filtered data………. 83 Figure A2.12: Difference versus Mean of HAA9 values including
combined disinfection method, according to first filtered data………. 84 Figure A2.13: Measured versus predicted HAA9 values including
all disinfection methods, according to final filtered data………... 84 Figure A2.14: Difference versus Mean of HAA9 values including
all disinfection methods, according to final filtered data………... 85 Figure A2.15: Measured versus predicted HAA9 values including
chlorine disinfection method, according to final filtered data………85 Figure A2.16: Difference versus Mean of HAA9 values including
chlorine disinfection method, according to final filtered data………86 Figure A2.17: Measured versus predicted HAA9 values including
chloramine disinfection method, according to final filtered data……….. 86 Figure A2.18: Difference versus Mean of HAA9 values including
chloramine disinfection method, according to final filtered data………87 Figure A2.19: Measured versus predicted HAA9 values including
LIST OF FIGURES
Figure A2.20: Difference versus Mean of HAA9 values including
combined disinfection method, according to final filtered data………..88 Figure A3.1: Measured versus predicted HAA9 values including
all disinfection methods, according to “raw” data………..88 Figure A3.2: Measured versus predicted HAA9 values including
chlorine disinfection method, according to “raw” data………. 89 Figure A3.3: Measured versus predicted HAA9 values including
chloramine disinfection method, according to “raw” data. ………... 89 Figure A3.4: Measured versus predicted HAA9 values including
combined disinfection method, according to “raw” data………... 90 Figure A3.5: Measured versus predicted HAA9 values including
all disinfection methods, according to first filtered data………... 90 Figure A3.6: Difference versus Mean of HAA9 values including
all disinfection methods, according to first filtered data………... 91 Figure A3.7: Measured versus predicted HAA9 values including
chlorine disinfection method, according to first filtered data……… 91 Figure A3.8: Difference versus Mean of HAA9 values including
chlorine disinfection method, according to first filtered data……… 92 Figure A3.9: Measured versus predicted HAA9 values including
chloramine disinfection method, according to first filtered data………92 Figure A3.10: Difference versus Mean of HAA9 values including
chloramine disinfection method, according to first filtered data………93 Figure A3.11: Measured versus predicted HAA9 values including
combined disinfection method, according to first filtered data………. 93 Figure A3.12: Difference versus Mean of HAA9 values including
combined disinfection method, according to first filtered data………. 94 Figure A3.13: Measured versus predicted HAA9 values including
LIST OF FIGURES
Figure A3.15: Measured versus predicted HAA9 values including
chlorine disinfection method, according to final filtered data………95 Figure A3.16: Difference versus Mean of HAA9 values including
chlorine disinfection method, according to final filtered data………96 Figure A3.17: Measured versus predicted HAA9 values including
chloramine disinfection method, according to final filtered data………96 Figure A3.18: Difference versus Mean of HAA9 values including
chloramine disinfection method, according to final filtered data………97 Figure A3.19: Measured versus predicted HAA9 values including
combined disinfection method, according to final filtered data………..97 Figure A3.20: Difference versus Mean of HAA9 values including
combined disinfection method, according to final filtered data………..98 Figure A4.1: Measured versus predicted HAA9 values including
all disinfection methods, according to “raw” data………. 98 Figure A4.2: Measured versus predicted HAA9 values including
chlorine disinfection method, according to “raw” data………. 99 Figure A4.3: Measured versus predicted HAA9 values including
chloramine disinfection method, according to “raw” data. ………... 99 Figure A4.4: Measured versus predicted HAA9 values including
combined disinfection method, according to “raw” data………. 100 Figure A4.5: Measured versus predicted HAA9 values including
all disinfection methods, according to first filtered data………..100 Figure A4.6: Difference versus Mean of HAA9 values including
all disinfection methods, according to first filtered data……….. 101 Figure A4.7: Measured versus predicted HAA9 values including
chlorine disinfection method, according to first filtered data……….. 101 Figure A4.8: Difference versus Mean of HAA9 values including
LIST OF FIGURES
Figure A4.9: Measured versus predicted HAA9 values including
chloramine disinfection method, according to first filtered data………. 102 Figure A4.10: Difference versus Mean of HAA9 values including
chloramine disinfection method, according to first filtered data………. 103 Figure A4.11: Measured versus predicted HAA9 values including
combined disinfection method, according to first filtered data………103 Figure A4.12: Difference versus Mean of HAA9 values including
combined disinfection method, according to first filtered data………104 Figure A4.13: Measured versus predicted HAA9 values including
all disinfection methods, according to final filtered data………..104 Figure A4.14: Difference versus Mean of HAA9 values including
all disinfection methods, according to final filtered data……… .105 Figure A4.15: Measured versus predicted HAA9 values including
chlorine disinfection method, according to final filtered data………. 105 Figure A4.16: Difference versus Mean of HAA9 values including
chlorine disinfection method, according to final filtered data………. 106 Figure A4.17: Measured versus predicted HAA9 values including
chloramine disinfection method, according to final filtered data……… 106 Figure A4.18: Difference versus Mean of HAA9 values including
chloramine disinfection method, according to final filtered data……… 107 Figure A4.19: Measured versus predicted HAA9 values including
combined disinfection method, according to final filtered data………...107 Figure A4.20: Difference versus Mean of HAA9 values including
combined disinfection method, according to final filtered data………...108 Figure A5.1: Measured versus predicted HAA9 values including
all disinfection methods, according to “raw” data………... 108 Figure A5.2: Measured versus predicted HAA9 values including
LIST OF FIGURES
Figure A5.4: Measured versus predicted HAA9 values including
combined disinfection method, according to “raw” data………. 110 Figure A5.5: Measured versus predicted HAA9 values including
all disinfection methods, according to first filtered data……….. 110 Figure A5.6: Difference versus Mean of HAA9 values including
all disinfection methods, according to first filtered data……….. 111 Figure A5.7: Measured versus predicted HAA9 values including
chlorine disinfection method, according to first filtered data……….. 111 Figure A5.8: Difference versus Mean of HAA9 values including
chlorine disinfection method, according to first filtered data………. 112 Figure A5.9: Measured versus predicted HAA9 values including
chloramine disinfection method, according to first filtered data………. 112 Figure A5.10: Difference versus Mean of HAA9 values including
chloramine disinfection method, according to first filtered data………. 113 Figure A5.11: Measured versus predicted HAA9 values including
combined disinfection method, according to first filtered data………... 113 Figure A5.12: Difference versus Mean of HAA9 values including
combined disinfection method, according to first filtered data………114 Figure A5.13: Measured versus predicted HAA9 values including
all disinfection methods, according to final filtered data……… 114 Figure A5.14: Difference versus Mean of HAA9 values including
all disinfection methods, according to final filtered data………. 115 Figure A5.15: Measured versus predicted HAA9 values including
chlorine disinfection method, according to final filtered data………. 115 Figure A5.16: Difference versus Mean of HAA9 values including
chlorine disinfection method, according to final filtered data………. 116 Figure A5.17: Measured versus predicted HAA9 values including
LIST OF FIGURES
Figure A5.18: Difference versus Mean of HAA9 values including
chloramine disinfection method, according to final filtered data……… 117 Figure A5.19: Measured versus predicted HAA9 values including
combined disinfection method, according to final filtered data……….. 117 Figure A5.20: Difference versus Mean of HAA9 values including
combined disinfection method, according to final filtered data………...118
LIST OF ABBREVIATIONS
AVG 1 first average residence time in the distribution system in ICR database
AVG 2 second average residence time in the distribution system in ICR database
ANOVA analysis of variance
Aux 1 primary auxiliary ICR database
BCAA bromochloroacetic acid
BDCAA bromodichloroacetic acid
BDCM bromodichloromethane
Br bromide
BrClAA/ BCAA bromochloroacetic acid BrCl2AA/BDCAA bromodichloroacetic acid
Br2AA/ DBAA dibromoacetic acid
Br2ClAA / DBCAA dibromochloroacetic acid
Br3AA / TBAA tribromoacetic acid
BRL below reporting limit
CHBrCl2 / BDCM bromodichloromethane
CHBr2Cl / DBCM dibromochloromethane
CHBr3 / TBM tribromomethane, or bromoform
CHCl3 / TCM trichloromethane, or chloroform
Cl/N chlorine to nitrogen ratio
LIST OF ABBREVIATIONS
Cl2AA /DCAA dichloroacetic acid
Cl3AA / TCAA trichloroacetic acid
CLM chloramine disinfection category ClO2
chlorite
ClO3
chlorate
CMB or CL2/CLM free chlorine with chloramine disinfection category
DBP disinfection byproduct
D/DBP disinfectant and disinfection byproduct
EPA Environmental Protection Agency (United States)
HAA haloacetic acid
HAA5 sum of five haloacetic acid species’ concentrations HAA6 sum of six haloacetic acid species’ concentrations HAA9 sum of nine haloacetic acid species’ concentrations
ICC Intraclass Correlation
ICR Information Collection Rule
ICR DSE from a distribution system site representing the residence time corresponding to the SDS incubation time in ICR database ICR FED ICR federal database system
ICR FIN at point of entry to the distribution system in ICR database ICR MAX from a distribution system site representing a relatively long
LIST OF ABBREVIATIONS
ICR SDS from a laboratory-simulated (incubated) distribution system sample point in ICR database
IDSE initial distribution system evaluation LRAA locational running annual average
MBAA monobromoacetic acid
MCAA monochloroacetic acid
MCL maximum contaminant level
MHAA monohaloacetic acid
mg/L milligrams per liter
μg/L micrograms per liter
MRL minimum residual level
NOM natural organic matter
NPDWR national primary drinking water regulations NSDWR national secondary drinking water regulations PPB parts per billion, equivalent to micrograms per liter PPM parts per million, equivalent to milligrams per liter R2
Pearson linear regression coefficient SDS simulated distribution system
SDWA Safe Drinking Water Act
TBAA tribromoacetic acid
TCAA trichloroacetic acid
LIST OF ABBREVIATIONS
THAA trihaloacetic acid
THM trihalomethane
THM4 sum of four trihalomethane species’ concentrations
TTHM total trihalomethane
TUXPLTMON monthly information for each water treatment plant including disinfection types and source water types in ICR database TUXSAMPLE sample information including location and date in ICR database TUXDBP quarterly DBP concentration results expressed in micrograms per
liter in ICR database
TUXANLYT recorded minimum reporting levels of DBPs in ICR database
Section 1:
INTRODUCTION
1.1 Regulatory History
Historically, drinking water utilities in the United States (U.S.) have played a major role in protecting the public health of its citizens through the reduction of waterborne diseases. As of 2008, 286 million Americans were receiving their tap water from a community water system (US EPA, 2008). The combination of conventional drinking water treatment and disinfection has proven to be one of the major public health advances in the last century.
concern with these is the unknown nature of newly created and unregulated DBPs. Chloramines, a popular choice for municipalities, are known to produce less of the regulated DBPs compared to chlorine but they produce other, mostly unknown DBPs with potentially higher or more chronic human health implications.
As of 2009, 118 predictive models (Chowdhury et al., 2009) existed for DBPs primarily focusing on those produced from chlorine disinfection. With the push for lower levels of regulated DBPs, several municipalities within the U.S. have switched, or are considering switching, to
disinfection with chloramines. At present, there exist both site-specific and generalizable models to predict regulated chlorine and chloramine DBPs. This project has identified a general HAA9 prediction model based on the U.S. Environmental Protection Agency’s (EPA) Information Collection Rule (ICR) Database and will evaluate how HAA9 DBP formation varies between chlorine, chloramine and combined disinfectant usage for disinfection. The ICR database was created in 1998-2000 to better understand water quality across the United States. Based on ICR data, Stage 2 of the Disinfectant/ Disinfection By-product (D/DBP) Rule was promulgated. Currently, the EPA has a maximum contaminant level (MCL) of 0.06 mg/L for the sum of monochloroacetic acid (MCAA), monobromoacetic acid (MBAA), dichloroacetic acid (DCAA), trichloroacetic acid (TCAA), and dibromoacetic acid (DBAA) constituting HAA5. The
these topics, it attempts to identify differences between the chosen disinfection methods and predict the number and concentrations of bromodichloroacetic acid (BDCAA),
dibromochloroacetic acid (DBCAA) and tribromoacetic acid (TCAA) constituting the HAA3 species.
The U.S. Public Health Service first enacted national drinking water standards in 1914 to regulate drinking water provided on common carriers. Over the years, several revisions were made to these standards with various levels of enforcement. In terms of disinfection regulation, the most important legislation began in 1974 when the Safe Drinking Water Act (SDWA) was signed into law. This Act was designed to “…assure that water supply systems serving the public met minimum national standards for protection of public health” by giving the EPA authority to (1) establish Federal drinking water standards for protection against all harmful contaminants in every public water system, (2) establish a joint Federal-State system that would assure
compliance with these standards and (3) protect underground sources of drinking water (Cox 1997). The SDWA was originally designed to enforce national primary drinking water regulations (NPDWRs) and non-enforceable national secondary drinking water regulations (NSDWRs). In 1979, the U.S. EPA issued a maximum concentration level (MCL) for
and added MCLs for additional DBPs. Among the HAA9s that can contain chlorine and
bromine, only five were included in this rule due to analysis challenges at the time. Compliance with the D/DBP rule was enforced beginning in January 2002. The Stage 1 D/DBP rule also included a requirement to use chemical coagulation and filtration to maximize removal of natural organic matter (NOM) through conventional water treatment plants. This requirement was based on the concept that reducing the concentration of NOM would reduce the amount of DBPs produced.
Table 1: DBPs regulated under Stage 2 D/DBP Rule.
By-product Regulatory Limit (mg/L) By-product of
Four Trihalomethanes (THM4): chloroform,
bromodichloromethane, dibromochloromethane, bromoform
0.080 Chlorine, chloramine,
combined
Five Haloacetic Acids (HAA5): Monochloroacetic acid,
dichloroacetic acid, trichloroacetic acid, monobromoacetic acid, dibromoacetic acid
0.060 Chlorine, chloramine,
combined
Bromate (BrO3
-) 0.010 Ozone
Chlorite (ClO2
1.2 Disinfection
This report summarizes the differences in HAA3 and ultimately HAA9 values according to different disinfection methods of chlorine, chloramines and combined treatment presented in the ICR database. Cases identified as chlorine used only chlorine as the disinfection method in the water treatment facility or distribution system. Method of chlorine administration, chlorine gas versus liquid/solid hypochlorite, was not utilized. Cases with disinfection method left null within the ICR database were considered chlorine for this analysis, as this is the predominant industry standard. Cases marked as chloramine utilized only chloramines in the water treatment facility or distribution system. Cases marked as combined treatment used any combination of chlorine or chloramines in the water treatment facility or distribution system. Several combined cases used chlorine in the water treatment system and chloramines throughout the distribution system. Disinfection methods were taken from the ICR database and matched through site ID to DBP levels. More information on this process can be found in sections 3.1-3.3 for procedures and methodology.
To understand and find significance in differentiating DBP formation by disinfection, the chemistry of disinfection must be explored. Since, historically the primary method of
1.2.1 Chlorine Treatment
In the U.S., chlorine has traditionally been used as the final disinfectant for most treated drinking water before it is discharged to the drinking water distribution system. Chlorine is a strong oxidant that is added to provide a disinfectant residual and protect against microbial
contamination. When added to natural waters, chlorine reacts with NOM and other constituents including ammonia in the water. Therefore, when considering dosage quantities, the operator must supply enough chlorine to meet the inherent demand from these and other reactions and still protect against microbial growth while assuring enough free chlorine residual to offer continuous protection throughout the distribution system. There are currently minimum residual disinfectant and MCL concentrations required by EPA regulations.
Chlorine can be applied to water in a variety of forms typically as a gas or as liquid/ solid hypochlorite. Chlorine gas, (Cl2), is a relatively inexpensive way to apply chlorine though it
reacts explosively with many other common substances and is hazardous to handle. When added to water, chlorine hydrolyzes producing hypochlorous and hydrochloric acids.
Cl2 +H2O ⇌HOCl+Cl -
+H+
(Equation: 1.2.1)
Hypochlorous acid further dissociates to hypochlorite ion and free hydrogen. This dissociation is reversible and pH driven.
HOCl ⇌H+
+ OCl
(Equation 1.2.2)
A second form of chlorine addition is via hypochlorite, which reacts with water to form the same active species, HOCl that was formed with chlorine gas.
NaOCl+H2O ⇌ HOCl+Na +
+OH
(Equation 1.2.3)
For both equations, HOCl reacts with the various components of chlorine demand as follows: HOCl + Cldemand → products (Equation 1.2.4)
The overall equation simplified for byproducts is:
Precursors + chlorine à byproducts (Equation 1.2.5)
Encompassed in equation 1.2.4, is that chlorine is consumed by reaction with a variety of materials through oxidation and substitution mechanisms. These include NOM, ammonia and bromide represented as precursors in equation 1.2.5. Byproducts of chlorination formed at the highest levels are usually THMs and HAAs. These form simultaneously when chorine reacts with NOM but ideal conditions for THM formation are different than those for HAAs. It is believed that THMs are base catalyzed, meaning the reaction is catalyzed by hydroxide ions in the water and, therefore, proceeds faster at more alkaline pH (Rook, 1977). HAA formation is enhanced under acidic conditions. Therefore, pH will directly influence the extent to which THM or HAA formation is favored. Currently regulated THM and HAA compounds have known cancer risks as well as other acute and chronic effects on human health. Only a limited number of DBPs have been studied for adverse health effects because such studies are extremely expensive (Krasner, 2006).
case that bromide is present in the influent water, bromide rapidly reacts to produce
hypobromous acid that is also a disinfectant and can also react with NOM to produce bromine-containing DBPs. Factors that influence DBP production from chlorine include organic carbon concentration and type, disinfectant dosage, contact time, pH, bromide concentration and temperature. Chlorine disinfection still has associated unregulated DBPs that depend on the source water carbon content. These unregulated DBPs are not currently evaluated in most predictive models because concentrations can occur at or below non-detect levels. It is the goal of this technical report to estimate levels of a subset of these, namely the unregulated HAA3.
1.2.2 Chloramine Treatment
Although chlorine has been primarily used to disinfect drinking water for over 100 years within the United States, there have been concerns raised over the toxicity of its DBPs. Because of these concerns and in combination with increased U.S. EPA DBP regulations, there has been an
interest in chloramine disinfection. Chloramine is a popular alternative as it is effective at
deactivating microorganisms but forms lower levels of the regulated chlorine-producing DBPs of concern such as THMs and HAAs. This key difference of lower known DBP concentrations often overshadows the concerns of chloramine DBPs. There has been much discussion as to the several unintended consequences of switching to chloramine including possible nitrification in distribution systems and the formation of nitrogenated DBPs that some researchers have suggested to be more cytotoxic than those currently regulated (Muellner et al., 2007, 2010). When compared to chlorine, chloramine DBPs are much less studied and, therefore, have less information available. To understand DBPs produced by chloramine, the chemistry of
Chloramines exist in the form of monochloramines (NH2Cl), dichloramine (NHCl2) and
trichloramine (NCl3). Monochloramines are the predominant chloramine species produced in
typical drinking water treatment. Monochloramine has the same oxidizing capacity as free chlorine on a chlorine atom basis, but it is a weaker disinfectant. (Wolfe et. al., 1984).
Chloramine is created from the reaction of ammonia and hypochlorous acid. NH3 + HOCl ⇌ NH2Cl + H2O (Equation 1.2.6)
The addition of ammonia uses up the “free” chlorine available in HOCl to produce chloramines. Because of this reaction, the reaction of HOCl with NOM creating DBPs is slowed down due to the lessened availability of “free” chlorine. Generally speaking, the larger the chlorine to
nitrogen (Cl/N) ratio, the faster the oxidation of ammonia (Vikesland et al., 2001) and the less contact time there is between free chlorine and its DBP precursors. Since the focus of this report is on regulated DBPs significant detail about the continued decay of chloramine will not be presented.
NH2Cl + HOCl à NHCl2 + H2O (Equation 1.2.7)
NHCl2 + HOCl àNCl3+ H2O (Equation 1.2.8)
As seen in equations 1.2.7 and 1.2.8 the free chlorine (HOCl) can be depleted by the ammonia and chloramine sub-products if the appropriate stoichiometry is applied. This means that if only monochloramine is the desired end product, the chlorine dose must be carefully controlled. In practice, chlorine is often added to the water stream first and then ammonia is dosed at the appropriate ratio to ensure that equations 1.2.7 and 1.2.8 do not occur.
1.3 Disinfection Byproducts
Since their discovery in the 1970s, disinfectant byproducts (DBPs) have been a major concern for regulators, water utilities and the public due to their associated carcinogenic risk and potential adverse health outcomes. Currently, the two highest occurring DBP groups by weight and prevalence are THMs and HAAs, which occur in both chlorinated and chloraminated
1.3.1 Trihalomethanes
THMs are formed during the disinfection process when a chlorine-containing disinfectant
combines with organic matter in the water forming DBPs. THMs are organic compounds named as a derivative of methane. The regulated THM DBPs are: trichloromethane commonly referred to as chloroform, dibromochloromethane, dichlorobromomethane and tribromomethane referred to as bromoform. The 5-iodinated THMs species are not currently regulated. The regulated THM DBPs have a MCL of 0.08 mg/L. THMs have been associated with cancer risk particularly chloroform and dibromochloromethane which has a B2 rating of probably human carcinogen based on sufficient laboratory evidence and C rating of possible human carcinogen respectively. Chloroform has been associated with cancer, liver, kidney and reproductive effects.
Dibromochloromethane has been associated with effects on the nervous system, liver, kidney and reproduction. (US EPA, 1999b). THMs are colorless, volatile, dissolve easily in water and are fairly stable.
Figure 1.3.1: THM chemical structures. From left to right: chloroform (CHCl3),
bromodichloromethane (BDCM), chlorodibromomethane (CDBM), and bromoform (CHBr3).
Images taken from: Becker et al. “Guidance on Complying with Stage 2 D/DBP Regulation”
Chemical structures for THM4 can be seen in figure 1.3.1. THMs are found at low
concentrations in most disinfected waters and are primarily created through the process of chlorine disinfection. THM formation may be seen in chloramine processes when chloramines are created through chlorine disinfection followed by the addition of ammonia. THM control focuses primarily on removal of THM precursors, reduction of oxidant demand (NOM) and corresponding reduction of dosage applied, optimization of disinfection process and influent water quality. When examining influent water quality, the amount and type of NOM present as well as the amount of bromide will affect the types of THMs produced. Research has shown that in general THM formation increases with an increase in pH but the effects are reversed for HAA5. Temperature additionally has a positive effect on DBP formation as it increases the rate of reaction (Amy et al., 1987a, US EPA, 2001b).
1.3.2 Haloacetic Acids
HAAs are a result of the disinfection process. There are nine HAA species, five of which are currently under DBP regulation. The nine HAAs are: monochloroacetic acid (MCAA), dichloroacetic acid (DCAA), trichloroacetic acid (TCAA), monobromoacetic acid (MBAA), dibromoacetic acid (DBAA), bromochloroacetic acid (BCAA), bromodichloroacetic acid
Figure 1.3.2: HAA9. Top row: Monochloroacetic acid, monobromoacetic acid. Middle row: dichloroacetic acid, bromochloroacetic acid, dibromoacetic acid. Third row: trichloroacetic acid, bromodichloroacetic acid, dibromochloroacetic acid, tribromoacetic acid. Images taken from: Becker et al. “Guidance on Complying with Stage 2 D/DBP Regulation” Water Research
Foundation, 2013.
HAAs are not typically found in natural water sources but are of anthropogenic creation through disinfection. HAAs are created when disinfectants react with NOM, such as humic acids from decaying vegetation. HAAs have been linked to surface water supplies. HAA formation can be controlled through removing HAA precursors, reducing the oxidant demand (NOM) and dosage of disinfectant, influent water quality and optimization of the disinfection process. HAA
1.4 ICR Database
Water suppliers, environmental groups consumer groups and regulatory agencies agreed to the Information Collection Rule (ICR) after implementation of Stage 1 of the D/DBP Rule. The ICR collected data from 296 public water systems across the United States serving at least 100,000 people from July 1997 to December 1998 generating the largest database of DBP field data ever assembled. The EPA is responsible for storage and management of this data. According to the EPA, “these very large systems have invested collectively over $100 million in extensive new information on the occurrence of pathogens and disinfection byproducts.” (US EPA, 2011) Information collected from the ICR was utilized and considered for promulgation of Stage 2 D/DBP. Access to the ICR data was first fully available in 2002 and can be acquired currently through request from the EPA. The database consists of 38 tables stored within Microsoft Access 97. Source water quality, treatment information and microbial pathogen occurrence data were collected monthly whereas DBA data was collected quarterly. The data of specific interest to this report include individual DBP levels as well as THM4, HAA5, HAA6 and HAA9 values.
Because of increased usage of chloramines and combined chlorination across utilities in the U.S., this study takes advantage of the ICR data to develop a better picture of HAA9 concentrations for these specific disinfection methods. Currently, the US EPA requires the regulation of THM4 at 0.08 mg/L and HAA5 at 0.06 mg/L. However, there are growing concerns that HAA5
accuracy. This information will provide a more accurate picture of HAA9 occurrence nationwide.
Section 2:
RESEARCH OBJECTIVES AND MODEL DEVELOPMENT
2.1.1 Specific Objectives
The specific objectives of this study are three-fold. The first objective was to utilize a previously created model (Roberts et al. 2002) to predict HAA3 and HAA9 values on a national scale in terms specifically of chlorination, chloramination and combined chlorination-chloramination disinfection. The second objective of this study was to evaluate the significance of below reporting limit value imputation. The third objective of this study examined the relationship between HAA3 and HAA9 values. Because of the greater toxicity of HAA3 and HAA4
Table 2.1.1: Reporting limits for DBPs as provided in the ICR Database.
Unit of Measurement
Minimum Reporting
Level Analyte Name
Abbreviated Name μg/L 1 Chloroform CHCl3 μg/L 1 Bromodichloromethane BDCM μg/L 1 Dibromochloromethane DBCM μg/L 1 Bromoform CHBr3 μg/L 2 Monochloroacetic Acid MCAA μg/L 1 Dichloroacetic Acid DCAA μg/L 1 Trichloroacetic Acid TCAA μg/L 1 Monobromoacetic Acid MBAA μg/L 1 Dibromoacetic Acid DBAA μg/L 1 Bromochloroacetic Acid BCAA μg/L 1
Bromodichloroacetic
Acid BDCAA
μg/L 2
Chlorodibromoacetic
Acid CDBAA
μg/L 4 Tribromoacetic Acid TBAA
Table 2.1.2: Assumed reporting limit for DBP groups.
Unit of Measurement
Minimum Reporting
Level Analyte Name
Abbreviated Name
μg/L 1
4 Regulated
Trihalomethanes THM4
μg/L 2
5 Regulated Haloacetic
Acids HAA5
μg/L 2 6 Haloacetic Acids HAA6
μg/L 4
3 Unregulated Haloacetic
Acids HAA3 μg/L 4 Total Haloacetic Acids HAA9
2.2 Hypotheses
The primary hypotheses of this research mirror the objectives. The first hypothesis of this study assumes there will be predictive differences between HAA9 values in terms of specific
with chlorine only disinfection, underestimated for chloramine disinfection and underestimated for combined treatment. The model utilized predicts HAA9 values on the principles of chlorine chemical disinfection. Therefore, application to chloramination or combined treatment will not accurately predict HAA9 concentrations. The second hypothesis is that the use of zero as a imputation value for below reporting limits will be invalid and the model will find more success including a larger imputation value. The final hypothesis assumes the proportion of HAA3 to HAA9 concentrations will be low compared to that of HAA6 but that concentrations alone are insufficient predictors of risk to human health.
2.3 Review of HAA3 Predictive Model
Roberts et al. (2002) developed the HAA3 predictive model for the ICR database that is utilized for this report. This model utilized studies of brominated THM species (Krasner et al., 1989), HAA species (Cowman & Singer, 1996) and NOM precursors (Reckhow et al., 1990; Reckhow & Singer, 1985) and hypothesized that each trihalogenated HAA3 species would form in the same proportion with respect to TCAA as their brominated THM counterpart formed with respect to CHCl3. Though this relationship does not fully encompass the chemical mechanisms,
this relationship has proven success in HAA predictions. The model equations can be seen in equations 2.3.1 to 2.3.3.
[DCBAA] / [TCAA] = [DCBM] / [CHCl3] (Equation 2.3.1)
[DBCAA] / [TCAA] = [DBCM] / [CHCl3] (Equation 2.3.2)
[TBAA] / [TCAA] = [CHBr3] / [CHCl3] (Equation 2.3.3)
This current study differs from Roberts et al. (2002) in the following manner: (i) it analyzes all data available in the ICR database over the 18-month collection period, (ii) this study compares chlorinated, chloraminated and combined disinfection treatments to determine if there is
applicability of this model for particular disinfectants, (iii) BRLs are addressed through the imputation of various values, and (iv) this study determines what proportion of HAA9 the predicted HAA3 comprise for determining significance of findings to public health.
Shortcomings of this model include over generalization by considering all disinfection methods as well as assuming a zero Imputation for all valuables measured below reporting limit. While this model was novel at the time it was published, utilities are now searching for the disinfection system that will work best for their given influent water quality while meeting regulatory
Section 3:
METHODOLOGY AND PROCEDURES
3.1 ICR Dataset Information
AUX1, which is the primary database used to store ICR DBP data, was used for this study. Data was collected from 296 public water systems, each serving at least 10,000 people from July 1997 to December 1998 (18 months). In 2002, a model was developed and published by Roberts et al. (2002) and the American Water Works Association based on the available first 12 months of collected data to estimate HAA3 values. This model has been replicated and applied for this study to examine the complete 18 months of data collection. The entire ICR collection became available for public access at the end of 2002 and was chosen for this study because of its large applicability across the U.S. as well as wealth of data.
3.1.1 Data Acquisition
with help from Patrick Kiernan of the UNC- Chapel Hill IT department. The updated ICR Auxiliary 1 database has been provided to Dr. Howard Weinberg in a Microsoft Access 2010 edition for future usage.
Since this model is an application of the Robert et al.’s 2002 model, it follows the same methodology with slight modifications. Data for this study utilized 4 tables from AUX 1: TUXPLTMON which contained monthly information abut each water treatment plant including disinfection types and source water types, TUXSAMPLE which provided sample information including location and date, TUXANLYT which recorded minimum reporting levels of DBPs and TUXDBP which measured quarterly results expressed in micrograms per liter. Each DBP result in AUX 1 represented one DBP species concentration from one sampling event. A matching function was run through Microsoft Excel for Mac 2011 to match individual DBP samples with sampling events from TUXDBP to TUXSAMPLE. An additional match function was run between TUXSAMPLE and TUXPLTMON to identify the specific plant identification number each sample was taken at. This was done in order to identify disinfection method with sample identification. A third match was run to link DBP identification to sampling identification and disinfection. Within the 18-month span of collection 18,215 samples with DBP data were taken, 65,534 sample identifications created and 9,152 monthly treatment plant identifications recorded. Data that could not be associated with a particular plant were excluded.
sample point (ICR SDS), from a distribution system site representing the residence time corresponding to the SDS incubation time (ICR DSE) and from a distribution system site
representing a relatively long detention time (ICR MAX). Roberts et al. (2002) included AVG 1, AVG 2, FIN, SDS and DSE data to examine TTHM and HAA relationships because they felt this represented average DBP concentrations. For this sample, extreme points were included in the analysis. While research has indicated that HAAs may decay with long detention times (Chen and Weisel, 1998; Rossman et al., 2001), this report hoped to create realistic and practical HAA3 projections for utilities. Long detention times were included in this study under the assumption it is unlikely utilities will be able to easily identify and remove all long detention time samples from their database when running models.
The Roberts et al. (2002) model utilizes all disinfection types found in the ICR database (free chlorine, combined chlorine, chloramine, chlorine dioxide, ozone); thus, the model created is for a general application. This report looks only at chlorine, chloramine and combined disinfections. Disinfection is recorded within water treatment plant and also within the distribution system. Samples classified as chlorine utilized chlorine only in the distribution system or within the treatment plant or both. Samples classified as chloramine utilized only chloramine within the distribution system, treatment plant or both. Samples classified as combined used any
3.1.2 Data Clean Up
The first task in this current study once the ICR database was recovered was to clean up the data to fit the parameters of the project objectives. Of the 18,215 samples with DBP data, 7.2% (1,306) were removed by filtering as plants utilizing ozone (563) or chlorine dioxide (603). Samples that could not be identified to a particular disinfection type (143) were removed in order to maintain the integrity of the disinfection specific model. Models that did not list a disinfection method (298) were assumed by the researcher to be chlorine treated since chlorine is the industry standard. After filtering for non-identifiable disinfection, there were 16,906 samples for chlorine, chloramine and combined treatments. Of these remaining samples, 71.8% (12,138) were treated by chlorine, 4.5% (756) chloramine and 23.7% (4,012) combined.
TUXDBP recorded individual measurements for CHCl3 (14,937), BDCM (15,088), DBCM
(15,053), CHBR3 (15,049), TCAA (15,019), DCAA (15,115), MCAA (14,473), BCAA (15,108),
utilizes three variables at a time, only these five below reporting limit imputations impacted the HAA3 and HAA9 estimates.
Once the data was processed and linear regressions calculated for all disinfection methods at various non-detect limits, a trend was noticed across all models of outlier points. These outliers created largely inaccurate prediction points based on the measured HAA9 values. Outliers were removed according to two filters. Data displayed as “raw” indicates no points removed for filters, “first filter (1)” indicates that a first set of criteria was used to remove 9 points and “final
removal filter (2)” indicated both criteria were used and 14 points removed total.
Among the 5 models, there were 5 outlier samples for all models. These samples were identified with 4 of the 5 taken from the Huntsville, Alabama Utilities Water System. This utility was reinvestigated to see if the samples in question were valid. After analysis of all samples collected from the Huntsville, Alabama plant, these 4 samples were removed from this analysis due to inconsistency with the locational patterns. Huntsville, Alabama samples consistently exhibited high chloroform and THM4 values. These four identified samples were marked as below the non-report limit for chloroform while the sum of THM4 remained high. Due to inconsistency, these 4 samples were removed. Additionally, these samples were marked by the utility as “low” confidence for accuracy in measurements. The 5th
All models with the exception of the “0” imputation value had 9 additional outliers. The “0” imputation did not see these additional outliers because based on the prediction model, an imputation of “0” was evaluated in the numerator thus the estimate goes to “0”. These 9 values were separated into a group of 4 and group of 5 samples based on impact according to Pearson linear regression fit (R2
) for the model and geographic sampling locations.
The group of 4 samples were taken from 4 different utilities: Three Valleys Municipal Water District, California; City of Corpus Christi, Texas; City of Scottsdale, Arizona; City of Modesto, California. These samples were identified and cross-referenced with supporting samples from the locations of interest. These samples were all identified as outliers due to their inconsistency with site patterns. These locations all reported typically very high chloroform and THM4 values. These four locations had only one sampled instance of below reporting limit readings for chloroform, which were each the sample of interest, while THM4 values remained high. From this trend, these samples were removed due to their inconsistencies. These four sites, in addition to the previously described five sites from Kansas and Alabama were considered the “first” filter for removal.
limit measurements for chloroform with THM4 values still very high. The City of Anaheim recorded below reporting values for chloroform in two samples that still remained high in THM4 concentrations. Therefore, from this pattern of inconsistency, these 5 samples were removed from analysis. The last 5 outliers, in addition to the original 9 outliers, were removed as the “final” filter.
3.2 Prediction of HAA3, HAA9
TUXDBP provided DBP concentrations in micrograms per liter. Analyses of interrelationship between DBPs were conducted in molar concentrations because of the different halogen contents of DBP species and different atomic weights. DBP concentrations were converted to micromoles per liter using Microsoft Excel for Mac 2011. Rearrangement of equations 1.3.1-1.3.3 can be seen as follows:
[DCBAA] = [BDCM] * ([TCAA] / [CHCl3] ) (Equation 3.2.1)
[DBCAA] = [DBCM] * ([TCAA] / [CHCl3] ) (Equation 3.2.2)
[TBAA] = [CHBr3] * ([TCAA] / [CHCl3] ) (Equation 3.2.3)
Table 3.2.1: Sample calculation concentrations taken from ICR database for event id: 886102. [CHCl3]= 26 μg/L = 0.218 μmoles
[DBCM] = 20 μg/L = 0.096 μmoles [TCAA] = 7.5 μg/L = 0.046 μmoles
[DBCAA] = [DBCM] * ([TCAA] / [CHCl3]) (Equation 3.2.2)
[DBCAA Estimate] = [0.096] * ([0.046] / [0.218]) (Equation 3.2.4)
Using equations 3.2.1-3.2.3, values of individual HAA3 species were predicted in micromolar (μmolar) concentrations of individual HAA3 values. Samples having null or missing values for required DBP parameters were excluded from these calculations. Since HAA3, HAA5, HAA6 and HAA9 are additive, cumulative measurements, molar concentrations of individual species were converted back into micrograms per liter and added. Though all DBPs had imputations, only the DBPs involved in Equations 3.2.1-3.2.3 were influential in the prediction of HAA3. Recorded HAA5 and HAA6 values were used as a base value. If HAA6 values were not
3.3 Data Analysis
Data Analysis used Microsoft Excel for Mac 2011 and StatPlus Analysis Toolkit Version 2009 for Mac. Histograms were created to visually display the distribution of measurements and estimates. Pearson linear regressions (R2
) were calculated for all model scenarios comparing measured HAA9 (n=3,214) values against their model predicted HAA9 values (n=3,214). Histograms were also generated for HAA9 estimates that did not have measured values (n=13,825). Analysis was done using a 95% confidence interval on data. ANOVA was calculated for all model scenarios comparing measured HAA9 and predicted HAA9 values. ANOVA analysis was run on 95% confidence interval. Intraclass correlation (ICC) was calculated to determine the variance amongst and between groupings.
Section 4:
RESULTS
4.1 Results Summary
The results of this report were analyzed using Microsoft Excel for Mac 2011 and StatPlus Analysis Toolkit Version 2009 for Mac. Pearson linear regression and mean graphs can be seen for each model in terms of below detection limit imputation value, disinfection and removal criteria within this report’s results. Differences versus mean graphs were calculated by defining the difference as the predicted HAA9 minus measured HAA9 value. This graph displays the precision of generated predictions without measured values can be given. Differences versus mean graphs were not calculated for “raw” data, as the gaps were quite large. A summary segment has been created and displayed for ease of reviewing due to the plethora of models created under various criteria. All models created can be viewed in the Appendix. It is suggested the individual results be reviewed for a firmer grasp of data values according to imputation value and disinfection.
below reporting limit. All DBPs have the at least 10% of measurements recorded as below reporting limits whereas MBAA and TBAA have over 75% so recorded. Because the ICR database holds a specific time frame of collected samples, they are unique and cannot be repeated or re-sampled. DBPs are generally present in the disinfection process and therefore substituting a zero for a non-detectable value is likely an underestimation. Based on the
prevalence of below reporting limit values for HAA3 components, this study is valuable in terms of identifying a best imputation value for these below reporting limit measures for better
Table 4.1.1: Percentile Distribution of Raw Data from ICR Database. “BRL” indicates below reporting limit. Concentrations are measured in μg/L.
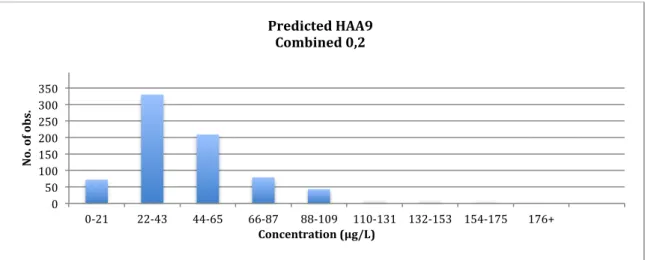
Histograms have been created to view the spread of measured, predictive and estimated HAA9 values. For reference, measured values were extracted from the ICR database. Predicted values were calculated utilizing equations 3.2.1 to 3.2.3 in cases where measured data was available to confirm model accuracy. Estimates were calculated utilizing equation 3.2.1 to 3.2.3 for samples that did not have measured HAA9 values. Based on the histograms shown in figures
4.1.1-4.1.12, the data appears to be log-normally distributed for all disinfection types. Histograms have only been created for “0” values measured as below reporting limits because, based on the non-detect limit imputation values and histogram “bins”, the histogram shape would appear the same. These histograms display final filtered data. Values on the histogram x-axis indicate the range of the histogram bin representative of concentration in μg/L.
Figure 4.1.1: Histogram for measured HAA9 values in the ICR database considering all disinfection according to the final filter data. (n=3,209)
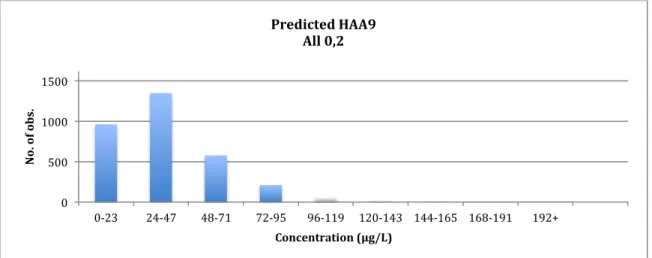
Figure 4.1.2: Histogram for predicted HAA9 values in the ICR database considering all disinfection according to final filter. (n=3,209)
0 500 1000 1500
0-‐23 24-‐47 48-‐71 72-‐95 96-‐119 120-‐143 144-‐165 168-‐191 192+
N
o.
o
f o
b
s.
Concentration (μg/L) Measured HAA9
All 0,2
0 500 1000 1500
0-‐23 24-‐47 48-‐71 72-‐95 96-‐119 120-‐143 144-‐165 168-‐191 192+
N
o.
o
f o
b
s.
Concentration (μg/L) Predicted HAA9
Figure 4.1.3: Histogram of estimated HAA9 concentrations for all disinfection methods according to final filter data. (n=13,825)
Table 4.1.2 displays the statistical analysis for measured, predicted and estimated HAA9 values considering all disinfection treatments. There are many more estimates than measured and predicted samples because under ICR data collection instruction, utilities were not required to measure HAA9. Therefore, any measured HAA9 samples were provided voluntarily by utilities, which likely were considering or had already undergone systematic upgrading to manage DBP formation. Measured and predicted values mirror strongly with each other although predicted values are slightly higher than measured values. Estimated values have the same mean and median values; however, there are significantly higher variance and maximum values indicating high outlier points. This spread of HAA9 concentrations indicates that some utilities that did not report these values have exceedingly high HAA9 concentrations. The majority are, however, similar to measured and predicted values.
0 1000 2000 3000 4000 5000 6000 7000
0-‐37 38-‐75 76-‐113 114-‐151 152-‐189 190-‐227 228-‐265 266-‐303 304+
N
o.
o
f o
b
s.
Concentration (μg/L) Estimated HAA9
Table 4.1.2: Statistical analysis table for measured, predicted and estimated HAA9 values in the ICR database considering all disinfection strategies.
Units Measured Predicted Estimated
Number of samples - 3,209 3,209 13,825
Mean (μg/L) 27.0 27.5 27.1 Mean Lower Control
Limit (μg/L) 26.1 26.6 26.7
Mean Upper Control
Limit (μg/L) 27.8 28.4 27.6
Standard Deviation (μg/L) 25.0 25.5 28.1
Minimum (μg/L) 0 0 0
Maximum (μg/L) 190.6 190.5 290.6
Geometric Mean (μg/L) 14.5 14.5 11.8
Median (μg/L) 22.6 23.0 21.6
25% Median Value (μg/L) 9.0 8.5 1.5
75% Median Value (μg/L) 37.0 39.2 41.6
Figure 4.1.4: Histogram for measured HAA9 values in the ICR database considering only chlorine disinfection according to final filter data. (n=2,183)
Figure 4.1.5: Histogram for predicted HAA9 values in the ICR database considering only chlorine disinfection according to final filter data. (n=2,183)
0 200 400 600 800 1000
0-‐23 24-‐47 48-‐71 72-‐95 96-‐119 120-‐143 144-‐167 168-‐191 192+
N
o.
o
f o
b
s.
Concentration (μg/L ) Measured HAA9
Chlorine 0,2
0 200 400 600 800 1000
0-‐23 24-‐47 48-‐71 72-‐95 96-‐119 120-‐143 144-‐167 168-‐191 192+
N
o.
o
f o
b
s.
Concentration (μg/L Predicted HAA9
Figure 4.1.6: Histogram for estimated HAA9 values in the ICR database considering only chlorine disinfection according to the final filter data. (n=9,942)
Table 4.1.3 displays the statistical analysis for measured, predicted and estimated HAA9 values considering only chlorine disinfection. Like table 4.1.2, there are many more estimates than measured and predicted samples because under ICR data collection rules, utilities were not required to measure HAA9. Measured and predicted values mirror strongly with each other with predicted values slightly higher than measured values. Estimated values are generally larger than measured values and have a wider range and maximum value. This spread of HAA9
concentrations indicates that some utilities that did not report these values have exceedingly high HAA9 concentrations. However, the majority follow suit with measured and predicted values. Like these histograms, the data displayed in table 4.1.3 mimics that of the data in 4.1.2 due to the high number of chlorine only treatment samples.
0 1000 2000 3000 4000 5000
0-‐21 32-‐63 64-‐95 96-‐127 128-‐159 160-‐191 192-‐223 224-‐255 256+
N
o.
o
f o
b
s.
Concentration (μg/L) Estimated HAA9
Table 4.1.3: Statistical analysis table for measured, predicted and estimated HAA9 values in the ICR database considering only chlorine disinfection strategies.
Units Measured Predicted Estimated
Number of samples - 2,183 2,183 9,942
Mean (μg/L) 23.3 23.9 25.7 Mean Lower Control
Limit (μg/L) 22.3 22.8 25.2
Mean Upper Control
Limit (μg/L) 24.3 24.9 26.3
Standard Deviation (μg/L) 23.9 24.4 28.9
Minimum (μg/L) 0 0 0 Maximum (μg/L) 190.6 190.5 247.7
Geometric Mean (μg/L) 11.3 11.3 10.0
Median (μg/L) 19.3 19.8 18.7
25% Median Value (μg/L) 3.8 3.1 0
75% Median Value (μg/L) 32.5 34.1 40.4
Figure 4.1.7: Histogram for measured HAA9 values in the ICR database considering only chloramine disinfection according to the final filter data. (n=247)
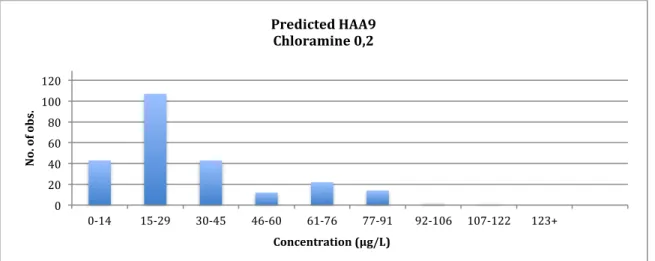
Figure 4.1.8: Histogram for predicted HAA9 values in the ICR database considering only chloramine disinfection according to the final filter data. (n=247)
0 20 40 60 80 100 120
0-‐14 15-‐30 31-‐46 47-‐62 63-‐78 79-‐93 94-‐109 110-‐125 126+
N
o.
o
f o
b
s.
Concentration (μg/L) Measured HAA9
Chloramine 0,2
0 20 40 60 80 100 120
0-‐14 15-‐29 30-‐45 46-‐60 61-‐76 77-‐91 92-‐106 107-‐122 123+
N
o.
o
f o
b
s.
Concentration (μg/L) Predicted HAA9
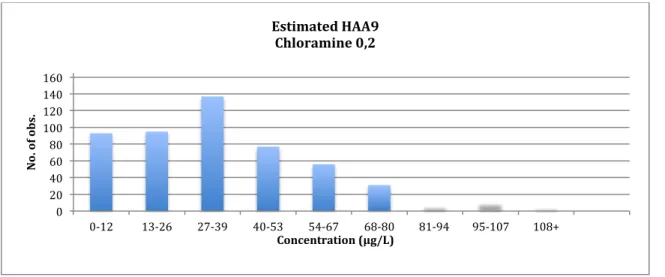
Figure 4.1.9: Histogram of estimated HAA9 concentrations for chloramine disinfection method according to the final filter data. (n=509)
Table 4.1.4 displays the statistical analysis for measured, predicted and estimated HAA9 values considering only chloramine disinfection. Like table 4.1.2 and 4.1.3, there are many more estimates than measured and predicted samples because under ICR data collection rules, utilities were not required to measure HAA9. Measured and predicted values mirror strongly with each other with predicted values slightly higher than measured values. Estimated values mimic measured values very closely with lower range and maximum values. This indicates that chloramine estimates are more similar to measured values than different.
0 20 40 60 80 100 120 140 160
0-‐12 13-‐26 27-‐39 40-‐53 54-‐67 68-‐80 81-‐94 95-‐107 108+
N
o.
o
f o
b
s.
Concentration (μg/L) Estimated HAA9