Not on My Street: Evaluating Equity in the Application Process for Traffic Calming in San Francisco
Submitted by Nathaniel Seeskin
Master’s Project Advisor: Professor Alainna Thomas
Department of City and Regional Planning University of North Carolina at Chapel Hill
Table of Contents
Abstract ... 2
Background and History on Traffic Calming ... 2
Background on SFMTA Traffic Calming Program ... 4
Research Motivation ... 8
Literature Review... 9
Methodology ... 12
Research and Analysis ... 14
Conclusion ... 16
Bibliography ... 19
Appendix A ... 21
Appendix B ... 22
Appendix C ... 23
Appendix D ... 24
Appendix E ... 25
Appendix F... 26
Appendix G ... 27
Appendix H ... 29
Abstract
The purpose of this paper is to determine if the application process for traffic calming in San Francisco is equitable. Housed under the San Francisco Municipal Transportation Agency (SFMTA), the Residential Traffic Calming Program processes petition applications from
neighborhoods on an annual basis. Considering the history of traffic calming along with different interpretations of equity, along with the specific context of the Residential Traffic Calming Program, this study evaluates equity through examining the distribution of traffic calming applications submitted over a period of three fiscal years. Pairing the geography of the petition applications with the demographic data of their respective census tracts, this study concludes that privileged communities are more likely to request traffic calming than disadvantaged
communities. This finding carries considerable implications for equity in San Francisco’s residential traffic calming process. While the program praises itself for being initiated by
residents, disparities in the participation of residents can prevent it from being socially equitable. Coupled with these findings, this paper also suggests further avenues for research.
Background and History on Traffic Calming
involves elements like speed humps, raised crosswalks, speed tables, roundabouts, and chicanes (Hoyle, 2006, p. 238-40).
Traffic calming is believed to have started in Europe with the installation of woonerven in Delft, Netherlands in the late 1960s. Meaning “living yards”, woonerven largely consisted of “tables, benches, sand boxes, and parking bays jutting into the street” (Ewing, 1999, p. 10). These features, receiving widespread support in neighborhoods, created physical obstacles that prevented cars from moving quickly through streets. This inspired the Dutch government to ultimately support a widespread traffic calming effort in 1983, involving milder elements like speeds humps. From the 1970s to the 1990s, other European nations, such as Denmark, Great Britain, Germany, and Norway, followed the Dutch’s example with similar campaigns using speed control devices. Implementations of traffic calming ranged from area-wide approaches, such as the construction of speed tables and one-way streets across six separate towns in
Germany, to the construction of individual woonerven in countries like Sweden, Japan and Israel (Ewing, 1999).
In the United States, street closures and traffic diverters were commonly used in
cities, such as San Jose, California in 1978, Portland, Oregon in 1984 and Bellevue, Washington in 1985 (Ewing, 1999).
Background on SFMTA Traffic Calming Program
The San Francisco Municipal Transportation Agency Traffic Calming Program, which started in 1999, typically explores implementing vertical speed control devices when a
residential neighborhood submits a petition: “[s]peed humps, speed cushions, and speed tables are the most common traffic calming measures on our streets given their effectiveness in managing vehicular speeds, but other measures can be proposed if they are deemed more effective on a given street” (SFMTA Traffic Calming Program Revision, 2013) (Residential Traffic Calming Program, 2018). SFMTA also emphasizes that the Residential Traffic Calming Program is intended to address traffic safety through a resident-directed, block-by-block basis, not through an area-wide approach. Because residents initiate the traffic calming process on the block level, it is possible that a selection bias exists based on who participates in this planning process across different socio-demographic groups (SFMTA, Residential Traffic Calming Program, 2018).
projects, including traffic safety projects at McLaren Park, the Embarcadero, and Golden Gate Park, they highlight the Residential Traffic Calming Program as their primary effort, applauding it for being resident-driven (Golier, personal communication, January 31, 2018).
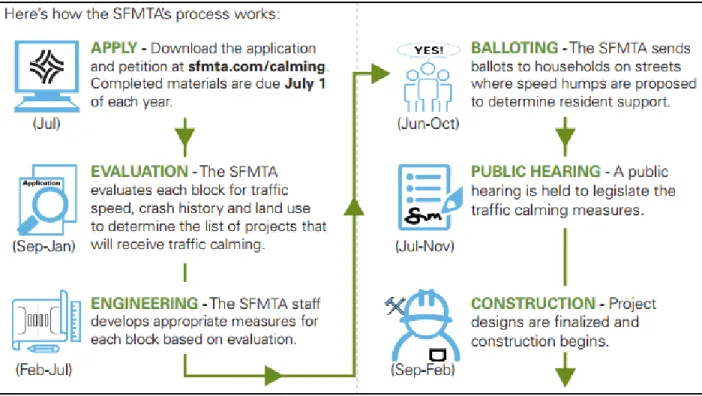
In a brochure for the Residential Traffic Calming Program, SFMTA claims that reducing vehicle speeds increases the survival rate for pedestrians and people riding bicycles hit by those vehicles in collisions; if hit by a car at 20 miles per hour (MPH), an individual has a 90% likelihood of surviving, compared to 50% and 10% if the car is going 30 MPH and 40 MPH, respectively (Traffic Calming Program, 2018). In an effort to address this, SFMTA invites city residents to request traffic calming in their neighborhoods through an application process. While staffers recently changed the timeline this year so that petitions are due at the end of August, they have described the program to follow this structure in their marketing materials:
Summary of Residential Traffic Calming Process:
Phase Description
1._Apply By the end of June, residents on a street block submit an application
requesting traffic calming. At least 20 signatures from unique homes, or half of the residential homes on that block are required in order for that
application to receive further consideration.
2. Evaluation Between September and January, SFMTA evaluates the conditions in the block, assessing factors like traffic speeds (typically the 85th percentile of vehicle speeds is the unit of measurement), land use, and crash history.
3. Engineering Between February and July, SFMTA begins the engineering phase for the neighborhood blocks it deems most in need. SFMTA determines what type of traffic element would best suit a neighborhood. Here, traffic calming is typically proposed through speed humps, raised crosswalks, and speed cushions.
4. Balloting Between June and October of the year following the original petition submission, SFMTA mails ballots to gauge the overall neighborhood’s interest of the proposed traffic calming elements. SFMTA requires a simple majority supporting the traffic calming effort in order for the project to proceed.
5. Public Hearing
process, involving partnering city agencies, like the Police Department, Fire Department, and Public Works. The legislative process typically takes place from July to October the year following original petition submission.
6.
Construction
Pending approval from the legislative process, construction for traffic elements can start in the September two years after the original petition submission.
Table 1: Description of steps in SFMTA's Residential Traffic Calming Program process (Traffic Calming Program, 2018) (Golier, personal communication, January 31, 2018)
Staff at SFMTA praise the Residential Traffic Calming Program for its relative
efficiency. Unlike other construction projects at SFMTA, the timeline shown above is short as traffic calming elements can be fully implemented about two years after they are requested, barring any obstacles in the legislative process (Golier, personal communication, January 31, 2018). Other construction projects can take several years. Moreover, staffers see the program as an equitable manner of administering traffic calming. Anyone seeing a need in their
neighborhood can choose to file a petition requesting traffic calming and the outcome of the process is solely determined by the data. No neighborhood is favored simply because a subset of residents is vocal, wealthy, or that an application receives more signatures (Golier, personal communication, January 31, 2018).
The Residential Traffic Calming Program is popular as demand for traffic calming far exceeds the available supply of resources and time from SFMTA. As a result, SFMTA does not actively market the program. City Supervisors are made aware of the program and can point their constituents to it as a resource. On top of this, residents submitting requests or complaints
through 311, San Francisco’s service phone line, regarding traffic conditions in their
2018). The lack of active marketing for the Residential Traffic Calming Program presents a serious risk in its ability to be the most equitable. While the program may be seen as equitable in being resident-initiated and data-oriented, the reach of the program itself could be affected by the political choices of Supervisors or by the quality of the City governments’ relationships between different neighborhoods. Active marketing can cancel out these variables and ensure that the Residential Traffic Calming Program’s reach is spread equally between different communities.
Research Motivation
This report assesses the level of accessibility and equity in the San Francisco Municipal Transportation Agency’s Traffic Calming Program by considering the demographics of the residents who submit traffic calming applications. San Francisco, like many cities, is diverse, with 51.3% of its 840,763 estimated residents identifying as non-White in 2015; San Francisco’s largest minority groups include Asian and Hispanic residents, amounting to 33.5% and 15.3% of the city’s overall population respectively (US Census Bureau, 2018). An equitable traffic
calming process is one that involves participation proportionally across the city’s different demographic groups.
My research design considers the following questions:
1. Do the submitted applications reflect the diversity of the city in regards to age, race, income, and assets?
2. Is there a relationship between the demographics of a neighborhood to the pool of residential traffic calming applications submitted to SFMTA in a given year? Looking at these questions, the overall effectiveness of the Residential Traffic Calming
Literature Review
While both equity and traffic calming are well researched topics in the field of
transportation planning, little research exists that incorporates both. Traffic calming is employed in many US cities and should be seen as a practice intended to achieve equity across separate modes of transportation and different demographic groups. As bicycle and pedestrian
transportation becomes increasingly integral to planning efforts in urban areas, traffic calming is a valuable tactic for improving safety for pedestrians and people riding bicycles. Traffic calming can also improve the quality of life for residents in a neighborhood, especially for children, the elderly, and the disabled. Between the two topics, minimal literature exists that addresses both together but there is evidence that suggests why researching equity should be a consideration within traffic calming.
Definitions for equity vary depending on the unit of analysis and the considered
outcomes. Brian Taylor (2010) identifies three types of equity and defines them in relationship to geographies, groups, and individuals. As the methodology section describes later in this paper, groups and geographies will be intertwined as units of analysis since the representation of different demographic groups are paired to their respective census tracts. In relation to the group unit of analysis in the context of transportation, Taylor (2010) outlines three different types of equity:
1. Market equity: “Each group receives transportation spending/benefits in proportion to taxes paid” (p. 10).
2. Opportunity equity: “Each group receives a proportionally equal share of transportation resources” (p. 10).
Opportunity equity is the best definition to apply when considering San Francisco’s traffic calming process because my research focuses on whether the distribution of traffic calming applications is proportionate across different geographic and demographic groups. At the same time, these categories of equity evaluate the outcomes of planning processes. While traffic calming applications are inputs into a longer planning process, they can help to understand equity concerns because communities that choose not submit petition SFMTA will not see traffic calming elements in the long run; if these communities are disadvantaged, then this demonstrates a need to improve opportunity equity.
Todd Litman (1999), a scholar and advocate for transportation equity from the Victoria Transport Policy Institute in Canada, takes similar definitions of equity and applies them directly to the issue of traffic calming in Traffic Calming: Benefits, Costs, and Equity Impacts. Litman (1999) argues that traffic calming can improve equity both horizontally and vertically.
Horizontal equity, which “refers to the distribution of impacts among people or groups
if the traffic calming process includes adequate participation from disenfranchised communities. Litman’s (1999) explanation between traffic calming and equity only considers the outcome of placing traffic calming on a street, whereas this paper seeks to consider whether the request process is equitable across different populations.
Research regarding equity in the traffic calming process is minimal. Jonas Hagen (2018), a research fellow at Columbia University, only recently wrote about intersections in these topics in Traffic Calming and Environmental Justice: New York City’s Neighborhood Slow Zones. He identified his paper as the first that considers the equitable distribution of traffic calming in the United States, finding only two other papers that considered these topics, both of which were published in the United Kingdom. The New York City Department of Transportation
(NYCDOT), through its Pedestrian Safety Study and Action Plan, piloted 28 neighborhood slow zones (NSZs) around the city from 2011 to 2016. NSZs are traffic calming efforts in which speed limits for cars are reduced to 20 miles per hour. Using both qualitative and quantitative methods, Hagen (2018) determined that the 28 NSZs, containing about 540,000 New Yorkers or 6.6 percent of the city’s population, “were created in a participatory, community-driven, ‘bottom-up’ manner” while also giving priority to low-income and priority neighborhoods which experience higher levels of traffic casualties (p. 12). In his conclusion, Hagen (2018) suggested that the NSZ program could improve by complementing the program’s participatory and reactive approach with the data-driven and proactive approach of New York City’s Vision Zero policy, which was adopted in 2014. The author emphasized that his research question was centered around
equitably distributed throughout the city overall. As explained in the sections for methodology, research, and analysis, this approach is used in my regression analysis.
Methodology
To address this papers’ research questions, data was collected at the census tract level from two sources: the 2015 American Community Survey (ACS) 5-year estimates and the Metropolitan Transportation Commission (MTC), the metropolitan planning organization that serves the Bay area. Much of MTC’s data is based on 2016 ACS 5-year estimates. SFMTA has also provided a list of all neighborhoods that submitted traffic calming applications over the last three fiscal years (FY 2015-16, FY 2016-17, and FY 2017-18), totaling 283 unique applications and 278 unique street blocks, as a small portion of these applications submitted more than one application over those two years. The geographic location of these applications (on the street block level) were then mapped and paired with their corresponding census tract. If applications were on the border of two or more unique census tracts, they were attributed to both or all tracts. From that, a new variable was created: the total amount of traffic calming applications within a given census tract (AppSum). This makes the 195 populated tracts in the City and County of San Francisco the units of observation. While SFMTA (2013) did not provide a list of applications that received traffic calming after submitting applications, the agency reports that they
implemented between around 20 and 35 traffic “calming devices each year, and an average of 26 per year” from 2005 to 2011 (p. 33).
ACS estimates would not make for accurate enough data among these units of observation. Along with the application counts, several other variables were acquired for each of the 196 tracts from MTC and the ACS. Variables from the ACS include: the proportion (out of 1) of the census tract that is White (2015PropWhite), Black (2015PropBlack), Hispanic
Research and Analysis
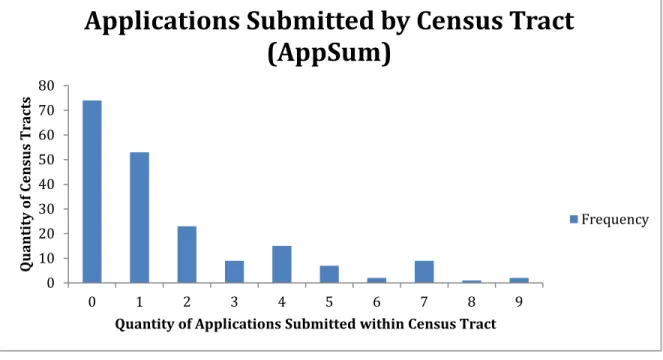
Amongst all three fiscal years studied, the quantity of traffic calming applications by census tract are distributed as such:
Figure 2: Traffic calming applications submitted by census tract from Fiscal Years 2015-16, 2016-17, and 2017-18. A plurality of census tracts submitted had 0 applications submitted. Decreasing amounts of census tracts submitted higher quantities of traffic calming applications. (SFMTA, Traffic Calming Application List, 2017)
Since the dependent variable is a count, a Poisson regression is a valuable statistical tool to understanding the relationship between many demographic variables and the number of applications submitted by census tract.
A majority of the independent variables listed in the methodology section have
statistically significant relationships with AppSum, including 2015PropWhite, 2015PropAsian, 2015PropUnder18, 2015PropHouseholdUnder18, 2015PropOwnerOccupied, 2015MHI10000, 2016PropMinority, and 2018COC. Of the tested independent variables, only 2015PropBlack and 2015PropHispanic did not have statistically significant relationships with AppSum at the 5% level. Moreover, as shown in Appendix I, all of the significant relationships have the predicted directive relationships as expected in the hypotheses; 2015PropWhite, 2015PropUnder18,
0 10 20 30 40 50 60 70 80
0 1 2 3 4 5 6 7 8 9
Q ua nt it y of C en su s T ra ct s
Quantity of Applications Submitted within Census Tract
Applications Submitted by Census Tract
(AppSum)
2015PropHouseholdUnder18, 2015PropOwnerOccupied, 2015MHI10000 have positive relationships with AppSum, while 2015PropAsian, 2016PropMinority, and 2018COC have negative relationships with AppSum.
While most of these demographic variables have statistically significant relationships with AppSum, it is difficult to determine the predictive power of these individual regressions. The highest pseudo r-squared value among the significant regressions is for 2015MHI10000 at .092. The value of this figure in a Poisson regression is not as important as that of an r-squared value in a linear regression, but it demonstrates that median household income in 2015, along with all other variables, has considerable limits in explaining the variation in AppSum.
Interestingly, 2018COC, a variable which relates to some of the definitions of other variables in this study, shows that a community of concern with 5,000 residents would be expected to receive less than 1 traffic calming application, while other communities would receive more than 2, ceteris parabis. With the same number of residents, a census tract with 0 percent owner-occupied properties, the actual minimum proportion among all studied tracts, would receive less than 1 application, while a census tract with about 88 percent owner-occupied properties, the actual maximum proportion, would receive more than 4. A 5,000-resident census tract with the maximum median household income of about $176,880 would submit more than 6 applications, while the poorest census tract, with a median household income of about $11,930, would submit less than 1.
At the same time, these findings are theoretical. While this data helps to identify important trends not previously realized, more can be done to understand the disparities in participation for this specific planning process.
Conclusion
My research demonstrates that disparities in participation for the Residential Traffic Calming Program exist between different demographic groups. This can endanger SFMTA’s ability to serve its customers equitably. Moving forward, SFMTA should consider the geographic and demographic reach of its Traffic Calming Program when considering its effectiveness. Specifically, my statistical analysis demonstrates that census tracts with higher concentrations of privileged demographic groups are more likely to submit higher quantities of traffic calming applications. These privileged demographic groups include residents who are White, households with residents under age 18, and higher income households, or some combination of all three. Most convincingly, communities of concern are likely to submit less applications given the population of their census tract. Models resulting from the Poisson
regressions show some compelling information and more research can be done to understand the need to improve equity in San Francisco’s traffic calming process.
To better understand inequity in traffic calming processes moving forward, it is important to couple this type of statistical analysis with qualitative research. The models shown in the appendices provide important information but only carry so much power. Moreover, qualitative research can help to explain the direct cause for application disparities between different
community might not trust SFMTA and the city government as result of bad interactions with the police or other municipal entities, impacting their decision to submit traffic calming applications (Gordon, 2016).
Different sources and methodologies can also be used in quantitative analysis. For
example, looking at traffic calming applications over a period longer than three years can help to illustrate more specific patterns because the data pool is larger. Looking at traffic calming processes in other cities can also show if this trend is universal or unique to San Francisco and can help to outline best practices for the traffic calming application process. In future research designs, confounding variables, such as the ratio of arterial streets to residential streets, can be considered also.
Equity, or the lack thereof, in the traffic calming process, carries great implications in the integrity and effectiveness for San Francisco’s traffic calming program. Even if officials at SFMTA claim that a program is equitable in being resident- and data-driven, the program does not work if it fails to reach underserved communities. In continuing to administer traffic calming in residential neighborhoods, SFMTA should constantly use data to evaluate both their reach in the outcomes of the program and the communications they have with customers. If 311 calls come primarily from wealthier communities, then the program, indirectly, is not marketing itself to less privileged areas. Some city supervisors might also carry different opinions about the Residential Traffic Calming program, affecting their decisions to communicate about them to their constituents. With these factors potentially in play, SFMTA should find means to
Bibliography
Brindle, R. (2001). Traffic Calming. In D. Hensher & K. Button (Eds.), Handbook of Transport Systems and Traffic Control (pp. 321–34). Kidlington: Elsevier Science Ltd.
Ewing, R. (1999). Traffic Calming: State of the Practice. Washington, DC: Institute of Transportation Engineers.
Hagen, J. (2018). Traffic Calming and Environmental Justice: New York City’s Neighborhood Slow Zones. New York.
Gordon, R. (2016). San Francisco’s Police Problem. Retrieved April 13, 2018, from https://www.thenation.com/article/san-franciscos-police-problem/
Hoyle, C. (2006). Traffic Calming. In Planning and Urban Design Standards (1st Edition, pp. 238–41). Hoboken: John Wiley & Sons, Inc.
Litman, T. (1999). Traffic Calming: Benefits, Costs and Equity Impacts. Victoria. Retrieved from http://www.vtpi.org/calming.pdf
Metropolitan Transportation Commission (2018). MTC Communities of Concern (ACS 2012-2016). Retrieved April 13, 2018, from
http://opendata.mtc.ca.gov/datasets/mtc-communities-of-concern-acs-2012-2016-2018
San Francisco Municipal Transportation Agency. (2018). Residential Traffic Calming Program. Retrieved April 13, 2018, from https://www.sfmta.com/residential-traffic-calming-program
San Francisco Municipal Transportation Agency. (2013). SFMTA Traffic Calming Program Revision.
Taylor, Brian. (2010). How Fair is Road Pricing? Evaluating Equity in Transportation Pricing and Finance. Washington, DC. Retrieved from
http://bipartisanpolicy.org/wp-content/uploads/sites/default/files/BPC%20Pricing%20EquityFIN.pdf.
Appendix G
Hypotheses of Independent Variables in Relation to Traffic Calming Application Counts:
Variable Description Hypothesis
2015PropWhite Out of 1, the proportion of residents in a Census Tract who identify as White, according to ACS 2015 5-Year Estimates.
The higher the proportion, the higher the amount of traffic calming
applications.
2015PropBlack Out of 1, the proportion of residents in a Census Tract who identify as Black or African-American, according to ACS 2015 5-Year Estimates.
The higher the proportion, the lower the amount of traffic calming
applications.
2015PropAsian Out of 1, the proportion of residents in a Census Tract who identify as Asian or Asian-American, according to ACS 2015 5-Year Estimates.
The higher the proportion, the lower the amount of traffic calming
applications.
2015PropHispa nic
Out of 1, the proportion of residents in a Census Tract who identify as Hispanic or Latinx, according to ACS 2015 5-Year Estimates.
The higher the proportion, the lower the amount of traffic calming
applications.
2015PropUnder 18
Out of 1, the proportion of residents that are under the age of 18, according to ACS 2015 5-Year Estimates.
The higher the proportion, the higher the amount of traffic calming
applications.
2015PropHouse holdUnder18
Out of 1, the proportion of households that have residents under the age of 18, according to ACS 2015 5-Year
Estimates.
The higher the proportion, the higher the amount of traffic calming
applications.
2015MHI10000 The median income household within a Census Tract, according to ACS2015 5-Year Estimates, divided by 10,000 so as to normalize the variable on a scale similar to the dependent variables.
The higher the figure, the higher the amount of traffic calming applications.
2015PropOwner Occupied
Out of 1, the proportion of households that are occupied by property owners, according to ACS 2015 5-Year Estimates.
The higher the proportion, the higher the amount of traffic calming
applications.
ity Census Tract who identify as non-White, according to ACS 2016 5-Year Estimates and the Metropolitan Transportation Commission.
the amount of traffic calming applications.
2018COC A dummy variable (0 or 1) in which
identifies a Census Tract as a
Community of Concern during the year 2018. The Metropolitan Transportation Commission defines a Community of Concern based on a variety of factors, including the percentage of residents identified as Minorities, Low-Income, with limited English proficiency along with zero vehicle households, seniors 75 years or over, people with disabilities, single-parent families, and severely rent-burdened households.
Appendix H
Poisson Regression Results:
Below are regression results for a variety of demographic variables in relation to the variable, AppSum, which is the count of traffic calming applications in a census tract over Fiscal Years 2015-2016, 2016-2017, and 2017-2018. Regressions for independent variables from the 2015 American Community Survey were normalized by the 2015 total population estimate in each census tract, while regressions for the independent variables from MTC were normalized by the 2016 total population estimate from the American Community Survey.
Dependent Variable Independent Variable
2015PropWhite
Coefficient Standard Error
Z P>|z| Pseudo
R-squared
AppSum 0.924 0.273 3.38 0.001 0.015
*The relationship between 2015PropWhite and AppSum is statistically significant at the 5% level.
Dependent Variable Independent Variable
2015PropBlack
Coefficient Standard Error
Z P>|z| Pseudo
R-squared
AppSum -1.146 0.790 -1.45 0.147 0.003
Dependent Variable Independent Variable
2015PropAsian
Coefficient Standard Error
Z P>|z| Pseudo
R-squared
AppSum -1.004 0.304 -3.31 0.001 0.015
*The relationship between 2015PropAsian and AppSum is statistically significant at the 5% level.
Dependent Variable Independent Variable
2015PropHispanic
Coefficient Standard Error
Z P>|z| Pseudo
R-squared
AppSum 0.011 0.471 0.02 0.981 0.000
*The relationship between 2015PropHispanic and AppSum is not statistically significant at the 5% level.
Dependent Variable Independent Variable
2015PropUnder18
Coefficient Standard Error
Z P>|z| Pseudo
R-squared
AppSum 4.013 0.804 4.99 0.000 0.029
Dependent Variable Independent Variable
2015PropHouseholdUnder18
Coefficient Standard Error
Z P>|z| Pseudo
R-squared
AppSum 1.809 0.493 3.67 0.000 0.017
*The relationship between 2015PropHouseholdUnder18 and AppSum is statistically significant at the 5% level.
Dependent Variable Independent Variable
2015PropOwnerOccupied
Coefficient Standard Error
Z P>|z| Pseudo
R-squared
AppSum 1.895 0.250 7.58 0.000 0.077
*The relationship between 2015PropOwnerOccupied and AppSum is statistically significant at the 5% level.
Dependent Variable Independent Variable
2015MHI10000
Coefficient Standard Error
Z P>|z| Pseudo
R-squared
AppSum 0.141 0.017 8.36 0.000 0.092
Dependent Variable Independent Variable
2016PropMinority
Coefficient Standard Error
Z P>|z| Pseudo
R-squared
AppSum -0.819 0.260 -3.15 0.002 0.013
*The relationship between 2016PropMinority and AppSum is statistically significant at the 5% level.
Dependent Variable Independent Variable
2018COC
Coefficient Standard Error
Z P>|z| Pseudo
R-squared
AppSum -0.961 0.198 -4.86 0.000 0.040
Appendix I
Below are calculations predicting application counts (AppSum) for a census tract, assuming a population of 5,000 residents, for all statistically significant regressions, ceteris parabis.
2015PropWhite
2015PropWhite Predicted AppSum
Minimum Value .037 1.240
95% Lower Confidence Interval (CI) Value
.471 1.852
Mean Value .502 1.906
95% Upper CI Value .532 1.960
Maximum Value .936 2.847
2015PropAsian
2015PropAsian Predicted AppSum
Minimum Value .000 2.641
95% Lower CI Value .290 1.974
Mean Value .318 1.919
95% Upper CI Value .345 1.868
2015PropUnder18
2015PropUnder18 Predicted AppSum
Minimum Value .000 1.084
95% Lower CI Value .121 1.761
Mean Value .130 1.826
95% Upper CI Value .139 1.893
Maximum Value .459 6.836
2015PropHouseholdUnder18
2015PropHouseholdUnder18 Predicted AppSum
Minimum Value .000 1.293
95% Lower CI Value .185 1.793
Mean Value .201 1.846
95% Upper CI Value .217 1.900
Maximum Value .555 3.503
2015PropOwnerOccupied
2015PropOwnerOccupied Predicted AppSum
Minimum Value .000 .813
95% Lower CI Value .345 1.564
Mean Value .377 1.662
95% Upper CI Value .410 1.769
2015MHI10000
2015MHI10000 Predicted AppSum
Minimum Value 1.193 .607
95% Lower CI Value 7.963 1.578
Mean Value 8.473 1.696
95% Upper CI Value 8.983 1.822
Maximum Value 17.688 6.220
2016PropMinority
2016PropMinority Predicted AppSum
Minimum Value .111 2.750
95% Lower CI Value .538 1.938
Mean Value .570 1.888
95% Upper CI Value .602 1.839
Maximum Value .981 1.349
2018COC
2018COC Predicted AppSum
Minimum Value (Not a Community of Concern)
0 2.159
Maximum Value
(Community of Concern
1 0.826