Network Traffic Classification
under Time-Frequency Distribution
Andr´e Riboira1 and Angelos K. Marnerides2 1
Dep. of Informatics Engineering, Faculty of Engineering 2
Dep. of Computer Science, Faculty of Sciences University of Porto, Portugal
1
[email protected],[email protected]
Abstract. The Internet is continuously being expanded. This expansion is represented by an incremental utilization of network traffic. Conse-quently, such immense amounts of traffic volume require efficient traffic engineering techniques embodied within Quality of Service strategies. Traffic classification constitutes a basis for such techniques and enables the selective prioritization of network flows. Most offline network traf-fic classitraf-fication techniques are based on classitraf-fication models formulated by supervised machine learning (ML) algorithms. The adequate selection of suitable features for further usage in ML-algorithms is fundamental to achieve high classification accuracy rates. This paper expands the Marnerides’ previous work with respect to the exploitation of the Renyi information within the traffic classification process. We provide a novel, and detailed comparison with other features and we further illustrate that the Renyi information allows a far more accurate ML-based classi-fication of the network flows. The Renyi information is derived from the smoothed Pseudo Wigner-Ville (SPWV) energy time-frequency (TF) dis-tribution of the traffic signal as composed by the counts of bytes of the network packets that constitutes a network flow. The impact of this new feature was evaluated using packet traces captured at the Keio university campus network in Japan.
Keywords: Network traffic classification, machine learning, decision tree, neural network, time-frequency distribution, Renyi information
1
Introduction
The Internet is a resource that is continuously being expanded in terms of users, devices and applications. The expansion of the Internet is represented by an in-cremental network traffic volume persona in backbone networks. This high traffic volume utilization requires proper traffic engineering techniques, to guarantee the best usage of the network infrastructure[18]. The diversity of application-layer protocols (e.g. HTTP, FTP) exposes different performance characteristics for a given network flow (e.g. TCP, UDP flow) such as latency, throughput and jitter. Quality of Service (QoS) is a set of traffic engineering techniques that
tries to assess and optimize the aforementioned characteristics by defining prior-ity levels based on the criticalprior-ity of each flow [14]. Accurate traffic classification is a challenging task and is considered as fundamental for supporting selective prioritization of network flows. Two different approaches exist to perform net-work traffic classification: (1) online traffic classification and (2) offline traffic classification [8]. The first approach aims to perform network traffic classifica-tion close to real-time, mostly by using directly the data captured from a network interface. The second approach aims to perform network traffic classification us-ing a set of historical data, captured over a limited period of time in the past. These two different network classification approaches are used under the scope of different purposes. Offline traffic classification is mostly performed using ML techniques [19]. Supervised ML-algorithms tend to create a classification model based on the information obtained through the analysis of a training set. The training set has records with different data fields named features, and is consid-ered as the a priori knowledge for the whole supervised ML technique. A test set has the same features of the training set and the class of all the records is also known in advance, and is used to verify the accuracy of the formulated model. This information is used to compare the class predicted by the model with the actual record class [2]. It is important to explore new features that may increase the accuracy of the ML-algorithms. This paper expands the work done in [17] with respect to the exploitation of the Renyi information within the traffic classification process. We provide a novel, and detailed comparison with other features and we further illustrate that the Renyi information allows a more accurate ML-based classification of the network flows, on certain conditions.
Traditionally traffic classification has been mainly assessed with the usage of the src/dst port numbers that allow the identification of an application layer protocol (eg. HTTP). Although this feature allows a fast classification, some applications do not use well known ports, and this consequently results to lower classification accuracy rates. On top of that, some applications, mainly peer-to-peer (P2P), use ports that are usually assigned to other well-known applications and services, in an attempt to avoid their proper classification. The goal of this behavior is mainly to bypass the proper traffic prioritization, because usually the P2P applications and services have low priority and have their use limited with traffic engineering techniques such as traffic shaping [16]. Another feature used in current and past literature is packet payload information. The analysis of the message cargo allows an accurate classification of each network flow. The main disadvantages of this feature are related with confidentiality issues, and en-crypted payloads. Moreover, the payload analysis is based on semantic parsing, which is usually a resource intensive methodology [16]. New features are method-ically tested to assess the importance of their use in supervised ML-algorithms. The purpose of this work is to experiment and evaluate the accuracy derived by the usage of two new features, obtained by calculating the Renyi Information [1] of a signal representing the energy-TF distribution [5] of the Smoothed Pseudo-Wigner-Ville (PWV) [3], based on the network features of the byte-size and the inter-arrival interval of the packets for a given flow. In particular, this work
depends on three supervised ML-algorithms namely decision trees [20], neural networks [9] and random forests [4]. The algorithmic objective of a decision tree classification scheme is to construct a tree structure where the interior nodes cor-responds to features of the data set, and the edges to children nodes corcor-responds to the possible values for each feature. Leaf nodes represents the target classes. The algorithmic objective of a neural network classification scheme is to create an interconnected group of artificial neurons, and process information using an approach oriented to connections. The random forest algorithm consists of many decision trees and outputs the class that is the mode of the classes output by individual trees.
The remainder of this paper is structured as follows. Section 2 presents the procedure, methods and techniques. The overall methodology was based on data pre-processing, including calculating the new features, and the application of different supervised ML-algorithms to analyze the impact of these new fea-tures. The Section 3 presents the results and discussion. The overall results were based in comparing the accuracy of the models formulated by supervised ML-algorithms, and the discussion presents reasonable explanations for the obtained results. Section 4 concludes the paper.
2
Methodology
This section presents the data sources used during this experiment, as well as the data processing and analysis techniques that were applied. The data sources subsection details the origin of the data sets used during this experiment. Follows a subsection with data processing tasks, concerning feature extraction processes and data preparation. Finally the subsection with data analysis details the su-pervised ML-algorithms employed during this experiment.
2.1 Data sources
This paper illustrates an experimentation based on two packet-level traces (i.e. libpcap format [11]) captured on a Gigabig Ethernet (GbE) link from Keio Cam-pus network (Japan). The first capture (i.e. Keio-I) took place on the 8th of August, 2006 from 10:43:04 to 11:13:04. Keio-II was the second trace used and was captured on the 9th of August, 2006 between 16:18:41 to 16:48:31. During this experiment, Keio-I was used as training set and Keio-II was used as test set.
2.2 Data processing
The data processing task was held in the following five main steps:
1. Data extraction, from the network capture dump (with binary information). 2. Data transformation, which included the following parts:
(a) Conversion from the CAIDA’s Coral Reef tools [15] output to CSV files. (b) Anonymization of the sensitive information of the data set.
(c) Map all the extracted packets to the correspondent flows. 3. Loading the data to a data mart created for this experiment. 4. Processing the new features using Octave [7].
5. Data validation process at which some features were re-calculated by using the mapped packets. This was done in order to ensure correct mapping of packets with their corresponding flows.
The two data sets used during this experiment contained raw network traffic data. Due to the raw nature of the data sets it was essential to perform some data processing tasks in order to extract meaningful packet and flow-level infor-mation. This task was performed using CAIDA’s Coral Reef Suite [15]. Keio-I had 9.103.698 network packets composing 877.921 network flows. Keio-II had 7.398.404 network packets composing 497.042 network flows. These tools were able to determine the class of each network flow (from both data sets), based mainly on the payload information. This classification was used as this experi-ment ground truth. Both network traffic traces used during this experiexperi-ment con-tained sensitive information, such as the source and destination IP addresses of each packet. To ensure the network users confidentiality, all IP addresses present in both data sets were replaced by an encrypted identifier. The anonymized data was used to populate a MySQL database. This database was created by following a dimensional model, to support the new features extraction process. In order to achieve this, a Java application was developed and used. Particularly, this Java application used the JavaOctave1to perform Octave calculations, complemented with the TFTB Toolbox [10] to generate the TF distribution signals based on the bytesize and the inter-arrival intervals of the network packets of each net-work flow, as well as their correspondent Renyi information. The commands used to calculate the Renyi information values from the generated signals were the following:
real(renyi(tfrpwv(hilbert([ bytesizeA bytesizeB ... bytesizeN ]’)))); real(renyi(tfrpwv(hilbert([ intervalA intervalB ... intervalN ]’)))); The first action was to generate the signal applying the Hilbert transform [13] employed by the Octave hilbert() function, used for deriving the analytical signal formed by both packets’ byte sizes and packets’ inter-arrival times. Sub-sequently, we computed the energy TF distribution of the analytical signal by applying thetfrpwv()function which in practice computes the smoothed PWV distribution. The resulted distribution enabled an investigation on the TF plane and the estimation of the Renyi information. This value represents the entropy of the energy-TF distribution. The goal of this work was to use this value as a new feature when using ML-algorithms, and evaluate its relevancy considering the accuracy of the formulated classification models. This process was accomplished by using therenyifunction in Octave. Therenyifunction may return complex numbers that are not employed by the supervised ML-algorithms. To overcome this drawback, only the real part of the Renyi information value was considered. This process was accomplished by using therealfunction in Octave.
1
During this experiment, Octave stood unable to process flows with more than 10.000 packets. Three different environments were used on two different ma-chines, and every attempt to process flows with more than 10.000 packets failed. These environments were namely: Apple MacOS X Lion, Microsoft Windows 7 and Canonical Ubuntu Linux 11.10, with their respective versions of Octave (using both 32 and 64 bit architecture versions). The first machine had an Intel Core 2 Duo 2.0GHz processor and 2GB DDR3 1066MHz of RAM, where the second one had an Intel Core 2 Duo 2.8GHz processor and 8GB DDR2 800MHz of RAM. Due to Octave’s aforementioned limitation it was feasible to compute Renyi values for flows that contained less than 10.000 packets. In addition, the minimum packet size for a given flow whilst computing the Renyi information was fixed to 5 since a lower threshold would not allow the generation of a mean-ingful signal. The subset of flows with 5 or more packets and less than 10.000 packets corresponds to 35.24% of Keio-I and 35.40% of Keio-II.
2.3 Data analysis
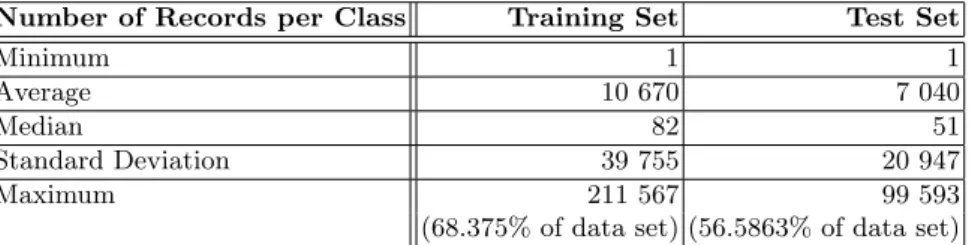
In order to conduct a robust analysis scheme for our new features, our experimen-tation strictly considered the subset of flows with a Renyi value. In more detail, it was feasible to compute the Renyi values for 309.420 records of Keio-I and 176.002 records of Keio-II. This filtering process resulted in a Keio-I subset with 29 distinct classes and a Keio-II subset with 25 distinct classes. Table 1 presents statistical information related with the classes distribution on both training and test data sets2. The number of records per class were rather irregular.
Table 1.Statistical information related with classes distribution Number of Records per Class Training Set Test Set
Minimum 1 1
Average 10 670 7 040
Median 82 51
Standard Deviation 39 755 20 947
Maximum 211 567 99 593
(68.375% of data set) (56.5863% of data set)
The ML-algorithms were executed using two different approaches: (1) with and (2) without the Renyi information features. We compared the results of the formulated classification models to analyze the impact of the new features. In this experiment we worked with features derived from two different sources: (1) from the packets’ byte size and (2) from the packets’ inter-arrival interval.
2 Due to space restrictions, the classes distribution analysis is not presented in great detail in this paper.
Therefore, we used the following statistical information as features:
– renyi time: Renyi information value for inter-arrival interval;
– min time, avg time, std time, max timeand total time: Minimum, average, standard deviation, maximum and sum of the packet inter-arrival interval values;
– renyi size : Renyi information value for byte-size;
– min size, avg size,std size,max size andtotal size : Minimum, aver-age, standard deviation, maximum and sum of the packet byte-size values. According to the basic statistical descriptors of minimum, average, median, standard deviation and maximum values, the training and test sets exposed similar statistical characteristics3. The ML-algorithms were employed via the RapidMiner [12] tool. Keio-I filtered data subset was used as the training set and Keio-II filtered data subset was used as the test set. By virtue of its al-gorithmic nature, the decision tree algorithm was used in order to first explore and analyze the importance of the newly added feature. Decision tree algorithm selects the most relevant features to build the decision paths of its tree. This behavior allows us to analyze if a given feature is relevant or not. We executed the supervised ML-algorithms several times varying its parameters to detect the values that produced better results. Nevertheless, we have used the following pa-rameters for the decision tree algorithm: criterion wasgain ratio, the minimal size for split was 4, the minimal leaf size was 2, the minimal gain was 0.1, the maximal depth varied from 3 to 25 and the confidence was 0.25. The ”pruning” technique is intended to minimize over-fitting issues but was not used during this experiment to allow a deeper analysis of the features influence. We have achieved over-fitting redundancy by using a test set obtained from traces of a different network capture. In parallel, the neural network algorithm was used with a varying training cycle (i.e. 20-320 cycles), the learning rate was 0.3 and the momentum was 0.2, whereas data was normalized and shuffling was not em-ployed. Neural network was also used with multiple features combinations to analyze the impact of each feature on the resulting classification models. These executions were carried out with 50 training cycles, having a learning rate of 0.3 and a momentum of 0.2 (also with data normalized and not shuffled). The random forest algorithm used the following parameters: The number of trees in the forest varied from 5 to 80, the number of features to consider waslogM+ 1, whereM was the number of inputs, and the random number seed was 1.0.
3
Results and Discussion
This section presents the results obtained during this experiment and the dis-cussion about their meaning. The results subsection presents an analysis of the different accuracies of the models formulated by the ML-algorithms. We present the results concerning the decision tree, the neural network and the random for-est algorithms. In discussion subsection we present the possible reasons for the observed differences.
3
3.1 Results
As already mentioned (Section 2.3), the decision tree algorithm was accom-modated multiple times with varying features and themax depth parameter in order to examine the efficiency of the newly added features. Ultimately we aimed at identifying the effect of different features on the overall accuracy rate. The
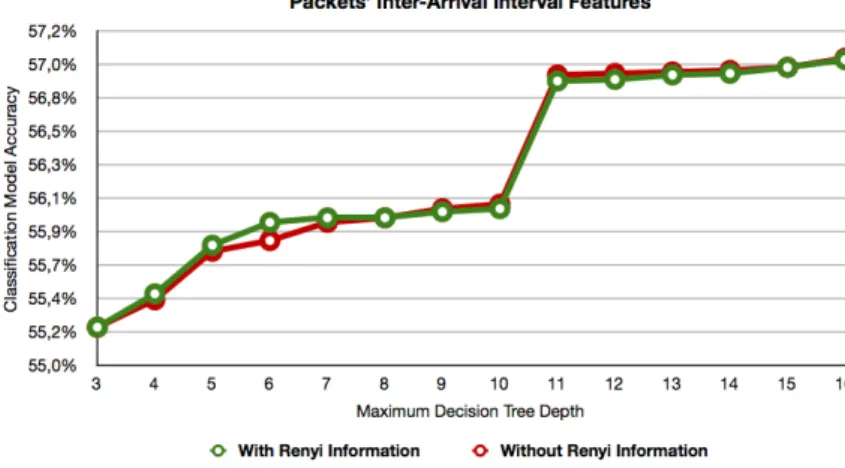
max depth parameter was also varied to analyze the behavior of the algorithm when different tree depth restrictions were applied. Defining a small value for the max tree depth forces the algorithm to select the most influential features to create its decision tree. In opposition, high max tree depth values allows the algorithm to use a larger number of features to produce its decision tree. The accuracy of the model was recorded for every execution of the decision tree al-gorithm, and was calculated by comparing the predicted class of a record from the test set with its actual class. Features related with the packets’ inter-arrival interval were used in an initial approach. Having the intention to analyze the im-pact of the newly added features we considered to execute the decision tree with and without the new features. Figure 1 denotes that the features derived from the packets’ inter-arrival intervals were not able to produce accurate classifica-tion models, and the addiclassifica-tion of the Renyi informaclassifica-tion feature had no positive impact. The best results obtained during this experiment had an accuracy rate lower than 60%. A hypothetical classification model that defaults to the most populous class4 would achieve an accuracy rate higher than the formulated de-cision tree models that used the packets’ inter-arrival interval derived features.
Fig. 1.Accuracy of the decision tree algorithm (packets’ inter-arrival interval features).
On the other hand, the models formulated by the decision tree algorithm that used the packets’ byte-size derived features presented an higher accuracy rate.
4
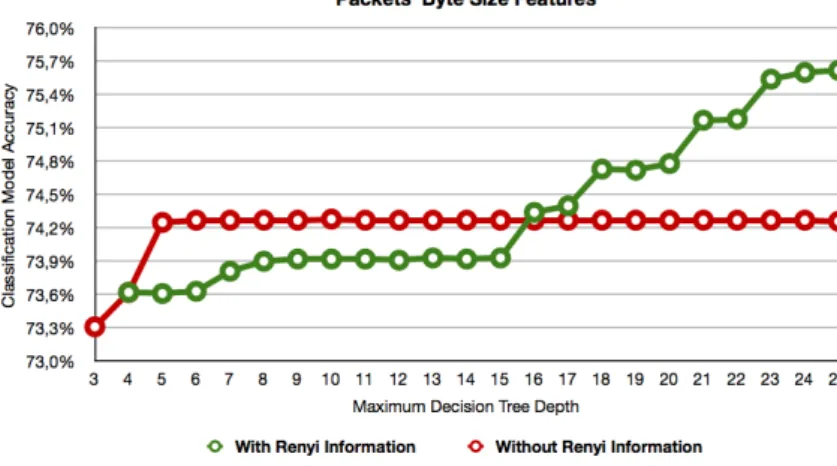
Observing the Figure 2 it is possible to note that when the Renyi information is not used, the accuracy rate achieves a maximum of 74.28% (in decision trees with 10 levels) and remains with the same accuracy rate thenceforth. This accuracy rate is possibly the maximum for these features. Adding the Renyi information feature decreases the model accuracy when the tree depth is limited to a level lower than 16. A possible reason for this behavior is that the Renyi information feature may perform better when deeply associated with other features, and only on trees with more than 15 levels is possible to observe its advantage. Above 16 levels the Renyi information feature increases considerably the accuracy rate of the formulated models. Due to computational limitations5, it was not possible to calculate the accuracy of decision tree models with more than 25 levels. Decision trees having a maximum depth of 25 levels had an accuracy rate of 75.62%.
Fig. 2.Accuracy of the decision tree algorithm (packets’ byte-size features).
The Neural Network algorithm was also used to analyze the importance of the
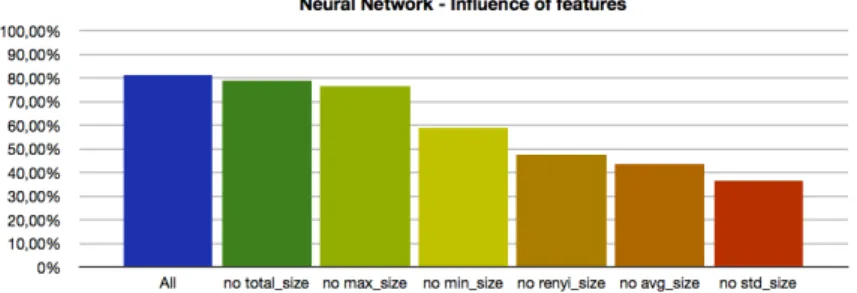
renyi size feature. We did not considered therenyi time feature due to the poor results obtained with the decision tree algorithm. In an attempt to analyze the impact of the different features used by the neural network algorithm, we used the algorithm with multiple feature combinations. On the first execution stage, all the features were used, then several executions were performed without a feature at a time. This was done since our aim was to analyze the impact of the unused feature on the resulting model accuracy (see Figure 3). It could be observed that the feature with the highest classification impact was thestd size
that represented an accuracy drop of 44.67%, followed by the featureavg size
that represented an accuracy drop of 37.55%. In addition, the Renyi information feature (renyi size) was the third most influential feature, representing an accuracy drop of 33.62%. The remaining three features were the less influential
5
in the resulting model accuracy, representing an accuracy drop ranging from 28.31% to 2.31%. The neural network algorithm performance varied much with the different features selection.
Fig. 3.Comparison of different features’ impact using the neural network algorithm.
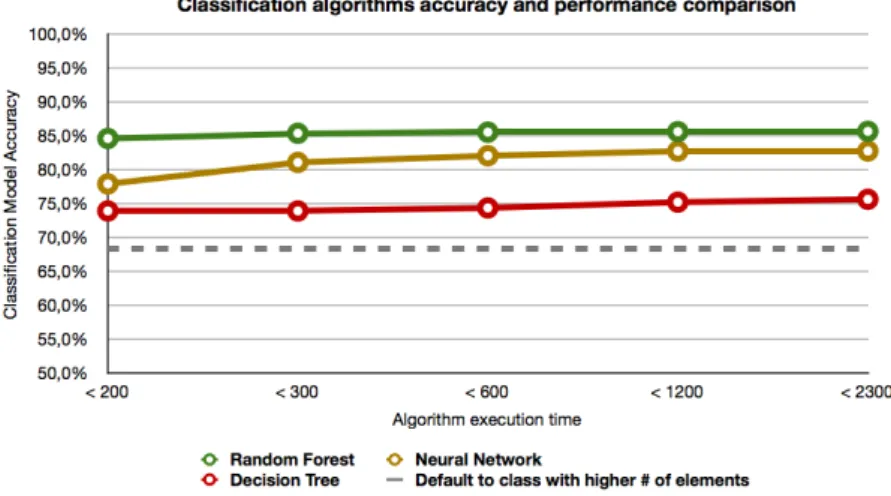
For a complementary analysis, the Decision Tree, the Neural Network and the Random Forest algorithms were executed in order to compare their performance when using the packets’ byte-size features including the Renyi information. Dur-ing the experiment the number of trainDur-ing cycles of the neural network algorithm was varied from 20 to 320, and the number of trees in the forest of the random forest algorithm was varied from 5 to 806. The model accuracy rates and the algorithm execution times were recorded, to allow a comparison between the per-formance of the three machine learning algorithms that were used during this experiment. Figure 4) denotes that the accuracy results showed little variation respecting each supervised ML-algorithm. Comparing with the other algorithms, neural networks were the ones who varied most with the increase of execution times7. However, neural networks never surpassed the accuracy rates of random forests, that outperformed the other two algorithms during this experiment with a top accuracy rate of 85.65%8.
3.2 Discussion
The results obtained during this experiment showed that features derived from the packets’ inter-arrival intervals did not contribute to produce accurate classi-fication models. These particular features has been indiscriminately used in the past and were considered as de-facto features in traffic classification. This work contributes to emphasize the irrelevancy of these kind of features on traffic clas-sification. In fact, during this experiment they contributed to the generation of classification models with accuracy rates lower than a hypothetical-model that defaults to the most populous class.
6
The parameters details are not presented in this paper due to space restrictions. 7 Execution time varied with the number of training cycles.
8
Fig. 4.Comparison of classification algorithms (accuracy rates vs. execution times).
In the contrary, the use of features that derived from the packets’ byte-sizes did contribute to produce rather accurate classification models in certain conditions. A reasonable explanation for the higher accuracy of the features derived from the packets’ byte-sizes, compared with the features derived from the packets’ inter-arrival intervals, is related with the operation of the IP networks. A flow’s packet size is defined at an application level, and remains unchanged during the network transfer [21], allowing the exploration of their characteristics. However, the inter-arrival interval of the packets may be changed during the network transfer, due to the topological distance and the inter and intra-transfers of packets in local or foreign ISPs. Therefore, the inter-arrival frequency of the packets looses the source application footprint.
The accuracy of the classification models obtained from these subsets may not be directly compared with other experiments where unfiltered data sets were used. Using the entire data set as well as extra features such as protocol flags may lead to higher accuracy rates, as presented by H. Kim et al [16]. The available computational resources were a major difference from this experiment and others of the state of the art [16]. Under powerful computational resources we consider as highly possible to explore resource demanding techniques and achieve higher accuracy classification models. The Support Vector Machine algorithm (SVM) [6] was also executed during this experiment, but was only able to process small samples of the data set, due to computational resources limitations. Despite all these restrictions, this study showed that even with limited computational resources it was feasible to present the promising rates that can be achieved with the usage of the newly proposed features.
4
Conclusion
This work presents a new feature (Renyi information of a signal representing the energy-TF distribution of the Smoothed-PWV, based on the network features of the packets’ byte-size) to use with supervised ML-algorithms, when generating network traffic classification models. The conducted experiment showed that the proposed feature increases the accuracy of the formulated classification models in certain conditions. Therefore, this new feature should be properly explored in future researches.
Using features derived from the packets’ inter-arrival intervals shown to be ineffective when formulating classification models. One of the possible reasons for that observation is that the inter-arrival intervals of the network packets may suffer changes during the network transfers, due to traffic prioritization or routing operations. These events may prevent the use of features based on this type of information to classify the network flows. On the other hand, the byte-size information of the network packets are defined at an application level. This information remains unchanged during the network transfer, and may turn into an unique identifier of the sender application. The pattern created by the variation of the byte-size information of all the packets from a given flow may be explored as a source of identity of the sender application. During this work, this pattern (treated as a signal) was exploited with the use of the entropy value (Renyi information) of its energy-TF distribution as a feature. Several experiments were conducted using supervised ML-algorithms to evaluate the influence of the presented feature. The results obtained shown that in certain conditions this feature increases the accuracy of the formulated classification models, therefore it should be properly explored in the future.
An important limitation of this approach is the confinement of using only flows with more than 4 packets. The large amount of resources needed to process the feature when dealing with network flows with a very large number of network packets are also a major drawback. During this experiment only flows with less than 100.000 packets were able to be processed.
Nevertheless, the results denotes an increase of the formulated classification models accuracy that suggests the usefulness of a deeper analysis of this fea-ture. The presented feature may be used with other offline traffic classification techniques, based on supervised ML-algorithms, such as the SVM algorithm. With higher computational resources it may be possible to analyze in depth the influence of the presented feature using more resource demanding classification algorithms.
The combination of this new feature with other existent features should also be tested to define the best feature combination when using a supervised ML-algorithm to classify network traffic.
Acknowledgment
The authors wish to acknowledge the help of H. Kim and CAIDA in data col-lection and network capture processing tools.
References
1. R G Baraniuk, P Flandrin, A J E M Janssen, and O J J Michel. Measuring time-frequency information content using the Renyi entropies. IEEE Transactions on Information Theory, 47(4):1391–1409, 2001.
2. Christopher M Bishop. Pattern Recognition and Machine Learning, volume 4 of Information science and statistics. Springer, 2006.
3. B Boashash and P O’Shea. Use of the cross Wigner-Ville distribution for estimation of instantaneous frequency. IEEE Transactions on Signal Processing, 41(3):1439– 1445, 1993.
4. Leo Breiman. Random Forests. Machine Learning, 45(1):5–32, 2001.
5. L. Cohen. Time-frequency distributions-a review. Proceedings of the IEEE, 77(7):941–981, July 1989.
6. Nello Cristianini and John Shawe-Taylor. An Introduction to Support Vector Ma-chines and Other Kernel-based Learning Methods, volume 3. Cambridge University Press, 2000.
7. John W Eaton. GNU Octave. History, (February):1–356, 1997.
8. J Erman, A Mahanti, M Arlitt, I Cohen, and C Williamson. Offline/realtime traffic classification using semi-supervised learning.Performance Evaluation, 64(9-12):1194–1213, 2007.
9. E Fiesler. Neural network classification and formalization. Computer Standards Interfaces, 16(3):231–239, 1994.
10. Patrick Flandrin and Olivier Lemoine. Time-Frequency Toolbox.Recherche, pages 1995–1996, 1996.
11. Luis Martin Garcia. Programming with Libpcap - Sniffing the Network From Our Own Application. Hakin9 Magazine, 3(2):38–46, 2008.
12. K Goslin and M Hofmann. Integrated Tutorial Tool for RapidMiner 5. InRCOMM 2010. University of Dortmund, 2010.
13. Mathias Johansson. The Hilbert transform. October, 19(1):1–12, 2006.
14. Shivkumar Kalyanaraman. Quality of Service (QoS). Quality, pages 29–55, 2006. 15. K. Keys, D. Moore, R. Koga, E. Lagache, M. Tesch, and K. Claffy. The Architecture of CoralReef: An Internet Traffic Monitoring Software Suite. InProceedings of the Passive and Active Network Measurement Workshop (PAM 2001), Amsterdam, Netherlands, 2001. RIPE NCC.
16. H. Kim, K. Claffy, M. Fomenkov, D. Barman, M. Faloutsos, and K. Lee. Inter-net traffic classification demystified. In Proceedings of the 2008 ACM CoNEXT Conference (CONEXT 2008), pages 1–12, New York, New York, USA, December 2008. ACM Press.
17. K. Marnerides, A. On Characterization & Decomposition of Internet Traffic Dy-namics. Phd thesis, Lancaster University, 2011.
18. H Michiel and K Laevens. Teletraffic engineering in a broad-band era.Proceedings of the IEEE, 7(8):721–2033, 1997.
19. T. Nguyen and G. Armitage. A survey of techniques for internet traffic classification using machine learning. IEEE Communications Surveys & Tutorials, 10(4):56–76, 2008.
20. J R Quinlan. Learning decision tree classifiers.ACM Computing Surveys, 28(1):71– 72, 1996.
21. Rishi Sinha, Christos Papadopoulos, and John Heidemann. Internet Packet Size Distributions : Some Observations. Network, pages 1–7, 2007.