EXAMINING THE RECIPROCAL RELATIONSHIP BETWEEN BUS RAPID TRANSIT AND THE BUILT ENVIRONMENT IN LATIN AMERICA
C. Erik Vergel-Tovar
A dissertation submitted to the faculty at the University of North Carolina at Chapel Hill in partial fulfilment of the requirements for the degree of Doctor of Philosophy in the Department
of City and Regional Planning
Chapel Hill 2016
Approved by:
Daniel A. Rodríguez
Clara Irazábal
T. William Lester
Roberto Quercia
iii
ABSTRACT
C. Erik Vergel-Tovar: Examining the reciprocal relationship between bus rapid transit and the built environment in Latin America
(Under the direction of Daniel A. Rodríguez)
There has been a rapid growth of Bus Rapid Transit (BRT) systems in the world over the last two decades with more than 200 cities currently with this type of transportation system. Empirical evidence of BRT’s effects on land use and development is still limited and its relationship with affordable housing is largely unexplored. Likewise, very few studies have examined the influence of the built environment on BRT ridership.
The first aim of this dissertation examines land use and development impacts of BRT in Bogota and Quito using a multimethod approach. The quantitative approach estimates the average treatment effect of BRT on built-up area and land uses with a difference-in-difference research design. The analysis runs propensity score weighted regression models with treatment and control land parcels. In Bogota, parcels with BRT had a minimum effect on built-up area changes and mixed results regarding changes of residential and commercial uses in relation to control corridors. In Quito mixed results were found, with similarly positive and negative effects of the BRT on new developments in relation to the control corridor. The qualitative approach examined semi-structured interviews with key participants finding five themes explaining the mixed results of development impacts of BRT: coordination, expertise, development,
iv
The second aim of this dissertation examines whether population density and built environment attributes explain ridership in a sample of 120 BRT stations in seven cities in Latin America. Results found no association between population density and BRT ridership but adding the built environment attributes around stations increased the explanatory power of the model. Two built environment factors as a result of factor analysis suggest high-rise multifamily developments, mixed uses and presence of facilities are positively associated with BRT ridership. Six BRT station typologies as a result of cluster analysis suggest transit oriented development features like non-motorized transport infrastructure play an important role explaining ridership.
Based on this work, this dissertation recommends the implementation of BRT as urban development projects integrating land use and transportation planning with an equity perspective, and an assessment of built environment attributes around stations for predictions of BRT
v
vi
ACKNOWLEDGEMENTS
This dissertation was sponsored and received support from different institutions and organizations: the Lincoln Institute of Land Policy, the Lee Schipper Memorial Scholarship with the support of the World Resources Institute WRI and EMBARQ, the National Planning
Department of Colombia, the Institute of the Study of the Americas ISA and the Department of City and Regional Planning DCRP at the University of North Carolina at Chapel Hill.
I want to express my gratitude to Daniel A. Rodriguez, my academic advisor, for his excellence as doctoral mentor during my studies at UNC. Thanks to his teaching and mentorship, I got access to funding opportunities as well as to receive the training needed in order to develop this dissertation. I also want to thanks Daniel for introducing me to the transportation field and its relationship with other planning areas and disciplines. Also, I would like to thank my
committee members, Clara Irazábal, T. William Lester, Roberto Quercia and Yan Song for their permanent support and guidance on this dissertation. I want to express my gratitude to Clara Irazábal for her permanent support during my doctoral studies as well as for her feedback in several presentations of preliminary versions of this dissertation at the Latin American Studies Association LASA congress. I want to thanks T. William Lester for his support and guidance on research methods and design during my doctoral studies that helped me to undertake this
dissertation. Thanks also to Roberto for the opportunities to grow academically and
vii
opportunities, for her mentorship that helped to accomplish the complex geodata processing for this dissertation and thanks also for the opportunities to learn more about development
management techniques and value capture mechanisms. I also gratefully acknowledge the comments and feedback received on preliminary versions of some chapters of this dissertation from Ramon Munoz-Raskin, Dario Hidalgo and Sam Zimmerman.
I also gratefully acknowledge the following governmental and transportation agencies, organizations and individuals in these seven cities for their support providing data and assistance with this dissertation. In Bogota, thanks to the Departamento Nacional de Planeacion DNP, Secretaria Distrital de Planeacion SDP, Unidad Administrativa Especial de Catastro de Bogota, Transmilenio SA, Gustavo Marulanda, Ivan Herrera Sanchez, Laura Carrillo Leon, Ivan Cano, Mario Leonardo Nieto, William Camargo, Nicolas Estupiñan and Maria Cristina Rojas. In Sao Paulo, thanks to EMTU, COMTACTI, Ciro Biderman, Marcos Bicahlo, Frederico Roman Ramos, Claudia Acosta, Paula Sakamoto, Daniel Todtmann Montandon, Roberto Berkes, Carlos Joffe and Magali Jorge.
viii
In Quito, thanks to the Secretaria de Territorio Habitat Vivienda STHV, Empresa Metropolitana de Transporte de Pasajeros de Quito EPMTPQ, Dirección Metropolitana de Catastro, Rene Vallejo, Fernando Puente, Monica Quintana, Carlos Poveda, Jose Tupiza,
Fabricio Castillo, Henry Vilatuna, Sandra Hidalgo, Marcelo Yánez, Paco Salazar, Ivonne Vimos, Daniel Hidalgo, Mario Recalde, Carmen Andrade and Luis Suarez. I would like to express my gratitude to Fernando Puente and his family for their support and generosity during my multiple fieldwork visits in Quito. In Guayaquil, thanks to METROVIA, Federico von Buchwald, Felipe Xavier Huerta, Gina Alvarez and Jenny Saade Carriel.
Thanks to my family for their love and support. I want to express my gratitude to my Mother, my Father, my Aunt Perla, my sister Carolina and David for their permanent support during my doctoral studies. Without their love and support, I would have not been able to develop this dissertation.
I want to express my acknowledgments to the Fulbright commission, the National
Planning Department of Colombia DNP and COLFUTURO for their financial support in order to conduct my doctoral studies. I would like to acknowledge my colleagues at the DNP, especially Alejandro Bayona and Augusto Pinto Carrillo for believing in this ambitious project and their support since my applications to doctoral programs and scholarships in order to conduct my studies in the United States. Thanks also to Johnny Astrand and Rachelle Navarro Astrand for their permanent support.
ix
x
TABLE OF CONTENTS
LIST OF TABLES ... xv
LIST OF FIGURES ... xix
LIST OF ABBREVIATIONS ... xxii
CHAPTER 1: INTRODUCTION ... 1
1.1. Background and research problem ... 1
1.2. Conceptual Framework ... 3
1.2.1. Aim1: Understanding the impacts of BRT on the built environment. ... 3
1.2.2. Aim 2: Understanding the influence of the built environment upon BRT ridership... 6
1.3. Research objectives ... 8
1.3.1. Aim 1: Understanding the impacts of BRT on the built environment in Bogotá (Colombia) and Quito (Ecuador). ... 8
1.3.2. Aim 2: Understanding the influence of the built environment upon BRT ridership in seven cities in Latin America... 8
1.4. Relevance and significance ... 9
CHAPTER 2: LITERATURE REVIEW ... 11
2.1. Introduction ... 11
2.2. The origins and evolution of Bus Rapid Transit – BRT ... 12
2.2.1. From segregated bus lanes towards bus-based mass transit systems ... 12
2.2.2. The concept of Bus Rapid Transit - BRT ... 19
2.3. Built environment impacts of mass transit: BRT’s city-shaping impacts (Aim 1) ... 22
xi
2.3.2. BRT and transit oriented development (TOD) ... 27
2.3.3. BRT and affordable housing ... 37
2.3.4. Transit-oriented development (TOD) and affordable housing ... 38
2.3.5. Summary ... 40
2.4. Built environment and transit ridership: building for BRT (Aim 2) ... 41
2.4.1. Built environment and travel behavior ... 41
2.4.2. Built environment and transit use ... 46
2.4.3. Summary ... 49
2.5. Summary of major findings and gaps in the literature ... 50
CHAPTER 3: RESEARCH METHODS AND DESIGN ... 52
3.1. Introduction ... 52
3.2. Research methods and design (Aim 1) ... 53
3.2.1. Research questions and hypotheses ... 53
3.2.2. Study areas ... 58
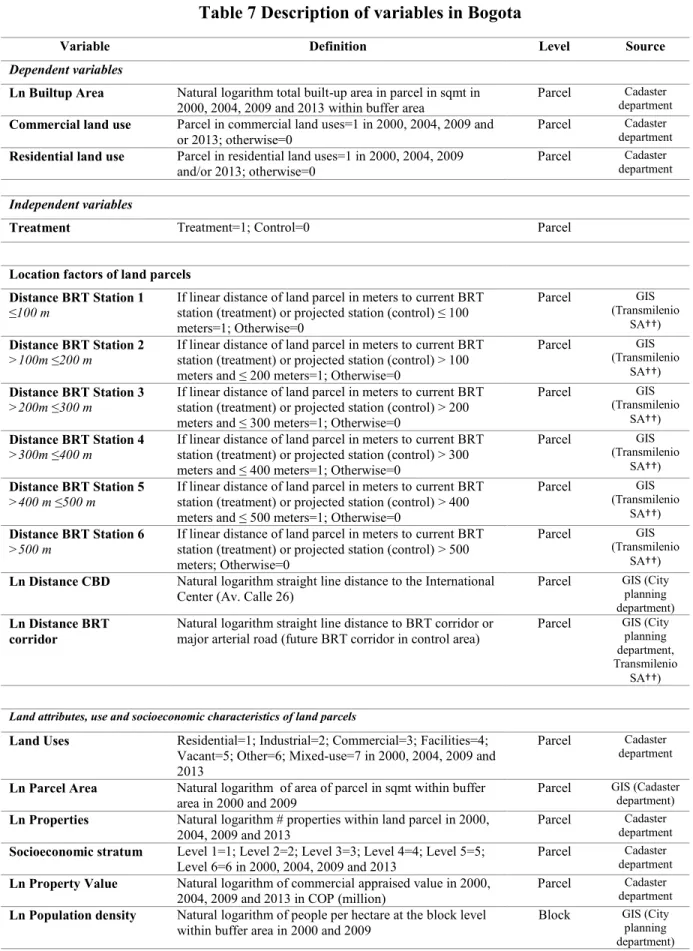
3.2.3. Data ... 62
3.2.4. Data analysis ... 67
3.3. Research methods and design (Aim 2) ... 72
3.3.1. Research questions and hypotheses ... 72
3.3.2. Study areas ... 75
3.3.3. Data collection ... 76
3.3.4. Data management... 80
3.3.5. Data analysis ... 85
CHAPTER 4: RESULTS QUANTITATIVE DATA ANALYSIS (AIM 1) ... 88
4.1. Introduction ... 88
xii
4.2.1. Data ... 95
4.2.2. Estimation of propensity scores ... 100
4.2.3. Built-up area... 108
4.2.4. Land uses ... 118
4.3. Data analysis Quito ... 131
4.3.1. Data ... 137
4.3.2. Estimation of propensity scores ... 142
4.3.3. Built-up area... 149
4.3.4. New developments ... 160
4.4. Discussion ... 165
4.4.1. Developments changes... 165
4.4.2. Land use changes in Bogota ... 167
4.4.3. Propensity score analysis and transit as treatment ... 168
4.4.4. Limitations ... 170
4.4.5. Further examination of development and land use changes ... 174
CHAPTER 5: RESULTS QUALITATIVE DATA ANALYSIS (AIM 1) ... 176
5.1. Introduction ... 176
5.2. Coordination: timing and mismatch issues between land use planning regulations and transportation investments ... 177
5.2.1. Bogota ... 177
5.2.2. Quito ... 195
5.3. Expertise: public and private sectors, moving between mistrust and exchange of knowledge ... 210
5.3.1. Bogota ... 210
5.3.2. Quito ... 220
xiii
5.4.1. Bogota ... 234
5.4.2. Quito ... 249
5.5. Management: leadership issues and the “how” question ... 261
5.5.1. Bogota ... 261
5.5.2. Quito ... 275
5.6. Equity: BRT investments in urban expansion vs consolidated areas and the provision of affordable housing ... 286
5.6.1. Bogota (BRT Terminal “Usme”) ... 286
5.6.2. Quito (BRT Terminal “Quitumbe”) ... 298
5.7. Discussion ... 308
5.7.1. Coordination ... 308
5.7.2. Expertise ... 312
5.7.3. Development ... 316
5.7.4. Management ... 320
5.7.5. Equity ... 325
5.7.6. Land use and development changes and BRT ... 328
5.7.7. BRT influencing the access to land and affordable housing ... 335
5.7.8. Limitations ... 338
CHAPTER 6: RESULTS QUANTITATIVE DATA ANALYSIS (AIM 2) ... 341
6.1. Introduction ... 341
6.2. Mesoscale attributes and BRT ridership in 120 stations ... 342
6.3. Microscale attributes and BRT ridership in 120 stations ... 346
6.4. TOD features and BRT ridership in 13 station typologies ... 357
6.5. Discussion ... 364
xiv
CHAPTER 7: CONCLUSIONS ... 373
7.1. Introduction ... 373
7.2. Key Findings ... 375
7.2.1. Land use and development impacts of bus rapid transit (Aim 1) ... 375
7.2.2. BRT ridership depends on how cities are designed (Aim 2) ... 379
7.3. Recommendations ... 382
APPENDIX 1 ... 402
APPENDIX 2 ... 417
APPENDIX 3 ... 425
xv
LIST OF TABLES
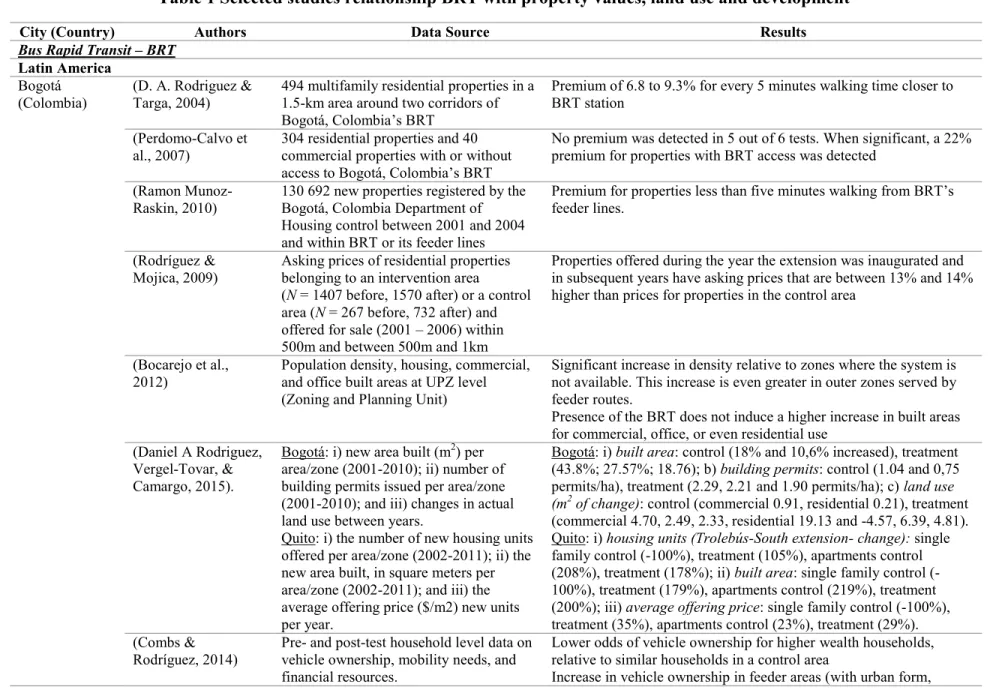
Table 1 Selected studies relationship BRT with property values, land use and
development ... 34
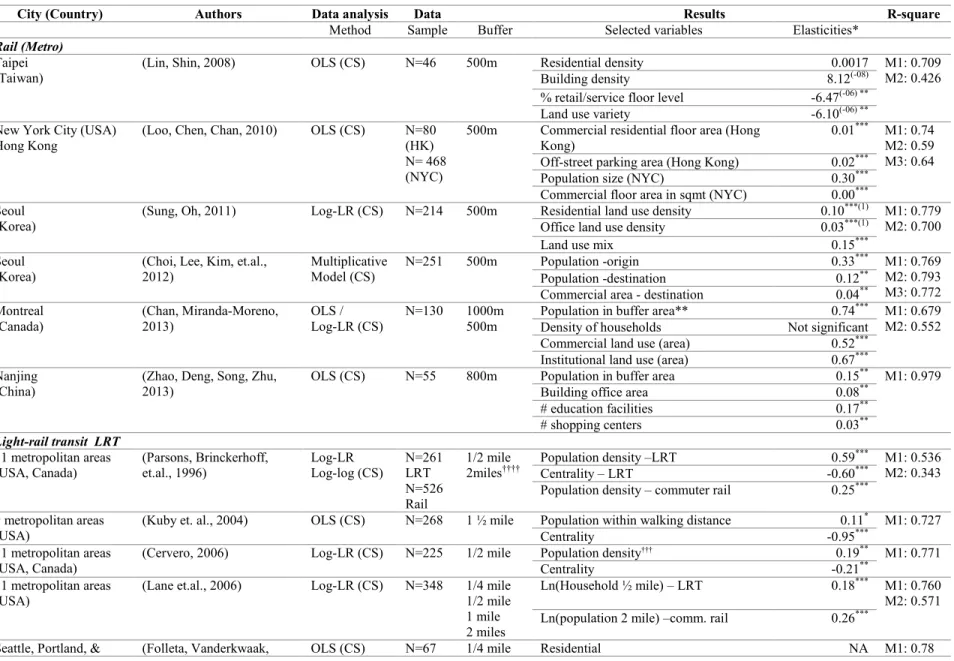
Table 2 Selected studies relationship between the built environment and transit ridership, station level (aggregated type) ... 44
Table 3 Categories and main codes ... 58
Table 4 Study areas and bus rapid transit systems ... 59
Table 5 Phase one BRT corridors in Bogota ... 60
Table 6 BRT corridors in Quito ... 61
Table 7 Description of variables in Bogota ... 63
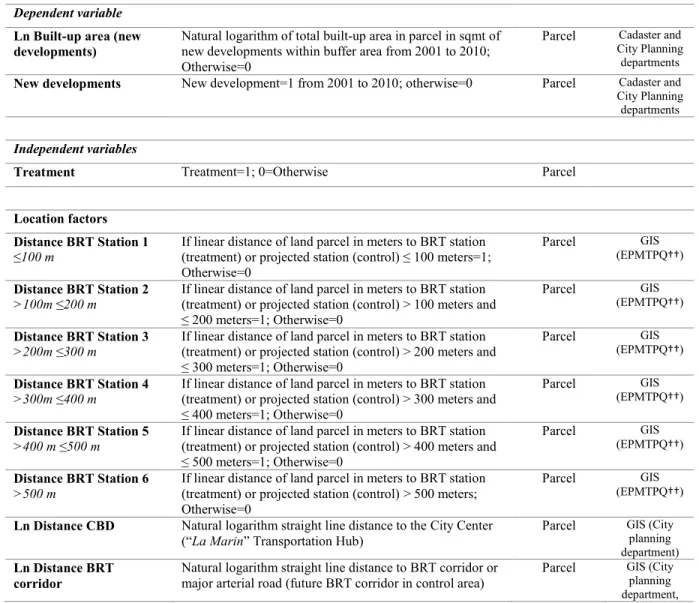
Table 8 Description of variables in Quito ... 65
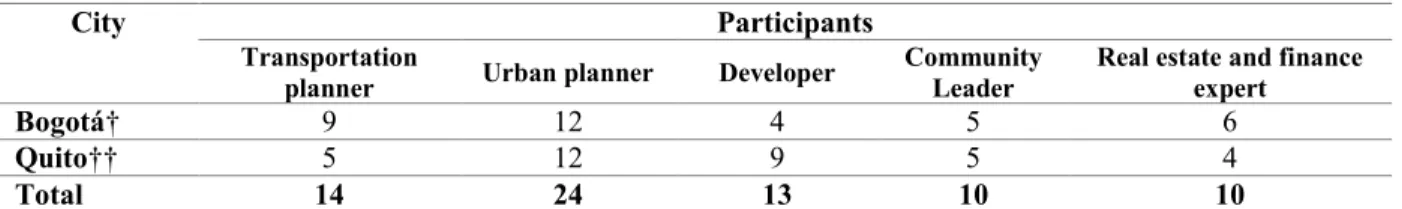
Table 9 Semi-structure interviews by participants in Bogota and Quito ... 67
Table 10 Variables and hypotheses ... 73
Table 11Built environment domains, selected variables and hypotheses ... 74
Table 12 Cities and BRT systems ... 75
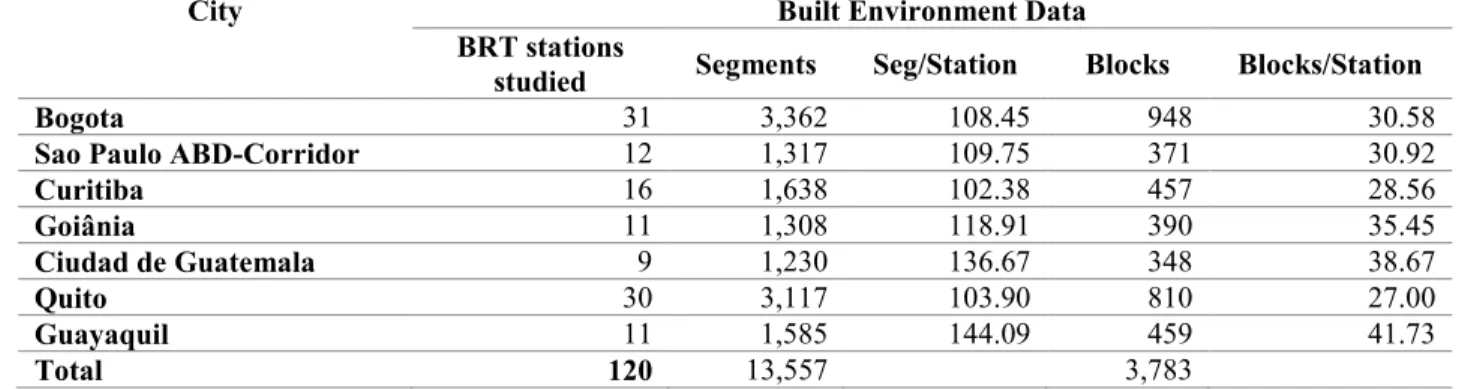
Table 13 Built environment data collected round BRT stations (terminals and single stations) in seven cities ... 77
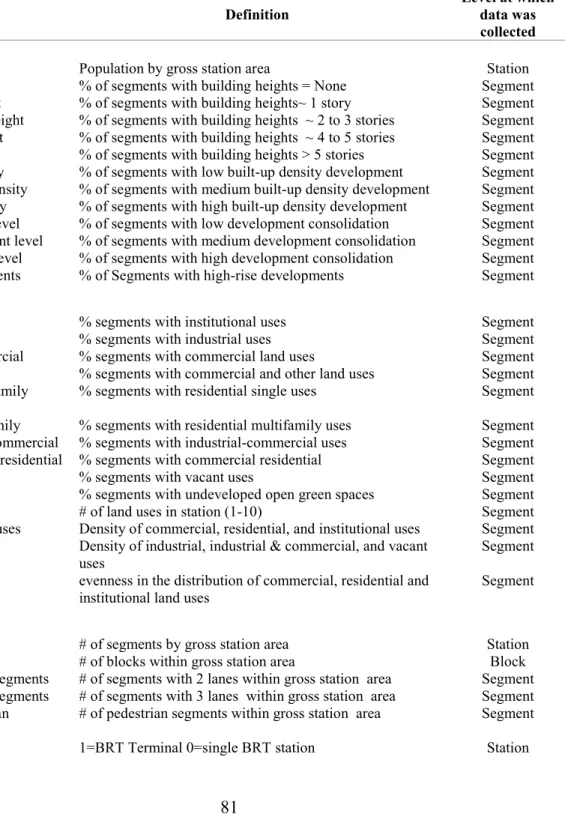
Table 14 List of built environment variables, definition and scale of data collection ... 81
Table 15 Description of variables ... 92
Table 16 Descriptive statistics treatment and control observations, Bogota, Colombia ... 98
Table 17 Logistic regression results of BRT (treatment=1; otherwise=0) with interactions (N=98,176), Bogota, Colombia ... 103
Table 18 Balance check with ATE weights (propensity scores with interactions), Bogota, Colombia ... 106
Table 19 Descriptive statistics years 2000 and 2013 (weighted with propensity scores), Bogota, Colombia ... 111
xvi
Table 21 Propensity score weighted regression results of built-up area (N=392,704),
Bogota, Colombia ... 116 Table 22 Wald test results per corridor, residential land use change over time, Bogota,
Colombia ... 120 Table 23 Propensity score weighted regression results of residential land use (N=392,
704) Bogota, Colombia ... 123 Table 24 Wald test results per corridor, commercial land use change overtime, Bogota,
Colombia ... 126 Table 25 Propensity score weighted results of commercial land use (N=392,704),
Bogota, Colombia ... 129 Table 26 Description of variables ... 134 Table 27 Descriptive statistics treatment and control observations, Quito, Ecuador ... 140 Table 28 Logistic regression results of BRT (treatment=1; otherwise=0) with
interactions (N=13,551), Quito, Ecuador ... 144 Table 29 Balance check with ATE weights (propensity score with interactions), Quito,
Ecuador ... 147 Table 30 Descriptive statistics year 2001 and 2010 (weighted with propensity scores),
Quito, Ecuador ... 151 Table 31 Wald test results per corridor, built-up area of new developments, Quito
Ecuador ... 154 Table 32 Propensity score weighted regression analysis results N=135,510 (dependent
variable Ln built-up area of new developments), Quito, Ecuador ... 157 Table 33 Wald test results per corridor, new developments overtime, Quito, Ecuador ... 161 Table 34 Propensity score weighted logistic regression analysis results N=135,510
(dependent variable new developments), Quito, Ecuador ... 163 Table 35 Land use and development changes, public and private initiatives and themes ... 334 Table 36 Bus rapid transit and generation of affordable housing developments, BRT
Terminal “Usme” (Bogota) and BRT Terminal “Quitumbe” (Quito) ... 337 Table 37 Descriptive statistics BRT ridership and built environment variables (n=120)... 343 Table 38 Log-log regression analysis results BRT ridership, population density,
xvii
Table 39 Descriptive statistics BRT ridership and built environment variables by
domain (n=120) ... 348 Table 40 Log-linear regression of BRT ridership, selected land use attributes, and cities
(n=120) ... 352 Table 41 Log-linear regression of BRT ridership and selected urban development
attributes and cities (n=120)... 354 Table 42 Log-linear regression pedestrian, parking and facilities model, BRT ridership,
selected attributes and cities (n=120) ... 356 Table 43 Built environment factors ... 357 Table 44 Log-linear regression results BRT ridership, population density, centrality,
BRT terminals, built environment factors and cities (n=120) ... 358 Table 45 Log-linear regression results BRT ridership and clusters (n=120) ... 361 Table 46 Transit-oriented development domains (TOD standard) and built environment
factors identified in this dissertation ... 368 Table 47 Descriptive statistics variables and observations used for the estimation of the
propensity scores without interactions (year 2000), Bogota, Colombia ... 402 Table 48 Logistic regression results of BRT (treatment=1; otherwise=0) without
interactions (N=98,176), Bogota, Colombia ... 404 Table 49 Balance check with ATE weights (propensity score estimated without
interactions), Bogota, Colombia ... 406 Table 50 Descriptive statistics variables and observations used for the estimation of the
propensity scores without interactions, Quito, Ecuador ... 410 Table 51 Logistic regression results of BRT (treatment=1; otherwise=0) without
interactions (N=13,551), Quito, Ecuador ... 412 Table 52 Balance check with ATE weights (propensity scores estimated without
interactions), Quito, Ecuador ... 414 Table 53 Categories and main codes – Inductive and deductive approaches ... 417 Table 54 Log-linear regression analysis results BRT ridership, population density,
centrality and BRT terminal, sample in Bogota (n=31) ... 425 Table 55 Log-linear regression analysis results BRT ridership, population density,
xviii
Table 56 Log-linear regression analysis results BRT ridership, population density,
centrality and BRT terminal, sample Curitiba (n=16) ... 425 Table 57 Log-linear regression analysis results BRT ridership, population density,
centrality and BRT terminal, sample in Goiania (n=11) ... 426 Table 58 Log-linear regression analysis results BRT ridership, population density,
centrality and BRT terminal, sample in Ciudad de Guatemala (n=9) ... 426 Table 59 Log-linear regression analysis results BRT ridership, population density,
centrality and BRT terminal, sample in Quito (n=30) ... 426 Table 60 Log-linear regression analysis results BRT ridership, population density,
centrality and BRT terminal, sample in Guayaquil (n=11) ... 427 Table 61 Factor analysis results (rotated factor loading >|0.40|, n=120) ... 431 Table 62 Mean values for built environment factors and selected TOD features per
xix
LIST OF FIGURES
Figure 1 Data analysis (base line and outcomes of interest) treatment and controls ... 89 Figure 2 BRT corridors (treatment) and arterial roads (controls) Bogota, Colombia ... 91 Figure 3 Distribution of the propensity scores with interactions, Bogota, Colombia... 104 Figure 4 Built-up area overtime and treatment effect (coefficients) per BRT corridor,
Bogota, Colombia ... 114 Figure 5 Residential land use change over time and treatment effect (coefficients) per
corridor, Bogota, Colombia ... 120 Figure 6 Predicted probabilities of residential land use change overtime per corridor,
Bogota, Colombia ... 121 Figure 7 Residential land use change distance to current or future bus rapid transit
stations, Bogota, Colombia ... 121 Figure 8 Commercial land use change overtime and treatment effect (coefficients) per
corridor, Bogota, Colombia ... 126 Figure 9 Predicted probabilities of commercial land use change overtime per corridor,
Bogota, Colombia ... 127 Figure 10 Commercial land use change, distance to current or future bus rapid transit
stations, Bogota, Colombia ... 127 Figure 11 Data analysis (base line and outcomes of interest) treatment and controls,
Quito, Ecuador ... 131 Figure 12 BRT corridors (treatment and controls), Quito, Ecuador ... 133 Figure 13 Distribution of the propensity scores with interactions, Quito, Ecuador ... 145 Figure 14 Built-up area of new developments over time and treatment effect
(coefficients and confidence intervals), Quito, Ecuador ... 154 Figure 15 Built-up area and distance to current or future bus rapid transit stations,
Quito, Ecuador ... 155 Figure 16 New developments overtime (coefficients), Quito, Ecuador ... 161 Figure 17 Predicted probabilities of new developments overtime per corridor, Quito,
xx
Figure 18 Bus rapid transit system phase one, land development measures POT 2000,
Bogota ... 194
Figure 19 Bus rapid transit system phase one, UPZ(Unidades de Planeamiento Zonal) Map, Bogota ... 194
Figure 20 Quito Land Uses ... 209
Figure 21 Quito Facilities Map (Monocentric structure) ... 209
Figure 22 Bogota: land use, development and transportation investments ... 211
Figure 23 Quito: land use, development and bus rapid transit investments ... 221
Figure 24 Parcels “Av Caracas” (selected area) Bogota ... 248
Figure 25 Parcels “Autonorte” (selected area) Bogota ... 248
Figure 26 Parcels “Corredor Central Norte” (selected area) Quito ... 260
Figure 27 Parcels “Av 6 de Diciembre” (selected area) Quito ... 260
Figure 28 Parcels “Corredor Suroccidental” (selected area) Quito ... 260
Figure 29 Location and map of BRT Terminal “Usme”, Bogota, Colombia ... 297
Figure 30 Location and map of BRT Terminal “Quitumbe”, Quito, Ecuador ... 307
Figure 31 Estimated elasticities per city ... 345
Figure 32 Predicted BRT ridership, entropy, residential and vacant attributes (percentile) ... 351
Figure 33 Predicted BRT ridership, proportion of segments with high-rise developments (percentile) ... 353
Figure 34 Predicted BRT ridership and built environment factors 1, 5 and 8 ... 360
Figure 35 Predicted percentage change on NRT ridership by cluster ... 363
Figure 36 Propensity scores estimated without interactions, Bogota, Colombia ... 405
Figure 37 Standardized difference raw and weighted variables (propensity scores without interactions), Bogota, Colombia ... 408
xxi
Figure 39 Propensity scores estimated without interactions, Quito, Ecuador ... 413
Figure 40 Standardized difference raw and weighted variables (propensity scores without interactions), Quito, Ecuador ... 416
Figure 41 Theoretical framework ... 417
Figure 42 Set of pictures 1 of developments near BRT corridors in Bogota and Quito ... 418
Figure 43 Set of pictures 2 of developments near BRT corridors in Bogota and Quito ... 419
Figure 44 Set of pictures 3 of developments near BRT trunk corridors in Bogota and Quito ... 420
Figure 45 Set of pictures 4 of developments near BRT trunk corridors in Bogota and Quito ... 421
Figure 46 Set of pictures 1 of BRT terminals and developments in Bogota and Quito ... 422
Figure 47 Set of pictures 2 of BRT terminals and developments in Bogota and Quito ... 423
Figure 48 Set of pictures “Estacion Central” BRT oriented development project in Bogota ... 424
Figure 49 Map Bogota BRT stations studied and ridership levels (n=31) ... 437
Figure 50 Map Sao Paulo Metropolitan Area, ABD Corridor, BRT Stations studied and ridership levels (n=12) ... 438
Figure 51 Map Curitiba BRT stations studied and ridership levels (n=16) ... 439
Figure 52 Map Goiania BRT stations and ridership levels (n=12) ... 440
Figure 53 Map Ciudad de Guatemala BRT stations studied and ridership levels (n=9) ... 441
Figure 54 Map Quito BRT stations studied and ridership levels (n=30) ... 442
xxii
LIST OF ABBREVIATIONS
ABD Region composed by “Santo Andre”, “Sao Bernardo do Campo” and “Diadema” municipalities as part of the Sao Paulo Metropolitan Region
ATE Average Treatment Effect
BRT Bus Rapid Transit
CBD Central Business District
DANE Departamento Administrativo Nacional de Estadística
ERU Empresa de Renovación Urbana
EFA Exploratory Factor Analysis
GIS Geographic Information Systems
IBGE Instituto Brasileiro de Geografia e Estatística
IDU Instituto de Desarrollo Urbano
INEC Instituto Nacional de Estadísticas y Censos del Ecuador
LRT Light Rail Transit
LTD Ley de Desarrollo Territorial
NMT Nonmotorized Transport Infrastructure
POT Plan de Ordenamiento Territorial
SDG Sustainable Development Goals
xxiii UPZ Unidad de Planeamiento Zonal
UN-HABITAT United Nations Human Settlements Programme
UNESCO United Nations Educational, Scientific and Cultural Organization
1
CHAPTER 1: INTRODUCTION
1.1.Background and research problem
Bus Rapid Transit (BRT) is a cost-effective mass transportation system characterized by exclusive bus lanes and reduction of travel times, high-passenger capacity and level boarding, and a relatively short construction process. BRT systems have bus stations and terminals along main transportation corridors where passengers can shift transportation modes or take feeder routes that extend the service into surrounding neighborhoods (Hidalgo & Graftieaux, 2008). 202 cities in the world are implementing BRT systems mobilizing more than 33 million passengers per day, from which 61.06% are in Latin America ("Global BRT Data," 2016).
2
BRT corridors, little is known about the extent by which BRT systems can generate or stimulate TOD (Cervero & Dai, 2014; Gakenheimer, Rodriguez, & Vergel-Tovar, 2011).
Nevertheless, it is also important to examine this relationship the other way around: how the built environment influences the performance of the BRT system in terms of ridership levels. Estimates of future travel demand along BRT corridors are made based on socio-economic and demographics data and origin-destination studies (Galicia & Cheu, 2013), but scholars argue that urban design and built environment attributes certainly play an important role on travel behavior (Boarnet, 2001). Several studies have been developed in the US looking at the
relationship between travel and the built environment in terms of vehicle miles traveled (VMT), vehicle trips (VT) and attributes known as the five “Ds” (density, diversity, design, destination and distance to transit). Contradicting results in relation to the extent by which these built environment variables such as land use mixed and density can play on travel behavior suggest further research is needed in order to determine the effects of the built environment on travel (Ewing & Cervero, 2010). Little is known about this association with the implementation of BRT systems, especially in cities with different spatial structures than North America (Cervero, 2013).
Coordination between urban transportation and land use is one of the challenges faced by cities experiencing accelerated urban growth. Rapid urbanization and fast motorization trends further complicate these challenges in developing countries (Cervero, 2013). The rate of
3
growth context causing environmental issues in a higher scale than in more developed countries due to their higher demographics trends (UN-Habitat, 2012).
While admittedly a challenge, the integration of land use and urban transportation is also an opportunity to promote TOD. The TOD concept looks to improve air quality, preserve open spaces, increase ridership and revenue to transportation systems, provide pedestrian friendly areas, control urban expansion and concentrate urban development around rail and bus transit facilities (Cervero, Murphy, Ferrel, Goguts, & Tsai, 2004). If executed effectively, TOD offers a unique possibility to address issues such as urban sprawl, a lack of walkable environments, car-oriented development and its associated traffic congestion as well as high levels of socio-spatial segregation (Delmelle & Casas, 2012), uneven development (Atkinson-Palombo & Kuby, 2011), and economic (forgone revenue sources for local governments) in terms of limited application of value capture mechanisms (Gakenheimer et al., 2011). Enhancing accessibility through the integration of public transportation with land use planning can increase the sustainability of urban development, generating benefits such as reductions in travel times and transportation costs, reduced air pollution and greenhouse gas emissions, greater social equity, and control against urban sprawl through compact urban development.
1.2.Conceptual Framework
1.2.1. Aim1: Understanding the impacts of BRT on the built environment.
This dissertation seeks to test hypotheses regarding theories about urbanization with the aim to contribute in the understanding of built environment impacts of BRT systems.
4
only consume housing and other goods. Land rent gets higher in the high activity node known as CBD so that population density is also expected to increase on this location. The dynamics of the cities’ structure are determined by the population, the agricultural rent (edge of the city),
commuting cost (location in the city) and income (capacity to pay for a location) (Brueckner, 2011). Accessibility benefits introduced by transportation investments can be capitalized into property prices by landowners. As a result, it is expected that landowners will improve their properties due to higher returns, developers will seek development opportunities as a result of the accessibility benefits or even local actors could try to acquire land before the introduction of transportation investments (Rodriguez, Vergel-Tovar, & Camargo, 2015).
TOD areas can become new activity nodes or even become new CBD areas where there is high concentration of activities and higher densities. TOD can concentrate several activities generating a housing price curve in which housing could become more expensive within the TOD area. Certainly, this housing price curve constitutes an equity challenge for TOD areas in terms of providing access to land and housing for low-income groups after transportation
investments have been made, especially within an enhanced urban environment oriented towards transit with high quality public spaces and concentration of urban services and facilities. At the same time, higher densities with a mixture of land uses and pedestrian friendly urban design in the TOD area are expected to contribute to higher transit ridership because the high
concentration of activities (Cervero, 2007; Cervero et al., 2004; UN-Habitat, 2013).
Second, the concept of uneven development in the contemporary world suggests the increasing inequalities in cities are the result of the concentration of wealth at different levels as a result of the flow of capital investments from transactions in a globalized world where
5
related to physical infrastructure and transportation investments (De-Mattos, 2010; Harvey, 2006, 2009). Within this context, gentrification dynamics could take place as a result of this new investments and potential increments on land and property prices which could generate potential displacement issues for current residents by market forces who can no longer afford the living costs in gentrifying areas, such as the case of several metropolitan areas in the United States (Hackworth, 2007). The urban policy response has shifted towards the capitalist production in cities, especially in urban renewal and redevelopment projects giving less priority to social issues, such as the displacement of residents from these areas (Smith, 2002). Scholars have identified challenges for urban planning and policy due to the new relationship between private capital owners and the state by promoting growth through urban development processes: i) concentration on efficiency, predilection for private and market-oriented solutions, focus on development strategies that seek to attract capital as part of investment opportunities, lack of a democratic agenda due to only clients are consulted and privatization might reduce transparency, and an indifferent attitude in front of unequal treatments, exclusion, segregation and other
undesired social outcomes (Sager, 2011).
6
investments could also generate gentrification dynamics as a result of land value increments reinforcing inequalities in terms of exacerbating segregation dynamics in cities. Scholars argue the urbanization surplus could be capture to promote social justice within a capitalist framework (Fainstein, 2010). In Latin America, value capture mechanisms have been discussed by scholars as a potential approach towards mobilizing land value increments in order to finance not only urban infrastructure but also affordable housing (Smolka, 2013). An equity perspective on TOD areas suggests approaches with land management tools including value capture mechanisms could address potential gentrification dynamics and promotes a more inclusive urban
environment providing access to low income groups to land and housing (Pendall,
Gainsborough, Lowe, & Nguyen, 2012). In Latin America, innovative planning tools as part of bottom-up approaches not only could acknowledge the expression of social movements to get access to urban services but also their role as active actors shaping the built environment (Irazabal, 2009).
The implementation of mass transportation systems, the conditions of the real estate market, the provision of building materials and the urban growth process in general is also affected by macro forces. Economic growth impacts the real estate sector and investments on both transportation and land development sectors. Social conditions determine needs for social services and access to credit from financial institutions and job opportunities.
1.2.2. Aim 2: Understanding the influence of the built environment upon BRT ridership.
7
TOD is understood as a way to increase ridership based on the expectation that higher densities imply higher ridership, which not only can guarantee the financial sustainability of the
transportation system, but also may increase revenues for the transportation agency through value capture (Cervero et al., 2004; TCRP, 2002). In a high density city like Taiwan, the study of metro stations ridership found a positive association with TOD features such as floor-space area, density and pedestrian infrastructure, but a negative association with connectivity and
insignificant by mixed land use (Lin & Shin, 2008).
Many studies have examined the importance of the built environment for travel behavior and transit use, but much fewer have focused on BRT. In the US, Ewing and Cervero suggested that conflicting results regarding the extent to which built environment variables such as mixed land use and density may play on travel behavior require further research in order to determine the effects of the built environment on travel (Ewing & Cervero, 2010). Another study found positive associations between road facility designs and proximity to ciclovías lanes with physical activity in Bogotá, while built environment attributes such as land use have not (Cervero,
Sarmiento, Jacoby, Gomez, & Neiman, 2009). The presence of pedestrian infrastructure and the quality of the walking environment within the catchment area of BRT stations also suggest people walk farther in order to get BRT stations (Jiang, Zegras, & Mehndiratta, 2012). In addition to the five “Ds” variables, parking and demographics have been also introduced on some studies looking at the relationship between land use and travel (Boarnet, 2001; Ewing & Cervero, 2010; Handy, 2005).
8
pedestrian infrastructure and density can influence BRT travel behavior (Estupiñán & Rodríguez, 2008; Rodríguez, Brisson, & Estupiñán, 2009).
1.3.Research objectives
1.3.1. Aim 1: Understanding the impacts of BRT on the built environment in Bogotá (Colombia) and Quito (Ecuador).
Since 2000 and 1996 respectively, Bogotá and Quito have been implementing BRT corridors in a staged fashion, offering an opportunity to measure land (re)development impacts before and after the introduction of BRT as well as BRT’s capacity to generate transit oriented development (TOD). As Andean cities, Bogotá and Quito have similar features: high densities, comparable building technologies, presence of informal settlements on their peripheries and urban growth boundaries that have been determined mainly by geographic characteristics. However, land use planning tools, public sector characteristics and land markets dynamics differ between these two cities, as does the scope of the BRT intervention over time. The first aim of this dissertation examines the built environment impacts of BRT and its relationship with affordable housing provision by estimating the effects of this type of mass transit systems on land use and development outcomes after their implementation. This quantitative analysis is followed by a qualitative analysis as part of a multimethod approach. The qualitative data analysis of semi-structured interviews with key participants in both cities identifies the themes that explain built environment changes and outcomes identified in the quantitative analysis.
1.3.2. Aim 2: Understanding the influence of the built environment upon BRT ridership in seven cities in Latin America.
Understanding the factors that contribute to BRT ridership is critical to justify
9
This dissertation seeks to bridge the gap in the study of BRT ridership and built environment attributes influencing travel behavior. This dissertation also seeks to contribute in the study of TOD features and its association with BRT ridership at the station level. A cross sectional data study is developed looking at associations of built environment attributes and BRT ridership in 120 BRT stations located across seven cities in Latin America (Bogota in Colombia; Sao Paulo, Curitiba and Goiania in Brazil; Ciudad de Guatemala in Guatemala; Quito and Guayaquil in Ecuador). Employing this quantitative approach, this research contributes to the understanding of the relationship between travel and the built environment in the case of BRT systems at the station level.
1.4.Relevance and significance
The two goals of this dissertation contribute to fill the existing knowledge gap by expanding our understanding of the reciprocal relationship between BRT and the built
10
Empirical studies examining this reciprocal relationship between BRT and urban development in parallel are limited. Moreover, employing a multimethod approach that
11
CHAPTER 2: LITERATURE REVIEW
2.1.Introduction
This chapter is structured in three main sections and a summary. The first section explores the origins and evolution of bus rapid transit (BRT) with the aim to converge into a definition of the BRT concept as part of this dissertation. The review of these origins starts by looking at the evolution of the exclusive bus lanes concept in different latitudes. Then, the evolution of BRT in Latin America is described as part of the process to establish a definition of what BRT is. The second and third sections consist on the review of the literature according to the two aims of this dissertation.
Regarding land use and development impacts of BRT (aim 1), the review discusses the built environment impacts of mass transit, focusing on three relationships related to BRT’s city shaping impacts: i) studies looking at the relationship between BRT and urban development conducted in cities implementing this type of mass transit system in Latin America, North America and Asia; ii) studies looking at the relationship between bus rapid transit and the concept of transit oriented development (TOD); iii) the review includes studies looking at equity on urban transport in relation to affordable housing issues.
12
on the literature about the relationship between BRT, travel behavior and the built environment. The review in this section also focuses on the impacts of TOD on ridership.
The chapter closes with a summary of major findings and gaps in the literature for both aims of this dissertation.
2.2.The origins and evolution of Bus Rapid Transit – BRT
2.2.1. From segregated bus lanes towards bus-based mass transit systems
The origins of the BRT concept come from the evolution of the idea to provide
segregated bus lanes to increase capacity and reduce travel times for bus based systems. Latin America is considered the cradle of BRT due to the evolution of the idea of segregated bus lanes along major arterial roads and freeways towards an urban transport system. As a result, the region currently has the highest number of cities with this type of mass transit system under operation in the world. This section discusses the origins of the segregated bus lanes concept and its evolution in Latin America towards the implementation of BRT systems. This section also discusses different definitions of BRT in the literature as part of this evolution process of segregated bus lanes towards bus based mass transit systems.
13
segregation of bus lanes concept with the implementation of infrastructure such as stations and boarding platforms, an operation system with a large coverage in the city. In the 1990s, Quito (Ecuador) becomes the first the city to implement a BRT system outside Brazil. In the 2000s, Bogota (Colombia) implements a BRT system based mainly on the experiences of Curitiba and Quito (Mejía-Dugand, Hjelm, Baas, & Ríos, 2013).
Nevertheless, there is not a general agreement regarding the origin of the BRT concept. The idea of express bus transit for freeways was first proposed in North America; however, the construction and implementation of express buses on segregated lanes as part of a mass transit system was finally developed in Latin America. Four cities in North America proposed express bus routes along freeways. The Express Bus Rapid Transit Plan for Chicago developed in 1937 is claimed by some scholars as the first suggested BRT plan, which proposed to convert three rail rapid-transit lines into express bus services along highways. Between 1956 and 1959, the Mass Transportation Survey for the capital region of the United States (Washington DC metropolitan area, United States) recommended three or four roadways separated by a mall (64-foot and 51 feet) connected with cross-street bridges, which would be served by express buses operating on mixed traffic lanes but eventually in the future there would be allocation for segregated bus lanes. In 1959, an elevated loop of three lanes bus roadway was proposed for the city of Saint Louis (Missouri, United States). In 1970, the city of Milwaukee (Wisconsin, United States) proposed the development of express bus routes along the freeway system serving the metropolitan area (Levinson et al., 2003).
14
investments the design of enhanced bus stations with pre-boarding fare collection and transfer with feeder routes at bus terminals. This mixture of features is the point of departure of what is considered BRT nowadays. Curitiba is considered the cradle of this type of mass transit system known as BRT due to the implementation of this type of bus-based mass transit system in the design of the City’s Master Plan in 1965. The transportation planning process became part of the city planning process as part of the design of the Master Plan with the goal to guide the urban growth process of Curitiba along exclusive bus lanes (Santos, 2011).
In addition to the designation of exclusive bus lanes, Curitiba also introduced land use planning measures by promoting mixed-use land developments along the five main segregated bus lanes known as BRT corridors, which converged at the city center (downtown). This approach has been shaping the urban form along the segregated bus lanes corridors with linear high-rise developments and concentrating population densities along the exclusive bus lanes. The long-term vision defined in the Master Urban Plan of Curitiba under the leadership of the city mayor of the time, architect and urban planner Mr. Jaime Lerner (who served three non-consecutive terms), included urban design measures prioritizing people over cars such as pedestrian areas in downtown. This innovative approach integrating land use and transportation planning is what made Curitiba a transit metropolis (Cervero, 1998).
Brazil is considered the pioneer in the implementation and development of this type of bus-based mass transit systems not only due to the experience of Curitiba, but also the
15
BRT system along the “Eixo Anhanguera” connecting the east and the west sides of the city crossing the downtown area. Porto Alegre and Sao Paulo implemented bus services along segregated lanes including the reduction of transfers for passengers by allowing buses to serve final destinations outside the corridor. These innovations allowed an increase in terms of capacity of bus services up to 20,000 passengers per hour direction (Thomson, 2007).
During the 1980s, a rapid growth of BRT took place in Brazil. The city of Recife implemented segregated bus lanes in 1982 along the East-West corridor. Between 1986 and 1987, two more cities in Brazil implemented segregated bus lanes, Campinas (Sao Paulo State) and Campo Grande (Mato Grosso State). In 1988, the “Trolebus” project was implemented along what is known the ABD corridor as part of the regional strategy to connect industrial areas located at the south of the city of Sao Paulo, specifically the Municipalities of Diadema, Sao Bernardo do Campo, Santo André and Mauá (Zioni, 1999).
The dissemination of the Brazilian experience spread out in Latin America. The Brazilian experience became a point of reference of mass transit including segregated bus lanes, fixed bus stops, stations and bus terminals with transfers and pre-boarding fare collection. Some factors made possible to share the Brazilian experience such as the development of urban transport seminars, information on the mass media and the training in Brazil of urban transport planners from other cities in the region. Two major cities in the region that have implemented segregated bus lanes systems at a large scale based on the Brazilian experience are Quito in Ecuador and Bogotá in Colombia (Mejía-Dugand et al., 2013).
16
The training of Ecuadorian planners in Brazil had a significant influence in this process due to these transport planners returned to Ecuador, specifically Quito, after their studies in Brazil in order to implement what they learned during the graduate studies in Brazilian Universities and institutes (Interview with a transportation planner in Quito).
Inspired and influenced by the Brazilian experience, Ecuadorian transportation planners designed and implemented in Quito a segregated lanes system with electric buses known as “Trolebus” that began operations in 1996. This system not only improved accessibility in the Historic Center, part of the World Heritage List by UNESCO, but also connected the south and the north areas of the city. Both areas have been geographically divided due to the
“Machangara” River and the “Panecillo” Hill next to the Historic Center. The “Trolebus” system reduced pollution and noise with the electric buses and incorporated a prepayment boarding system at stations located in the middle of “Av. 10 de Agosto” in the North and “Av. Vicente Maldonado” at the South of the city. Three bus terminals were constructed as part of this first stage of the “Trolebus” system. At the north, the BRT Terminal La Y was built at the end point of “Av. 10 de Agosto”, close to the Airport of the time. At the south, the BRT Terminal “El Recreo” was built in order to provide transfers to passengers coming from the South, including the urban expansion area known as “Quitumbe”. At the geographic center of the city but close to the Historic Center, the multimode Terminal “La Marin” was built in order to generate a transit node connecting several services and transportation modes, including those coming from the valleys at the east of the city (Lopez, 2003).
17
Transmilenio at the end of the 1990s. The segregated bus lane corridor “Troncal Caracas” was built in Bogota along what is considered the backbone arterial road of the city connecting the North (“Autopista Norte” arterial road) with the south (local district of “Usme”). In 1989, the “Troncal Caracas” was built with four segregated lanes, two for each direction, allowing private bus operators to attend the demand with existing routes along this corridor as well as further north and south after the segregated bus lanes ended at both extremes. The “Troncal Caracas” used to function as a closed system in terms of giving priority to bus routes operating along the exclusive lanes, but the same buses used to work as feeder routes after crossing the whole axis. However, the experience with “Troncal Caracas” can be understood from two angles. Several issues resulted from this experience such as decrease in the level of service, operational issues, traffic safety, an aggressive design of shelters and the absence of a policy to restructure the public transit system in the city (Thomson, 2007).
At the end of the 1990s, in the absence of funding from the National Government of Colombia for the subway project, Bogotá began the process to design a bus rapid transit (BRT) system based on the experiences of Curitiba and Quito. Transportation planners from Bogota traveled to Curitiba and Quito in order to learn from the experience of these cities with segregated bus lane mass transit systems (Ardila, 2004).
18
(for selected stops), Transmilenio increased significantly the operational capacity of the system. The system was also innovative in terms of the design of stations and terminals by including cutting edge urban design features and materials and interventions on public spaces with pedestrian infrastructure and facilities around BRT Terminals located at the North, South and West ends of the corridors (Cain, Darido, Baltes, Rodriguez, & Barrios, 2007). These BRT Terminals known as “Portales” in Bogota provide transfers to feeder routes that serve neighborhoods located close to these terminals and thus increasing the serving area of the system.
Curitiba and Bogota are considered the two tipping points in the spread, innovation and evolution of bus-based mass transit systems known as BRT, influencing not only other cities in Latin America but also in the world. Previous research suggests the flexibility and
19
2004; Mejía-Dugand et al., 2013). Between 1974 and 2000, after the construction of the BRT systems in Curitiba (1974), 41 cities have implemented this type of mass transit system in the world, from which 17 are located in Latin America. Since 2001, after the BRT system in Bogota started operations, 162 cities in the world have implemented this type of mass transit system. Nowadays, there are 202 cities in the world implementing this type of mass transit system ("Global BRT Data," 2016).
2.2.2. The concept of Bus Rapid Transit - BRT
There is still no general agreement in the definition of the BRT concept. Definitions in the literature are discussed below.
BRT has been defined in relation to similar features this system offers in relation to rail based systems. BRT has been considered a “rubber-tired light-rail transit (LRT)” defined as a flexible transit mode “that combines stations, vehicles, services, running ways, and Intelligent Transportation System (ITS) elements into an integrated system with a strong positive identity
that evokes a unique image”. The Federal Transit Authority (FTA) defines BRT as a “rapid mode of transportation that combine the quality of rail transit and the flexibility of buses” (Levinson et al., 2003). BRT has been also seen as a system that emulates the characteristics, performance and amenities of modern rail-based systems but with lower construction and operational costs. BRT has been defined as “a high-quality bus-based transit system that delivers fast, comfortable and cost-effective urban mobility through the provision of segregated right-of-way infrastructure,
rapid and frequent operations, and excellence in marketing and customer service” (Wright, 2011).
20
reduction of travel times, high-passenger capacity and level boarding, and a relatively short construction process. BRT systems have bus stations and terminals along main transportation corridors where passengers can shift transportation modes or take feeder routes that extend the service into surrounding neighborhoods (Hidalgo & Graftieaux, 2008). BRT includes features that seek to improve and make more efficient bus traffic: segregated bus lanes, comfortable and modern infrastructure (buses, stations, fare collection technology), modal integration, marketing identity, and institutional transformation with the creation of a BRT agency (Ardila, 2004).
Within the spectrum of road based transit, BRT has been defined according to three upper levels of the spectrum. BRT-lite is understood as a system with some priority but not full
segregated busways that improves travel times, provides high quality shelters, introduces clean technologies and has a marketing identity. BRT includes segregated busways, typically pre-boarding fare payment, higher quality stations, clean vehicle technology and marketing identity. At the end of the spectrum is the Full BRT, a metro quality system with an integrated network of routes and corridors, closed high quality stations, per-board fare collection and verification, frequent and rapid service, modern and clean vehicles, marketing identity and superior customer service (Wright, 2011).
BRT is also understood as an improvement on operation and infrastructure of
conventional bus services. The operational improvements are related to the upgrading of the technology of buses, travel times, frequency reliability, comfort and accessibility. The
21
standard tool emerged as part of a methodology to classify BRT systems according to the elements and characteristic of the system. The standard also seeks to determine the quality of BRT systems by identifying categories according to the assessment of the elements and characteristics (ITDP, 2014a).
The BRT standard emerged as a technical document developed by urban transport experts with experience with this type of mass transit systems in order to define not only the BRT
concept but also its main elements and characteristics. This technical document also provides an evaluation framework to determine the different levels a BRT system can achieve based on best practices. The BRT standard suggests the necessity to build a common definition of what BRT is in order to evaluate the performance of this type of mass transit system around the world. This effort to determine what BRT is seeks to establish an international measure of different BRT features so that cities with some of them can work in the achievement of what constitutes a BRT system. The five essentials BRT elements identified by the BRT standard are: busway alignment, dedicated right-of-way, off-board fare collection, intersections treatments and platform-level boarding (ITDP, 2014a).
The BRT standard also measures the performance of the system at the BRT corridor level or trunk corridor. The BRT trunk corridor definition shows again the importance of the
22
service and passenger information systems, access and integration with other transportation modes.
2.3. Built environment impacts of mass transit: BRT’s city-shaping impacts (Aim 1)
Table 1 shows the summary of studies about the relationship between BRT with property values, land use and development.
2.3.1. BRT and urban development
The implementation of BRT systems has raised important questions regarding its city-shaping impacts. In fact, little is known about the land use development and redevelopment impacts of these systems and their capacity to shape urban form and urban development. This is partially the result of few studies exploring the ability of BRT systems to induce land
development (Stokenberga, 2014). The majority of studies about the relationship between BRT and the built environment have focused on the association between access to BRT and property values. Perhaps this emphasis is due to the study of land development impacts requires longer periods of time in order to capture the impacts of BRT systems in land use change and
developments. The necessary time window expected for changes on property values usually tends to be shorter than development changes as a result of the implementation of transportation investments.
23
(Rodriguez & Targa, 2004). Another cross sectional study found premiums for properties less than five minutes walking distance to BRT feeder routes (Munoz-Raskin, 2010).
Quasi experimental studies have shown inconsistent findings. A first study, found no premiums in residential and commercial properties, except when the results were statistically significant with a 22% premium for properties with access to the BRT (Perdomo, Mendoza, Mendieta, & Baquero, 2007). A second study, found property price increments of residential properties between 15% and 14% asking prices higher than in the control areas (Rodriguez & Mojica, 2009). A difference in difference analysis in Bogotá found a significant increase in densities in zones served by the BRT, especially those served by feeder routes (Bocarejo, Portilla, & Pérez, 2012). However, this study found the presence of the BRT in Bogota did not induce a higher increase in built-up area (commercial, office and residential land uses). In Mexico, the announcement of a BRT corridor in Ecatepec (Mexico) appeared to have no impact on property values (Flores Dewey, 2012). A before and after comparative study of Bogota and Quito found heterogeneous land development impacts of BRT. High development activity took place in close proximity to some BRT stops but around others this activity was not high. However, around BRT terminals at the end of trunk corridors it was found high development activity in both cities (Rodriguez et al., 2015).
24
an increase in jobs within 0.25 miles from BRT stations (A. C. Nelson et al., 2013). One study of the Silver Line in Boston found positive changes on average sales prices of condominiums. In areas served by the Silver Line, the study found an increase of parcels converted to
condominiums between 2003 and 2009 (V. A. Perk, Catala, & Reader, 2012). A recent study of nine cities in the US found positive development outcomes in areas served by BRT, an increase from 11.4% to 15.2% of new office space and multifamily developments have double their share since 2008 within a 0.50 miles from BRT corridors (Nelson & Ganning, 2015). It is important to highlight that operational and performance characteristics of BRT systems in North America differ significantly from BRT systems in Latin America. For instance, few BRT systems in North America have segregated bus lanes and levels of ridership differ significantly between both regions. The design of stations and constructions of BRT terminals is common in Latin America but that is not the case in some BRT systems in North America. This difference is related to the high level of motorization in North America as well as due to higher provision of car-oriented infrastructure.
25
residential properties within a buffer area of 500m of the BRT system. This study also found increments of 2.3% (annually) on average values of residential properties in areas served by the BRT in comparison to control areas between 2004 and 2009 (Deng & Nelson, 2010).
Even though there has been an emergence of studies looking at land use change and land development impacts of BRT systems, few cities have been studied in relation to changes at the land parcel level. This paucity suggests the necessity of a long term time-window in order to measure changes on land uses and developments. Changes on the built environment usually take more time to happen than the time-frame needed to implement mass transit investments. The quasi experimental study conducted in Seoul (Korea) by Cervero and Kang (2011) explores land use changes using land parcel data. This study found an intensification of land uses along BRT corridors. This study also identified that accessibility benefits introduced by the BRT system were translated into higher real estate prices, with a significant change for residential land uses that changed into multifamily residential land uses. This study employing a multilevel logit model found that within half kilometer from a BRT station residential land uses are more likely to convert to more intensive land uses in comparison to land parcels located further from the station. The approach in this study does not include comparison groups and seeks to establish the probability of land use change in relation to some explanatory variables related to location, land values, regulations, neighborhood and demographic attributes.
26
500mts buffer area for feeder routes and 1km for BRT trunk corridors and compared with changes in the rest of the city. The findings of this study suggest a 7% change on floor area ratio in the buffer area for the second phase of the BRT and the feeder routes, but a 10% change in the rest of the city (Cervero & Dai, 2014). In the second level of analysis, the study took buffer areas of 500meters and 1km around four BRT terminals as treatment groups and then compared changes on floor area ratio with neighbor urban areas just next to the BRT terminals. Based on these two levels of analysis, the study found a higher activity around BRT terminals as a result of land development opportunities, especially for commercial land uses such as shopping centers. This finding is related to the concentration of travel demand and the high flow of passengers at these transfer multimodal nodes where passengers can take feeder routes.
The study conducted in Bogota for the publication Transforming Cities with Transit has some limitations. The study has the limitation of not having included land parcel data before 2004 so that the analysis is not capturing the impacts of the first phase of the BRT system which began operations in 2001. The study also has the limitation of measuring floor area ratio without including an analysis of changes in built-up areas. At the BRT station level, the study has the limitation of matching BRT terminals and station buffer areas with neighboring urban areas which lack the size of BRT trunk corridors among other characteristics such as road
27
2.3.2. BRT and transit oriented development (TOD)
What is transit oriented development? Even though it has been understood as an urban form with a high quality pedestrian environment, a mixture of land uses with various densities in close proximity to transit corridors or stations, the emphasis of these attributes in the definition of TOD varies across fields and latitudes. The idea of urban development or the built
environment with high transit orientation exists before the automobile era. However, it is after the advent of automobiles that the definition and implementation of TOD is challenging as a result of significant changes on travel patterns and thus on urban development, such as the emergence of suburbanization, and thus some scholars argue that TOD should not be seen as a panacea in order to address this phenomena (Dittmar & Poticha, 2004).
In the urban design field, TOD emerged as a concept characterized by the organization of urban growth in compact urban forms supporting transit, promoting the location of activity nodes within walking distance of transit stations, generating pedestrian environments connecting to local destinations, providing a mixture of different housing typologies in terms of densities and costs, making development oriented towards high quality public spaces and encouraging infill and redevelopment measures along transit corridors (Calthorpe, 1993).
Another approach towards the definition of TOD suggests this concept should be understood in terms of its performance. In this way, TOD can be measure and assessed by different actors in relation to the achievement of five goals. First, the location efficiency goal refers to assess the accessibility the transit node provides to users and residents in relation to connect them with their destinations at the local and regional levels. Second, the rich mix of choices goal seeks to evaluate the diversity of the urban environment in close proximity to
28
benefits introduced by the transit investment. Fourth, the place making goal refers to the
influence of urban design features such as pedestrian infrastructure and public spaces creating a more vibrant place that is attractive for visitors and riders. Fifth, the assessment of how a TOD environment make a transit station or stop more vibrant place instead of being a transit node facilitating the flow of passengers towards their destinations (Dittmar & Poticha, 2004).
In the smart growth literature, TOD has been conceived as part of land use and economic development strategies to generate more compact urban forms, focusing on higher densities along transit corridors. The smart growth movement seeks to reduce urban sprawl patterns
characterized by low densities, car-oriented developments, and homogenous urban environments. In opposition to urban sprawl, the smart growth approach suggests to promote more compact urban developments, pedestrian friendly with a mixture of land uses, transit, and the
revitalization of the urban environment. The smart growth approach also seeks to preserve green areas from being urbanized through suburbanization patterns such as urban sprawl. In this way, smart growth is understood as a land use planning strategy that promotes higher densities along transit corridors in order to dis-incentivize the use of automobiles and contribute on the reduction of urban sprawl patterns based on the idea to give priority to transit investments over investments for highways (Knaap & Talen, 2005).
A distinction in the smart growth literature highlights the difference between the concepts transit-adjacent development and transit-oriented development. The former refers to
developments located next to or adjacent to transit investments but they do not necessarily take all the advantages in terms of location near transit, especially in terms of densities and
29
friendly environments, mixture of land uses with high-density developments including office and retail spaces (Renne, 2009). This distinction becomes important given that in addition to smart growth policies focusing on concentrating development in close proximity to transit, the quality of the built environment including additional features such as public spaces, pedestrian
infrastructure and transfer between transportation modes becomes relevant.
In the new urbanism literature, TOD is a concept embraced by advocates of more compact urban forms with high quality walking environment, with a mixture of land uses and several housing typologies and transit friendly. The new urbanism movement is mainly focused on the urban design approach and thus on the physical aspects of the urban environment in terms of architecture and urban space (Knaap & Talen, 2005). In this approach, transit is seen as an additional factor that makes the urban environment more livable but urban transport is not the focus of attention on this approach. The TOD concept in the new urbanism literature has a stronger connection with how the urban space benefits from a transit friendly environment rather than how the built environment is developed in relation to transit investments.
30
to the reduction of trips by automobiles. The study of household characteristics and travel
behavior of residents in areas in close proximity to rail stations in New Jersey found that housing typologies, density, access to bus services, and availability of parking facilities (off-street and on-street) are playing a more important role explaining the reduction of road congestion and automobile pollution (Chatman, 2013).
Studies looking at the capacity of transit to generate TOD have been mainly focused on rail investments. The well-known study looking at land development impacts of the Bay Area Rapid Transit System (BART) in San Francisco found TOD features around two BART stations: Pleasant Hill and Fremont. This study conducted matched-pair analyses between BART
corridors with freeways corridors in order to compare land use changes between both areas. This study also conducted analysis of land use changes over time around selected BART corridors and stations. The findings of this study suggest a significant difference with more multifamily
developments along the BART corridor than the control area. The findings suggest multifamily housing developments tended to occur more in higher density areas and closer to transit stations (Cervero & Landis, 1997). This study conducted predictions of land use changes with binomial logit and regression models. This study also found the supremacy of downtown San Francisco attracting developments after the implementation of BART.
31
intense land use change and higher concentration of developments from 1997 to 2010. At the regional level, TOD areas concentrated 65.6% of the residential development, 59.9% of office development and 18.6% of retail development (Ratner & Goetz, 2013). These findings suggest smart growth policies promoting developments in TOD areas not only attract investments but also increase densities and the mixture of land uses.
Another study conducted in Minneapolis (Minnesota, USA) estimated the effect of the light rail transit (LRT) on land use change. This study estimated land use changes over time with logit models and a quasi-experimental design with a difference in difference estimation looking at the effect of proximity to the LRT within half a mile before, during and after the construction of this transit project. At the corridor level, the study found that proximity to the LRT increases the likelihood of land use change on single family and industrial land uses (Hurst & West, 2014). The results of this study suggest land parcels within half a mile of LRT stations experience a small increase in the likelihood of land use change during the operation of the system. The study of the expansion of the Line B of the Metro system in Mexico City which opened between 1999 and 2000 has been studied in terms of the impacts on land use and density (Erick Guerra, 2014). This study compares the percentage of residents and population densities between 1994 and 2007. The findings suggests Line B had an impact in terms of increasing densities around stations but little to no impacts in relation to commercial land uses due to the absence of commercial developments in downtown areas served by this transit investment.