DISCUSSION PAPER SERIES
IZA DP No. 11471
Lieke Kools
Pierre Koning
Graded Return-To-Work as a Stepping
Stone to Full Work Resumption
Any opinions expressed in this paper are those of the author(s) and not those of IZA. Research published in this series may include views on policy, but IZA takes no institutional policy positions. The IZA research network is committed to the IZA Guiding Principles of Research Integrity.
The IZA Institute of Labor Economics is an independent economic research institute that conducts research in labor economics and offers evidence-based policy advice on labor market issues. Supported by the Deutsche Post Foundation, IZA runs the world’s largest network of economists, whose research aims to provide answers to the global labor market challenges of our time. Our key objective is to build bridges between academic research, policymakers and society.
IZA Discussion Papers often represent preliminary work and are circulated to encourage discussion. Citation of such a paper should account for its provisional character. A revised version may be available directly from the author.
IZA – Institute of Labor Economics
DISCUSSION PAPER SERIES
IZA DP No. 11471
Graded Return-To-Work as a Stepping
Stone to Full Work Resumption
APRIL 2018
Lieke Kools
Universiteit Leiden and Netspar
Pierre Koning
ABSTRACT
IZA DP No. 11471
APRIL 2018
Graded Return-To-Work as a Stepping
Stone to Full Work Resumption
*There is increasing evidence that graded return-to-work is an effective tool for the rehabilitation of sick-listed workers. Still, little is known on the optimal timing and level of grading in return-to-work trajectories, as well as the allocation of trajectories across worker types. To fill this gap, we analyze whether the effectiveness of graded return-to-work depends on the starting moment of the trajectory and the initial level of graded return-to-work resumption. We use administrative data from a Dutch private workplace reintegration provider. In order to correct for the selection bias inherent to the evaluation of activation strategies, we exploit the discretionary room of the case managers in setting up treatment plans. In correspondence with previous literature we find that graded return-to-work reduces sick spells with eighteen weeks within the first two years after reporting sick. However, the probability of work resumption after two years remains unchanged. Work resumption can be achieved faster when graded return-to-work is started earlier or at a higher rate of initial work resumption. These findings how- ever do not hold for individuals who have problems related to mental health.
JEL Classification: I18, C26
Keywords: activation, long-term sickness absence, graded return-to-work
Corresponding author:
Pierre Koning
VU University Amsterdam
Department of Economics, 7A-27 De Boelelaan 1105
1081 HV Amsterdam The Netherlands
E-mail: [email protected]
1
Introduction
In the past decades many Western countries have seen a rise in uptake of disability benefits
(OECD, 2010). In an effort to curb this trend, there has been an increased focus on
what disabled individuals can do at work, rather than what they cannot. For example,
in England sick notes have been replaced by a statement of fitness for work in 2010
(Wainwright et al., 2011), in Sweden general practitioners are recommended to subscribe
part-time sick leave rather than full time sick leave (Kausto et al., 2008) and in Denmark
sick-listed employees are since 2004 required to work partially after eight weeks of sick
leave unless a physician has stated this is impossible (Hernæs, 2017). In a similar vein,
part-time sick leave is often used as a workplace based intervention aimed at speeding
up the rehabilitation process of sick-listed employees. In these interventions usually the
amount of hours worked gradually increases over time, up to the moment that full work
resumption is achieved. The idea is that graded work prevents the loss of working skills and
may even speed up the recovery from certain injuries. For instance, Andren and Svensson
(2012) argue that particularly individuals with musculo-skeletal problems benefit from
graded work activities. Likewise, Individual Placement and Support (IPS) interventions
for sick workers with mental impairments are built upon the idea that work activities may
contribute to the recovery process.1
Research shows almost unanimously positive effects of graded work on work
rehabili-tation2, whereas interventions like vocational rehabilitation and regular paramedical care rather seem to lengthen sick spells (Markussen and Røed, 2014; Rehwald et al., 2016).
This however does not mean that graded return-to-work is beneficial for all individuals
(Andren and Svensson, 2012; Andren, 2014; Høgelund et al., 2012). Starting graded work
trajectories too soon or for too many hours may induce stress or strain on the body,
ham-pering the recovery process. In light of these considerations, it is important to understand
1Corrigan and McCracken (2005) argue that psychiatric problems can be addressed only for some
workers in real-life settings, so as to identify the cause of them.
2
what separates an effective graded return-to-work trajectory from an ineffective one.
In this paper we analyze how the specifics of the set-up of a graded return-to-work
tra-jectory determine its effectiveness. More specifically, we analyze if work resumption rates
change when the trajectory is started later or at a higher initial rate of work resumption.
For this we make use of registered data from a private workplace reintegration provider,
which performs case management for mostly small and medium sized firms. This provider
offered reintegration services for about 12,000 long-term sick listed workers, of which 62%
participated in graded work trajectories between the years 2011 and 2014. We observe
detailed worker information on the timing and the degree of grading that is used, as well
as information on impairment types, employer, and other individual characteristics. We
enrich these data with information on the case managers that were assigned to them by
the reintegration provider.
In order to correct for the selection bias inherent to the evaluation of activation
strate-gies, we follow an instrumental variables approach for which we exploit the discretionary
room of the case managers in setting up treatment plans. We use the tendency of a case
manager to focus on early/intense graded work (graded work propensity) as an
instru-ment to actually receiving such a strategy. In doing so, we follow a strand of literature
applying this technique in the context of activation strategies for sick-listed employees,
such as Dean et al. (2015), Markussen and Røed (2014) and Rehwald et al. (2016).3 As case managers may learn on the job or change their preference for graded work, we allow
graded work propensities to vary across years. Our key assumption is that the assignment
of (new) sick-listed workers to case managers is exogenous. We argue that this assumption
is plausible, as the assignment is driven by the direct availability of case managers.
More-over, all the individual information on new sick-listed workers that is available to the case
managers at the moment of intake is observed in our data. This means that any selection
on observables can be controlled for. Reversely, we also can test for the importance of
such selection effects by estimating model specifications without individual controls.
3
Our analysis also extends on earlier studies in this field of research by using
alterna-tive propensity measures that proxy the specifics of graded work trajectories. In line with
earlier work, we will first define case managers’ propensity measures as the likelihood of
initiating a trajectory for sick-listed workers that haven’t started one yet. With the
infor-mation of workers that have effectively started a trajectory, we next construct propensity
measures of case managers that proxy the timing of graded work during the sickness spell
as well as the graded work percentage that is applied. This then enables us to evaluate
the effects of differences in the timing and the degree of grading of the interventions on
(full) work resumption for those individuals that have started a graded work program. We
thus gain insight in the optimal timing of graded work and the importance of gradually
increasing the degree of grading.
We also shed new light on the determinants of graded work propensities and the
implications of this for the interpretation of our findings. Even though the case managers’
tendencies to use graded work interventions can be considered as exogenous, we cannot
be sure that they are uncorrelated with other case manager characteristics affecting the
likelihood of work resumption. For instance, high graded work propensities may be a
marker of high quality case managers that also show higher work resumption rates without
the use of graded work interventions. If so, the effectiveness of graded work interventions
will be overestimated. We therefore estimate model versions with various proxies for case
manager quality as additional controls. Among others, these proxies include the current
and past work resumption rates of (other) sick-listed workers that were assigned and
work resumption rates of workers that are out of our sample. When controlling for these
proxies, we are able to assess the extent to which graded work effects are truly driven by
the allocation to trajectories, rather than other case manager activities that are correlated
with graded work.
In line with earlier literature, we find overall positive effects of graded return-to-work.
Graded return-to-work speeds up the recovery process. At the same time, graded work
does not necessarily help rehabilitate individuals who would otherwise have not
rehabil-itated. We find an increase in the number of weeks worked during the first two years
the probability to return to work within two years. Moreover, we find that starting the
graded return-to-work trajectory earlier and at a higher rate of work resumption speeds
up the recovery process. Starting one week earlier raises the number of weeks worked in
the first two years with two weeks. Starting a graded return-to-work trajectory at a work
resumption rate which is 10 percentage point higher increases the probability to return to
work within two years with 2.5 percentage point. Work resumption rates are more strongly
affected by the moment that graded return-to-work is started than by the moments within
the trajectory at which the level of work resumption is increased.
The positive effects of graded return-to-work are especially strong for individuals who
have general medical conditions. For them the positive effects persist at the end of the
waiting period. For individuals with problems related to mental health we find no
signifi-cant effects of graded return-to-work. Moreover, and contrary to the overall findings, for
these individuals starting the graded return-to-work trajectory one week earlier decreases
the probability to return to work within two years with 3 percentage point.
In the following section, we explain the system of sick leave and disability insurance
in the Netherlands. Then, in Section 3 we provide descriptive statistics on the sick-listed
individuals in the data set, the graded return-to-work trajectories, and the case managers.
In Section 4, we explain our empirical strategy and underlying assumptions. We present
the results of the analysis in Section 5, followed by concluding remarks in Section 6.
2
Institutional setting
The Dutch disability system used to be notorious for its large and increasing number of
beneficiaries; at its peak those receiving benefits amounted up to 12 percent of the
in-sured individuals (Koning and Lindeboom, 2015). Since the beginning of the 21st century
disability insurance award rates have been steadily declining, due to a number of reforms
to the system. Among these reforms was the introduction of the Gatekeeper Protocol,
obliging employers and employees to engage in activities aimed at reintegrating sick-listed
workers into the workforce. As a consequence of the Gatekeeper Protocol, disability
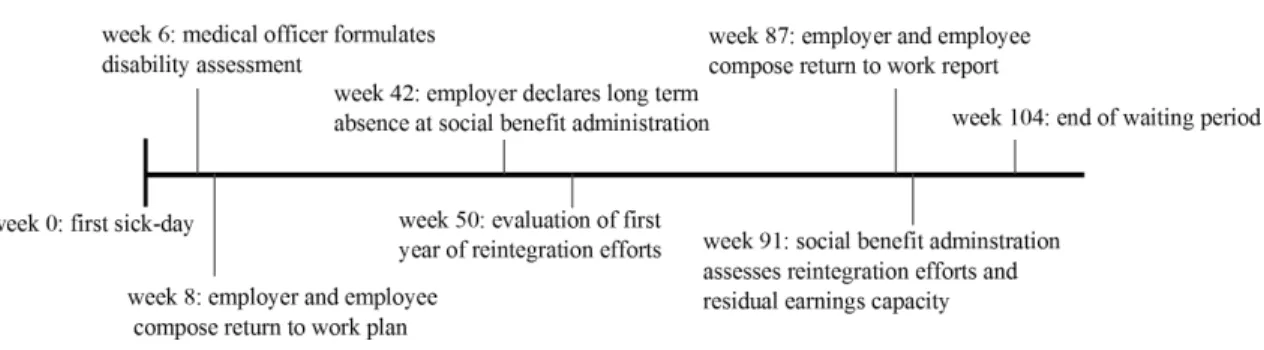
Figure 1: Time line of the gatekeeper protocol.
2013). This positive effect can partly be attributed to improved screening, making it more
difficult to use DI as an alternative exit root for Unemployment Insurance (de Jong et al.,
2011). Moreover, increased employer responsibilities have played a crucial role in curbing
the rise in DI beneficiaries, both as a stimulus to actively prevent sickness and as a way to
accommodate activation strategies for sick-listed workers (Koning and Lindeboom, 2015).
As a result of the reforms the Netherlands has a rather unique, largely privately
orga-nized sickness and disability system (Koning, 2017). This section describes those elements
of the system that are relevant for understanding the context within graded return-to-work
is used.
2.1 Gatekeeper Protocol
In the Netherlands all workers are insured against income losses due to injuries, irrespective
of having incurred the injury at the workplace or not. Individuals can apply for DI
benefits after a two year waiting period, during which the employer is obliged to continue
payments of at least 70% of the employees regular salary.4 In practice, most Collective Labor Agreements stipulate full wage payments in the first year and 70% in the second
year. During these two years, sick-listed workers can start with graded work or adapted
work. As long as the waiting period proceeds and the worker has not fully recovered, wage
payments are continued.
During the waiting period the employer and the employee are obliged to undertake
efforts towards re-integration of the sick-listed employee. The Gatekeeper Protocol (in
4
Dutch: Wet verbetering Poortwachter) gives directions as to what these efforts should
entail. Figure 1 shows a time line of the concrete steps that need to be taken under the
Gatekeeper Protocol. In the sixth week a disability assessment should be conducted by a
medical officer (company doctor). This assessment is used as input for a reintegration plan,
due in week 8. This plan is composed by the employer and employee, and should stipulate
the reintegration aim5 and the planned steps towards reaching this aim. A case manager should be appointed to keep track of the reintegration process and the return-to-work plan
may be reevaluated at set dates.
After 42 weeks of sick-listing, the employer has to declare the sick-listed employee to
the Social Benefit Administration (responsible for Disability Insurance) and after a year
the reintegration efforts undertaken so far have to be evaluated. In the 87th week the
employer and employee have to compose a return to work report, including all the
reinte-gration efforts taken. This report will be assessed by the Social Benefit Administration in
the 91th week, when also the residual earnings capacity of the individual is established.
Finally, at the end of the waiting period the individual can apply for (wage-related) DI
benefits granted that (1) both employer and employee can show they have taken adequate
reintegration measures and (2) the individual has a residual earnings capacity of less than
65% of his/her pre-disability earnings. In case the employer has not shown sufficient
collaboration, the waiting period can be extended with one more year at maximum.
2.2 Private insurance of continued wage payments and case management
Employers can insure themselves against the risk of the continued wage payments during
the waiting period via private insurers. Approximately 76% of Dutch employers has such
an insurance (de Jong et al., 2014). The employees of the uninsured and insured firms
are similar in terms of age and gender, however insured firms are usually smaller than
the uninsured firms. 78% of firms with 2-10 employees has an insurance for continued
wage payments, whereas only 27% of firms with more than 100 employees has such an
insurance. For small employers the risk of continued wage payments is similar to large
5Preferably, the reintegration aim should be (partial/adapted) employment with the current employer
firms, the relative burden however is higher. Insurers can offer the possibility to not only
insure wages, but also insure all the costs that come with the obligations of the Gatekeeper
Protocol. At least 67% of the insured firms have such a ‘broad’ insurance (de Jong et al.,
2014). One such obligation is to assign a case manager that serves as a link between all
the parties involved and keeps track of the progress of the sick-listed employee.6
During the waiting period, the sick-listed employee is allowed to work partially. The
employee can either do therapeutic work wherein he or she is considered as an extra pair
of hands, or do graded work. In the latter case, the employee engages in productive work
and the employer pays for those productive hours worked and the insurer only pays the
hours foregone. For example, if an employee engages for 20% in graded work, he gets
paid 100% of his pre-sickness wage of which 80% is covered by the insurer and 20% by
the employer. As the case managers are hired by the insurer, they have a direct financial
incentive to actively keep track of the individuals’ residual earnings capacity and to try to
get the individual to participate in paid work for as much as deemed possible. With full
insurance and full sick pay coverage, direct financial incentives are obviously less strong
for employers and employees, but they do have an interest in work resumption anyway.
For employers, sickness absence may be costly for other reasons than wage continuation,
non cooperation may lead to an extension of the waiting period, and potential DI
ben-efit costs after the waiting period are experience rated. Moreover, non-cooperation with
reintegration plans inhibits the risk of getting fired or loosing eligibility to DI benefits for
sick-listed employees.7
The data used in this paper come from a private workplace reintegration provider that
is the sole provider of case management for two large insurers, together holding a market
share of about 30% of the insurances for continued wage payments (Dutch Association of
6
There are many variations possible when it comes to these insurances. There is freedom of choice in the percentage of wages insured (77% of firms chooses to insure 100% of the wages paid in the first year and 70% of the wages paid in the second year of sick leave), firms can opt-in for a deductible (77% of firms chooses to keep two weeks to two months of sick leave on their own account), and firms can choose for a stop-loss insurance (only chosen by 5% of firms of which most are firms with more than 100 employees). Of the firms surveyed by de Jong et al. (2014) 9% answered that their insurance only covers continued wage payments, 67% answered their insurance covers wage payments and the costs for gatekeeper obligations, 4% has some other type of package, and 19% does not know what their insurance covers.
7The evidence also confirms that private workplace reintegration providers usually increase reintegration
Insurers, 2016). The workplace reintegration provider offers different types of products,
from the registration of sickness absence to case management for individuals at risk of
long term absence. In the current study, we focus on the individuals assigned to case
management. Employers who take out the ‘broad’ insurance package with either of the
two insurers are automatically directed to our workplace reintegration provider for case
management. Those who are only insured against continued wage payments can opt to
work with a case manager from within their own company, hire an external case manager,
or hire the services of the case manager of our workplace reintegration provider.
In a typical case management trajectory a sick-listed employee can be directed to our
workplace reintegration provider when a disability assessment is made by the company
doctor. When there is an indication for imminent long-term absenteeism at that time and
the contract with the provider includes case management, the employee gets assigned to
a case manager who establishes a more detailed diagnosis and writes the return to work
plan. The assignment of sick-listed employees to case managers is based on caseload, i.e.
the case manager that has time takes on the sick-listed employee. Stated differently, case
managers are not specialized in specific health problems, sectors, or regions.8
The case managers working at our workplace reintegration provider are not doctors.
Usually, case managers have a background in law, HR, or (para)medical care. They purely
serve as a manager of the reintegration process: consulting with the occupational
physi-cian, keeping in regular contact with the employer and sick-listed employee, identifying
the steps to be taken by the employer and employee, putting together the return to work
plan, and administrating the process. Based on cost-benefit analysis case managers can
decide to buy rehabilitation products from external parties, such as paramedical care, job
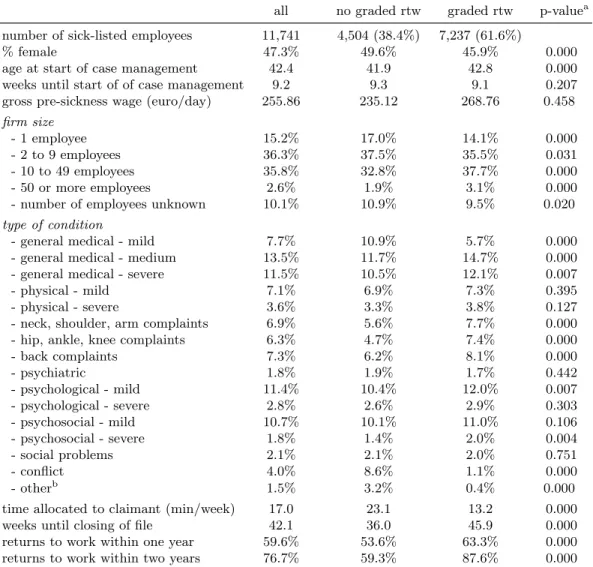
Table 1: Descriptive statistics sick-listed employees.
all no graded rtw graded rtw p-valuea
number of sick-listed employees 11,741 4,504 (38.4%) 7,237 (61.6%)
% female 47.3% 49.6% 45.9% 0.000
age at start of case management 42.4 41.9 42.8 0.000
weeks until start of of case management 9.2 9.3 9.1 0.207
gross pre-sickness wage (euro/day) 255.86 235.12 268.76 0.458
firm size
- 1 employee 15.2% 17.0% 14.1% 0.000
- 2 to 9 employees 36.3% 37.5% 35.5% 0.031
- 10 to 49 employees 35.8% 32.8% 37.7% 0.000
- 50 or more employees 2.6% 1.9% 3.1% 0.000
- number of employees unknown 10.1% 10.9% 9.5% 0.020
type of condition
- general medical - mild 7.7% 10.9% 5.7% 0.000
- general medical - medium 13.5% 11.7% 14.7% 0.000
- general medical - severe 11.5% 10.5% 12.1% 0.007
- physical - mild 7.1% 6.9% 7.3% 0.395
- physical - severe 3.6% 3.3% 3.8% 0.127
- neck, shoulder, arm complaints 6.9% 5.6% 7.7% 0.000
- hip, ankle, knee complaints 6.3% 4.7% 7.4% 0.000
- back complaints 7.3% 6.2% 8.1% 0.000
- psychiatric 1.8% 1.9% 1.7% 0.442
- psychological - mild 11.4% 10.4% 12.0% 0.007
- psychological - severe 2.8% 2.6% 2.9% 0.303
- psychosocial - mild 10.7% 10.1% 11.0% 0.106
- psychosocial - severe 1.8% 1.4% 2.0% 0.004
- social problems 2.1% 2.1% 2.0% 0.751
- conflict 4.0% 8.6% 1.1% 0.000
- otherb 1.5% 3.2% 0.4% 0.000
time allocated to claimant (min/week) 17.0 23.1 13.2 0.000
weeks until closing of file 42.1 36.0 45.9 0.000
returns to work within one year 59.6% 53.6% 63.3% 0.000
returns to work within two years 76.7% 59.3% 87.6% 0.000
a
Two-sided t-test on difference between sample with graded work and no graded work, with unequal variances.
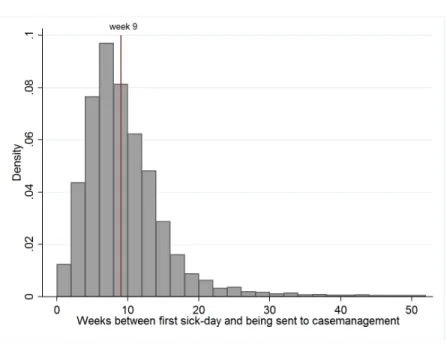
Figure 2: Histogram of application moments.
3
Data
3.1 Characteristics of sick-listed employees
We have access to all files on sick-listed employees that were assigned to case management
at our private workplace reintegration provider between the years 2011 and 2014. We
ex-clude those individuals that hold specific insurance contracts, which inex-clude extra services
before case management and/or earlier entry into case management (when there is not yet
a risk of long term sickness). These contracts are predominantly held by self-employed.9 The client files include characteristics like gender, gross (pre-sickness) wage earnings, and
age. Moreover, they include the exact dates of the first sick day, of the entry day at the
workplace reintegration provider, and of (partial) recovery. These files are merged to a
file containing the interventions applied to each sick-listed employee and a file containing
information on the assigned case manager. The data covers 11,741 sick-listed employees
that are assigned to 68 case managers.
Table 1 shows the characteristics of the sick-listed employees in our sample. Almost
8The workplace reintegration provider has only one office, located in the centre of the country. Contact
with the sick-listed employee is mostly maintained via phone and email.
9
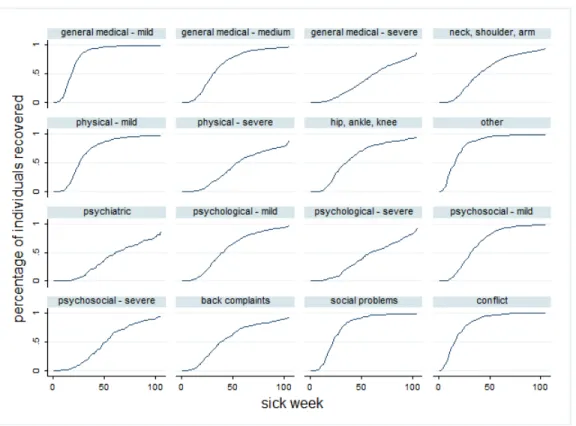
Figure 3: Recovry patterns by type of diagnosis
half of the individuals is female and they are on average 42 years old. The time between
sick-listing and the sick leave file arriving at the provider is on average nine weeks, whereas
individuals are legally obliged to start their return to work activities by the eight week.
Figure 2 shows that roughly half of the individuals do enter case management before the
eighth week of sickness absence. However, it also shows that there is quite some spread
in the moment at which the individuals start case management. As the elapsed duration
until intake is likely to affect both the likelihood of graded work and work resumption, we
should take this into account in our empirical analysis. We have no information on possible
reintegration efforts by the employer and employee between the moment of sick-listing and
the moment of entry at the workplace reintegration provider.
Individuals earn on average e255.86 a day and mostly work in small to average sized
firms. 32.7% of the individuals has a general medical condition, 10.7% has physical
prob-lems, 20.5% has musculoskeletal probprob-lems, 30.6% has psychiatric, psychological, or social
problems, 4.0% has a conflict at work, and 1.5% has some kind of other condition, such
must think of individuals who are recovering from surgery or suffer from chronic illness.
The average individual has 17 minutes per week allocated to him by the case manager.
Individuals exit the trajectory on average after 42.1 weeks, with 59.6% of individuals
re-turning to work within a year, and 76.7% of individuals rere-turning to work within two years.
Figure 3 shows the percentage of individuals that recovered in each sick week, stratified
with respect to type of diagnosis. It should be stressed here that we only consider the
individuals that were directed to the workplace reintegration provider after some period of
sickness. As a result of this type of selection, recovery and work resumption rates remain
close to zero in these first weeks. In line with expectations, we observe that individuals
with less severe problems on average recover faster than those with more severe problems.
The different type of musculo-skeletal problems (neck/shoulder/arm, hip/ankle/knee, and
back) show similar recovery patterns.
Table 1 also shows the characteristics of the sick-listed employees for those who did
and those who did not participate in a graded return-to-work arrangement. We define an
individual to be in graded return-to-work when his wage value, e.g. the degree of
pre-sickness productive work time resumption, exceeds 0%. Roughly 60% of the individuals
in our data set participate in graded return-to-work at some point during their sick spell.
The two groups are comparable in terms of age, gender, and moment of application;
the differences in means are statistically significant in some cases, but not substantial.
The graded individuals do not earn significantly more than the non-graded individuals.
The compositions of the groups are slightly different when it comes to the diagnoses.
For example, people who have a conflict at work rarely enter a graded return-to-work
trajectory. Presumably, cooperation of the employer and possibly work place adaption is
more troublesome in situations where there is a conflict.
Those in graded return-to-work have on average less time devoted to them by their
case manager than those who are not in graded return-to-work. Despite the longer average
sickness duration, those participating in graded return-to-work have a higher probability
of returning to work in the longer run. This is also reflected in Figure 4 showing survival
probabilities and hazard rates for individuals who started a graded return-to-work in the
Figure 4: Survival and hazard rates for individuals with and without graded return-to-work in first year of absence
in the first year, respectively. Individuals participating in graded return-to-work have a
lower probability to recover in the first weeks of illness, but start to perform better than
those not participating in graded return-to-work from about the 25th week onward leading
to substantially lower probabilities of non-recovery in the 70th week. From that point on
the lines run roughly parallel to each other. The hazard rate spikes after the first year of
sick-leave and at the end of the second year. These spikes correspond to the two annual
evaluation moments in the Gatekeeper Protocol.
3.2 Characteristics of case managers
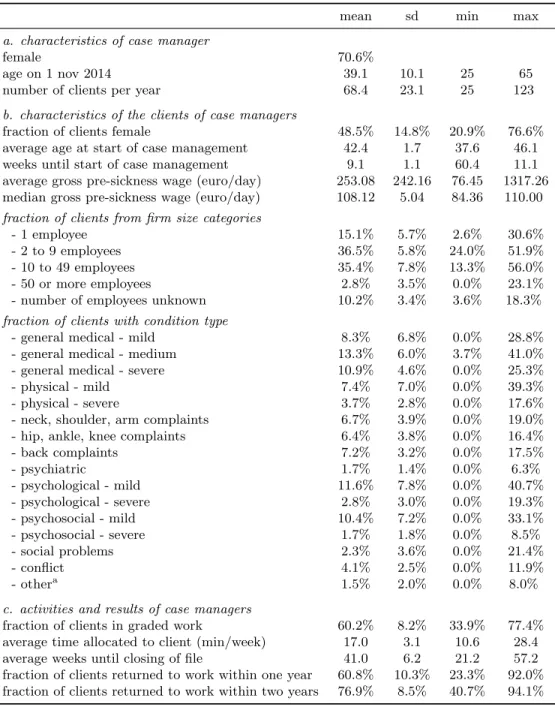
Table 2 shows case manager characteristics of our sample. We have information on 68
case managers, who are predominantly female (70.6%). They have on average about 68
sick-listed employees assigned to them per year. There is quite some spread however, with
case managers treating up to 123 individuals a year at maximum. We dropped those case
manager-years in which a case manager treated less than 25 individuals in a particular
year.10
In principle individuals are assigned to case managers based on caseload. That is, new
clients are directed to those who have time. However, there seems to be some clustering at
10
Table 2: Descriptive statistics of the 68 case managers
mean sd min max
a. characteristics of case manager
female 70.6%
age on 1 nov 2014 39.1 10.1 25 65
number of clients per year 68.4 23.1 25 123
b. characteristics of the clients of case managers
fraction of clients female 48.5% 14.8% 20.9% 76.6%
average age at start of case management 42.4 1.7 37.6 46.1
weeks until start of case management 9.1 1.1 60.4 11.1
average gross pre-sickness wage (euro/day) 253.08 242.16 76.45 1317.26
median gross pre-sickness wage (euro/day) 108.12 5.04 84.36 110.00
fraction of clients from firm size categories
- 1 employee 15.1% 5.7% 2.6% 30.6%
- 2 to 9 employees 36.5% 5.8% 24.0% 51.9%
- 10 to 49 employees 35.4% 7.8% 13.3% 56.0%
- 50 or more employees 2.8% 3.5% 0.0% 23.1%
- number of employees unknown 10.2% 3.4% 3.6% 18.3%
fraction of clients with condition type
- general medical - mild 8.3% 6.8% 0.0% 28.8%
- general medical - medium 13.3% 6.0% 3.7% 41.0%
- general medical - severe 10.9% 4.6% 0.0% 25.3%
- physical - mild 7.4% 7.0% 0.0% 39.3%
- physical - severe 3.7% 2.8% 0.0% 17.6%
- neck, shoulder, arm complaints 6.7% 3.9% 0.0% 19.0%
- hip, ankle, knee complaints 6.4% 3.8% 0.0% 16.4%
- back complaints 7.2% 3.2% 0.0% 17.5%
- psychiatric 1.7% 1.4% 0.0% 6.3%
- psychological - mild 11.6% 7.8% 0.0% 40.7%
- psychological - severe 2.8% 3.0% 0.0% 19.3%
- psychosocial - mild 10.4% 7.2% 0.0% 33.1%
- psychosocial - severe 1.7% 1.8% 0.0% 8.5%
- social problems 2.3% 3.6% 0.0% 21.4%
- conflict 4.1% 2.5% 0.0% 11.9%
- othera 1.5% 2.0% 0.0% 8.0%
c. activities and results of case managers
fraction of clients in graded work 60.2% 8.2% 33.9% 77.4%
average time allocated to client (min/week) 17.0 3.1 10.6 28.4
average weeks until closing of file 41.0 6.2 21.2 57.2
fraction of clients returned to work within one year 60.8% 10.3% 23.3% 92.0%
fraction of clients returned to work within two years 76.9% 8.5% 40.7% 94.1%
a
certain case managers based on gender and type of diseases. More specifically, the spread
of the case manager averages is relatively high for these variables. This could hint at some
form of specialization, in the sense that case managers select those individuals that they
know best how to deal with. However, when it comes to the diagnoses of the clients, the
variation is more likely to be a result of the reporting behaviour of the case managers than
reflecting selection. This is because the diagnoses are established by the case managers
after the clients are assigned to them. The results from the sensitivity checks reported in
Section 5.4 will show that our results are unlikely to be driven by potential specialization
of case managers.
Case managers differ substantially in their use of graded return-to-work, with some case
managers only having 33.6% of their clients in graded return-to-work and others having
up to 82.6% of their clients participating in graded return-to-work. Also the average time
allocated to the individuals vary greatly among case managers.
3.3 Setup of graded return-to-work trajectories
Within the group of clients that started a graded work trajectory, relevant outcomes
measures are the moment and the degree at which grading is started. The variable ‘wage
value’, which we use to construct our graded return-to-work index, may contain any integer
value ranging from 0 to 100 and can be updated up to 24 times at maximum in a
two-year-trajectory. Case managers are encouraged to fill in the variable succinctly, as any
degree of work resumption implies lower costs for the workplace reintegration provider.
The extent to which we can use this detailed information depends on the variation in the
graded return-to-work trajectories. In this section we explore the different trajectories in
detail.
Figure 5 shows the percentage of individuals participating in graded return-to-work in
a certain week, where we define five categories of graded work: 1-20%, 21-40%, 41-60%,
61-80%, and 81-100% of the pre-sickness wage value, respectively.11 The figure shows that in the first weeks of sickness individuals usually work modest amounts of time (21-60%
11
Figure 5: Percentage of individuals having participated in graded return-to-work per week.
graded work). Towards the 20th week, individuals participate more often in high degrees
of graded work resumption (81-100%) or very low degrees (<20%). In the later weeks
(when most have recovered), those who are still in graded return-to-work mostly work
modest amounts of time, i.e. <20% graded work resumption.
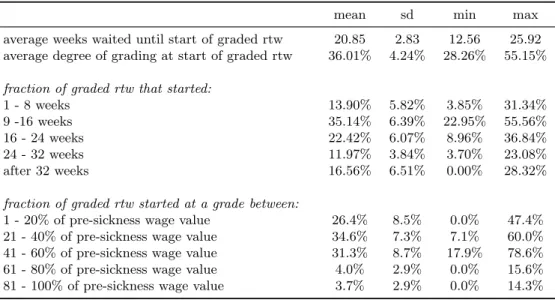
Table 3 shows the variation in grading practice of the different case managers. On
average case managers wait 20.85 weeks before starting the graded return-to-work and do
so at a degree of 36.01%. The fastest case manager waits on average 12.56 weeks and
the slowest 25.92. The case manager that starts grading at the lowest degree does so
at 28.26% on average and the one that starts the highest does so at 55.15% on average.
There are some case managers that never start a graded return-to-work arrangement after
32 weeks, while others start almost a third of the trajectories that late. Also, some case
managers never start a graded return-to-work arrangement at 1-20% of pre-sickness wage
value, whereas others start almost half the arrangements at this level. We thus conclude
Table 3: Variation in grading practices across case managers.
mean sd min max
average weeks waited until start of graded rtw 20.85 2.83 12.56 25.92
average degree of grading at start of graded rtw 36.01% 4.24% 28.26% 55.15%
fraction of graded rtw that started:
1 - 8 weeks 13.90% 5.82% 3.85% 31.34%
9 -16 weeks 35.14% 6.39% 22.95% 55.56%
16 - 24 weeks 22.42% 6.07% 8.96% 36.84%
24 - 32 weeks 11.97% 3.84% 3.70% 23.08%
after 32 weeks 16.56% 6.51% 0.00% 28.32%
fraction of graded rtw started at a grade between:
1 - 20% of pre-sickness wage value 26.4% 8.5% 0.0% 47.4%
21 - 40% of pre-sickness wage value 34.6% 7.3% 7.1% 60.0%
41 - 60% of pre-sickness wage value 31.3% 8.7% 17.9% 78.6%
61 - 80% of pre-sickness wage value 4.0% 2.9% 0.0% 15.6%
81 - 100% of pre-sickness wage value 3.7% 2.9% 0.0% 14.3%
4
Estimation strategy
To identify the effectiveness of graded return-to-work at reducing the length of sick spells,
we use an instrumental variable (IV) method which was introduced by Duggan (2005).
Duggan analyzes how expenses on new drugs affect total medical expenditures by
ex-ploiting the variation in psychiatrists’ preferences in drugs prescription as an instrument
for individual expenses on certain types of new drugs. In a similar fashion, more recent
applications exploit variation in strictness of disability examiners and judges in awarding
disability benefits (Maestas et al., 2013; French and Song, 2014) and the propensities of
employment offices or individual caseworkers to use certain interventions (Dean et al.,
2015; Markussen and Røed, 2014; Rehwald et al., 2016; Markussen et al., 2017). Our
approach is most similar to Markussen et al. (2012), who exploit variation in physicians’
use of graded absence certificates to identify the effect of part-time sick leave on absence
duration.
In our case, employees are send to the reintegration provider after some weeks of
absence. The provider assigns them to case managers that have substantial discretionary
room in choosing specific treatments. Case managers are encouraged to use graded
return-to-work whenever possible. However, the actual grading practice may vary among the case
of when an individual is ready to start graded return-to-work and the individuals’ ability
to work. Second, one cannot simply assign an individual to graded return-to-work in all
relevant work environments. The case manager has to negotiate the possibilities of adapted
work duties with the employer, who is not always willing to allow for such flexibility
(Wainwright et al., 2011).12 One case manager may be better in this negotiation process than the other, speeding up the process towards graded return-to-work. Hence, whether
an individual participates in graded return-to-work and when he starts to do so, may
depend on the case manager he is assigned to. This means the case manager’spropensity
to grade can be used to instrument the graded return-to-work variable.
Within the context of the current analysis, the validity of instrumental variables
es-timation essentially requires four conditions to be met. First, the probability of graded
work should be affected by the concerning case managers’ propensity to use a graded work
for all other individuals that are assigned to him (‘relevance’). In light of the time span
of four years that is covered, assuming the tendency to use graded work to be constant
over time may be too restrictive. Case managers may change their behavior over time,
as they may learn from earlier experiences. We therefore construct propensities by case
manager for each year in our sample. This also potentially increases the efficiency of our
estimates.13
Our second condition for IV to work is that sick listed individuals are assigned randomly
to case managers. Stated differently, this implies that sick-listed individuals with long and
short expected sick durations do not cluster among certain case managers. With the
information on sick-listed workers in our data, we can test for randomness by excluding
client characteristics in our model. If this yields different coefficient values for graded
work, this suggests there is clustering on worker types. In a similar vein, we can re-run
the analyses while excluding case managers who have abnormal client group compositions.
The results of both of these analyses are reported in Section 5.4.1. Obviously, testing for
clustering on unobservable characteristics is more complex, but it should be stressed that
12
When performing a decomposition analysis of the observed variation in graded-work applications across case managers and employers, we see indeed that the individual’s employer is more important than the individual’s case manager. As long as individual’s are randomly assigned to case managers, however, this does not burden our analysis. At most, it decreases the efficiency of our method.
case managers did not receive more information than the registered data we have. This
renders it plausible there was no selection on unobservables.
Third, we rely upon the assumption that graded work effects are not correlated with
the general ability of case managers in getting individuals back to work (i.e., the ‘exclusion
restriction’). For instance, if high quality case managers have a strong tendency to use
graded work, the IV model will overestimate the effect of graded work. We therefore will
conduct various sensitivity tests that use proxies for the overall quality of case managers.
In particular, such proxies include both current and lagged work resumption rates for
clients that were assigned to case managers or work resumption rates for individuals that
were on graded work already at the moment of intake. The results of these analyses are
reported in Section 5.4.2
Finally, individuals who would not be treated by a high propensity case manager,
should also not be treated by a low propensity case manager. This monotonicity
assump-tion implies that the graded work propensities should impact all individuals equally in our
sample. For instance, this assumption may be violated if one case manager is more inclined
to use graded work for individuals with mental issues, but less inclined to use graded work
for individuals with musculo-skeletal problems. With this in mind, we will conduct tests
on the equality of graded work propensity impacts on the actual use of graded work – i.e,
the first stage estimates. The results of these checks are reported in Section 5.4.3.
4.1 Specification of the effect of graded work
When specifying the IV model that estimates the effect of graded-work on the incidence
of work resumption and the number of sickness weeks, we closely follow Markussen and
Røed (2014) and Rehwald et al. (2016). In these analyses, the aim is to estimate the effect
of the provision of graded work (G). As we will show later on, we extend their analysis
in two ways. First, we will develop propensities for the weeks waited until the start of
graded work (W). For the individuals with graded work, this enables us to estimate the
impact of the timing of graded work on full work resumption. Second, we will focus
on the impact of the level of graded work at the start of a graded work trajectory (S).
manager propensities. As argued above, we can extend this by allowing for case manager
propensities for each year in our sample.
To start with, we structure the cross sectional data on the sick-listed individuals to a
panel where every period t corresponds to one week. We include all individual-weeks in
the first year of the sick-spell up to and including the week in which graded work started
or, in case of the absence of a graded work treatment, until the sick spell ended (i.e.,
individual went back to work or entered the DI scheme). Then, we run an OLS regression
on a dummy indicating whether the individual is or is not starting to participate in graded
work that week. In this regression we control for time constant individual characteristics
xi for individual i(e.g. age, age squared, sex, sick type, log gross (pre-sickness) wage, log
gross (pre-sickness) wage squared, firm size, year of application, type of insurance contract,
sick duration until application at the re-integration office), together with period dummies
(dateit), and dummies for all possible outcomes of elapsed sick weeks (dit):
gradedijt=x0i θg+δ g
1 dit+δ2g dateit+ugijt, (1)
i= 1, . . . n (individuals),
j= 1, . . . J (case managers),
t= 1, . . . T (periods),
where uijt is i.i.d. and clustered at the level of case manager-year combinations. The
parametersθg,δ1g andδg2 describe the effects of individual characteristics, the elapsed sick weeks and period dummies, respectively.
Using the estimated individual errors ˆugijt, we next construct the case manager
propen-sities to treatψig. We sum the errors over the periods for every individuali, i.e.
ˆ ugij =
Ti X
t=1
ˆ
ugijt, (2)
where Ti is the last period individual i is at risk of making a transition into treatment.
Following Markussen and Røed (2014) and Rehwald et al. (2016), ˆugij can be interpreted
duration until treatment for individuals with the same pre-treatment characteristics as
individual i. We next take the average of all ˆugij per case manager, while leaving out ˆugij
for the sick-listed employee concerned, i.e.
ψig = 1 nj−1
X
k∈Nj−i
ˆ
ugkj, (3)
whereNj is the set of individuals corresponding to case manager j. For ease of
interpre-tation, we rescale these ψig from 0 to 1, with 0 indicating the lowest propensity to use
graded work and 1 indicating the highest propensity to use graded work.
In order to estimate the effect of graded return-to-work on the probability to return
to work (yi), we collapse the data to one observation per individual. This observation
may either be the probability of work resumption or the number of weeks that have been
worked over a certain time window. We estimate the effect of having participated in
graded return-to-work on the return-to-work probability, using the propensity to grade
(ψgi) as an instrumental variable. We control for the same individual characteristics as in
the propensity regressions. This yields the following IV model:
yi=x0i βg+γg Gbi+gi, (4)
Gi=x0i πg+αg ψ g i +η
g
i. (5)
4.2 Specification of the effect of timing and initial degree of graded work
Following the IV estimation procedures as in equations (1) to (5), the variation in
graded-work propensities of case managers that we exploit essentially stems from two sources.
First, case managers show differences in the likelihood of starting graded work
interven-tions. Second, there is variation in the timing of treatments across case managers for those
individuals that start graded work. To estimate the isolated impact of the duration until
graded return-to-work on absence duration, we select only those individuals that enter
graded return-to-work at some point during their sickness absence, next recalculate the
propensities as explained in equations (1), (2), and (3) and denote these asψwi . Next, for
start of graded return-to-work for individuali and estimate the effect of this variable on
the absence durations usingψiw as an instrument:
yi =x0i βw+γw Wci+wi , (6)
Wi =x0i πw+αw ψiw+ηiw. (7)
As with any IV model, it is important to stress at this point that our parameter of
interest in the above equation, γw, should be interpreted as a local average treatment
effect (LATE). This parameter denotes the effect of waiting one week extra before starting
the trajectory on absence duration for those individuals. This result does not necessarily
extrapolate to all individuals or to the whole support of the weeks waited variable,Wi.
Our data also allow us to focus on the tendency of case managers to start graded work
at a high or low degree. For this purpose, we calculate a propensity based only on the
percentage of pre-sickness hours worked during the first week of graded return-to-work,
i.e. the starting level denoted bySij, for the selected sample of individuals with graded
work. We estimate a regression corresponding to equation (1),
Sij =x0i θs+δ1s di+δ2s datei+usij, (8)
i= 1, . . . n (individuals),
j= 1, . . . J (case managers), (9)
whereusij is i.i.d. and clustered with respect to case manager-year combinations. Based
on the outcomes of this regression, we calculate similar propensities as in equation (3) for
individualiwith case managerj. We denote these asψis. We instrument the initial degree
of grading with the average initial degree of grading for all other sick listed workers that
were assigned to this case manager. This enables us to conduct an IV regression as above
using the degree of graded work resumption rate at the start of graded return-to-work as
yi =x0i βs+γs Sbi+si, (10)
Si =x0i πs+αs ψis+ηsi. (11)
5
Results
5.1 Overall effects of graded return-to-work
Table 4 shows the effects of graded return-to-work trajectories on (1) a dummy variable
indicating whether the sick-listed employee returned to work within 1 year; (2) a dummy
variable indicating whether the sick-listed employee returned to work within 2 years; (3)
the number of weeks worked in the first year; (4) the number of weeks worked in the first
two years. Panel (a) shows the OLS results, panel (b) shows the IV results and panel (c)
shows the reduced form or ‘Intention-to-treat’ estimates for the case manager propensity
measure. The results for the regressions underlying the propensities and the estimated
coefficients for the control variables of the regressions are shown in Tables 13 and 14 of
Appendix B.
Columns 1 to 4 of Table 4 present the baseline results, where we consider an
indi-vidual as treated if he enters a graded return-to-work trajectory within the first year of
sick leave.14 Based on the OLS results, one would conclude that graded return-to-work trajectories have substantial and positive rehabilitation effects. The IV estimates however
show only moderate and statistically insignificant effects, suggesting positive selection into
the treatment. This is best illustrated by the outcomes at the end of the second year. The
OLS estimates indicate a 30 percentage point increase in return to work probabilities for
individuals on a graded return-to-work trajectory, whereas the IV estimates show only
a 7.5 percentage point (insignificant) increase. Similarly, the reduced form estimates
in-dicate that individuals assigned to a case manager with the highest propensity to use
145.3% of untreated individuals do start a graded return-to-work trajectory in the second year of sick
Figure 6: Cumulative effects of graded work per sick weeks
graded return-to-work are only 2 percentage point (insignificant) more likely to
rehabili-tate within two years than those assigned to the case manager with the lowest propensity
to use graded work.
Columns 5 to 8 of Table 4 show the results when only considering graded return-to-work
trajectories which started in the first 26 weeks of sick leave as a treatment (individuals who
started a graded return-to-work trajectory after the 26 weeks are considered untreated).
Compared to the earlier results with 52 weeks as a maximum, there are noticeable
dif-ferences in the effects. The probability to return to work increases with 30.8 percentage
point compared to 12.7 percentage point and the number of weeks worked increases with
8.9 weeks compared to 1.2. One explanation for this difference in outcomes is that graded
return-to-work trajectories are more effective when started earlier, which is the hypothesis
we will further explore in Section 5.2. Another explanation is that there is a lock-in for
graded return-to-work trajectories that occurs in the first weeks of grading. If so, we would
expect differences in effectiveness of graded work to fade out over time. This is confirmed
when comparing the long-term effects that are shown in column 2 and 6 of Table 4.
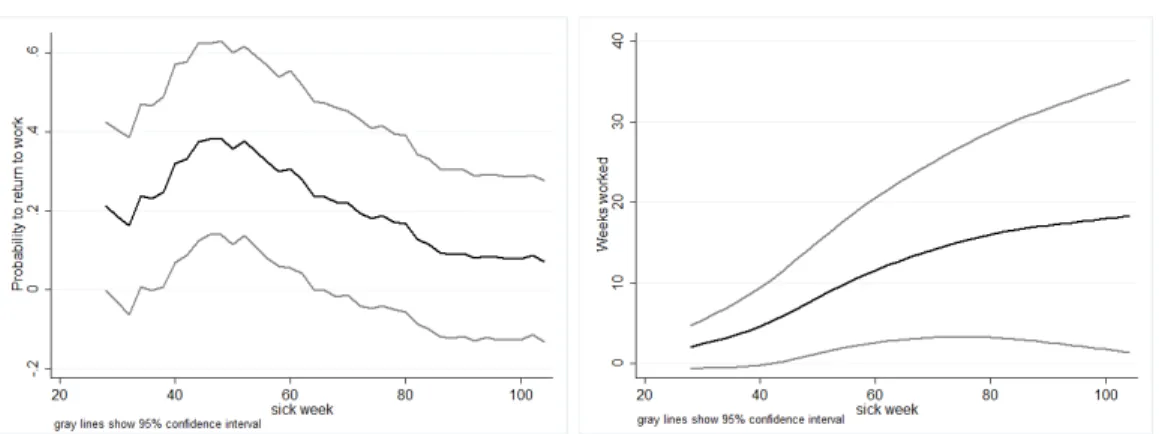
To illustrate the evolution of the effects in more detail, Figure 6 shows the effects of
graded return-to-work trajectories that started in the first half year on the return to work
probability as well as the number of weeks worked. The effect on the return-to-work
prob-abilities is increasing up to week 46, after which the effect declines. It appears that graded
return-to-work speeds up the recovery process, with the return-to-work probabilities being
week 40 and 60 does not persist, such that the line flattens out towards the end of the
second year.
The effect of graded return-to-work spells started in the first half year on weeks worked
in the first year is comparable to the effect found in Markussen et al. (2012) with data
from sick-listed workers in Norway. They find that part-time sick leave decreases the
absence spells with eight to ten weeks. Rehwald et al. (2016) find substantially bigger
results, amounting to a 30 week increase in weeks in regular employment in the first
year.15 Contrary to our results, both Markussen et al. (2012) and Rehwald et al. (2016) find positive long run effects. The first shows that employment two years after sick listing
increases with 16 to 21 percentage point, the latter finds a increase of 27 weeks worked
during the second year and an increase of 26 weeks in the third year. When comparing
these outcomes with ours, one should bear in mind that employers in the Netherlands are
committed to facilitate the return-to-work for the sick-listed workers for at least two years.
Accordingly, we may expect that individuals in the control group – i.e., those without
graded return-to-work – are likely to receive other services. This in turn may explain
why the long-term impacts we find are smaller and insignificant. Still, our evidence also
suggests that graded return-to-work may speed up the recovery process, particularly when
starting early.
5.2 Effects of the timing and initial level of graded work
We argued earlier that both the timing and the initial level of graded work may determine
the effectiveness of graded work trajectories. To investigate the importance of these two
parameters, we select the sample of individuals who entered a graded return-to-work
trajectory in the first year of their sick leave. Using a similar setup as for our benchmark
model, we first estimate the effect of starting a graded return-to-work trajectory one week
later on the outcome measure. The results are reported in Panel (a) of Table 5. The first
stage results show that being assigned to the case manager with the highest propensity of
graded work leads to a four week reduction in waiting time until graded return-to-work,
15Markussen et al. (2012) only consider grading decisions made within the first eight weeks of sick leave.
Table 5: Effect of starting graded return-to-work one week later or at a higher starting level: IV estimates.
Returned to work Weeks worked in
1 year 2 years week 1-52 week 1-104
(a) Duration until start of graded return to work trajectory
Sick weeks until grading start -0.044*** -0.001 -1.497*** -2.177***
(0.010) (0.005) (0.257) (0.489)
n 5,906 5,906 5,906 5,906
R2 -0.028 0.033 0.105 0.111
stage 1: ψ[weeks waited] -3.935*** (0.791)
(b) Level of work resumption at start (linear specification)
Starting level (0-100) 0.006*** 0.003** 0.135*** 0.318***
(0.002) (0.001) (0.052) (0.111)
n 5,913 5,913 5,913 5,913
R2 0.142 0.018 0.314 0.199
stage 1: Ψ[degree grading] 25.37*** (0.564)
Control variables include gender, age, wage, sick weeks until application, year dummies, medical conditions, contract types and firm size.
Propensities are calculated on the sample of graded individuals. Claimants are excluded when their assigned case manager graded fewer than 25 claimants in the same year as the claimant.
as compared to the case manager with the lowest propensity. The second stage results
indicate that waiting one week extra before starting graded return-to-work, decreases
the probability to rehabilitate within one year with 4.4 percentage point, whereas the
probability to return to work within two years is not affected. This again suggests that
graded return-to-work speeds up the recovery process, rather than increasing the
long-term probability of recovery. Starting graded return-to-work one week later results in a
trajectory that lasts half a week longer, so that the number of weeks worked in the first
year decreases by 1.5. When taking a time horizon of two years, the number of weeks
worked even decreases by 2.2.
In panel (b) of Table 5 we consider the effect of the level of work resumption at the
start of the graded return-to-work trajectory on work resumption. In this setup, the
instrument orders case managers in terms of their preference to start a return-to-work
trajectory at high levels of graded work resumption. As the table shows, being assigned to
a case manager that tends to start trajectories at high rates rather than to one that tends
to start at low rates, increases the starting level of work resumption by 25 percentage
point. From the second stage estimates we infer that starting at a 10 percentage point
higher level of grading results in a 6 percentage point higher chance of recovering in the
first year.16 The return to work probability for the first two years is increased by 2.5 percentage point. The number of weeks worked in the first year increases by 1.4, whereas
individuals work 3.2 additional weeks in the first two years. This suggests that a higher
initial level of grading also improves long-term recovery rates. It may thus be that giving
sick-listed individuals an easy start by re-introducing them to work for a very limited
amount of hours, may actually harm them. It may be that the potential positive effects of
graded work cannot be established if the individual cannot properly participate in work
processes and is not viewed as a full-fledged employee.
16
5.3 Effects for different types of medical conditions
Table 6 shows IV estimates for samples of specific medical conditions that are registered
by the reintegration provider. Panel (a) shows the baseline estimates for all graded
return-to-work trajectories and panel (b) those for all graded return-return-to-work trajectories started
in the first 26 weeks. The first stage estimation results are similar in size across medical
conditions, suggesting that the extent to which case managers can affect the use of graded
work is equal across groups in the first 26 weeks of absence. The second stage estimates
however vary across medical conditions. While graded return-to-work increases first year
return-to-work probabilities substantially for general medical as well as musculo-skeletal
problems, it seems to have little effect on workers with mental problems. This corresponds
with the findings of Høgelund et al. (2010) and Andren (2014) who both find no effects
of graded return-to-work for individuals with mental disorders, but positive effects for
individuals with other disorders. Also Hernæs (2017) finds larger effects for individuals
with musculo-skeletal problems, than for individuals with psychological problems. After
two years of sickness, the effect for individuals with musculo-skeletal problems tends to
zero, whereas the effect for individuals with general medical problems remains high. This
suggests that graded work can be meaningful for individuals with chronic illnesses or
individuals that recover from medical treatments.
Panel (c) and (d) of Table 6 show the effects of the timing and initial level of graded
work on work resumption for different medical conditions, respectively. Starting the
tra-jectory one week later decreases the probability to return to work for individuals with
general medical problems within one year with 4 percentage point, but the effect becomes
small and insignificant after two years of absence. For musculo-skeletal conditions we do
not find any significant effects on the probability to return to work. There also is no
evidence of effects of starting later in the short run for individuals with mental conditions.
In the long run, it even seems harmful to start graded work early for this group. In
par-ticular, the effect of starting the graded return-to-work trajectory one week later amounts
to an increase in the probability to return to work within two years that is equal to about
Table 6: IV estimation results on work resumption for different medical conditions.
General medical Musculo-skeletal Mental Returned to work Returned to work Returned to work
1 year 2 years 1 year 2 years 1 year 2 years
(a) Overall effect: trajectories started week 1-52
Graded rtw 0.572* 0.563** 0.477 -0.203 -0.0234 -0.108
(0.327) (0.244) (0.540) (0.413) (0.352) (0.373)
stage 1: Ψ[graded rtw] 0.191*** 0.155 0.170**
(0.072) (0.095) (0.074)
(b) Overall effect: trajectories started week 1-26
Graded rtw 0.789*** 0.468** 0.539* -0.061 0.051 -0.259
(0.238) (0.205) (0.323) (0.261) (0.261) (0.296)
stage 1: Ψ[graded rtw] 0.281*** 0.229*** 0.266***
(0.066) (0.076) (0.079)
(c) Duration untill start trajectory
Sick weeks until grading start -0.040** -0.0003 -0.016 0.016 -0.010 0.030*
(0.017) (0.008) (0.011) (0.010) (0.018) (0.017)
stage 1: Ψ[weeks waited] -5.025*** -5.179*** -3.559**
(1.704) (1.738) (1.402)
(d) Initial degree of grading
Starting level (0-100) 0.005* 0.002 0.010*** 0.003 0.007*** 0.001
(0.002) (0.001) (0.003) (0.002) (0.002) (0.001)
stage 1: Ψ[degree graded] 30.59*** 23.31*** 26.71***
(0.859) (1.141) (0.841)
The group ‘general medical’ consists of individuals with the conditions general medical -mild/medium/severe. The group musculo-skeletal consists of individual with the conditions neck, shoulder, arm, hip, ankle, knee or back complaints. The group mental consists of individuals with the conditions psychiatric, psychological - mild/severe, psychosocial - mild/severe or social problems. Individuals with physical mild/severe conditions are not considered because of the small sample size. Also individuals labels as ‘other’ or having a conflict are excluded.
Control variables include gender, age, wage, sick weeks until application, year dummies, medical conditions, contract types and firm size.
Claimants are excluded when their assigned case manager treated fewer than 10 claimants of the same type in the same year as the claimant.
Panel (a) and (b) is based on 3,971 observations with general medical conditions, 1,947 with musculo-skeletal conditions, and 3,380 with conditions related to mental health.
Panel (c) and (d) is based on 1,667 observations with general medical conditions, 982 with musculo-skeletal conditions, and 1,807 with conditions related to mental health.
results in higher probabilities to return to work after one year and no significant effect
after two years for all three types of medical conditions. The results for weeks worked
correspond to the results for the return-to-work probability and can be found in Table 17
of Appendix B.
5.4 Sensitivity tests
5.4.1 Endogeneity and specialization
We stated earlier that new clients were assigned to case managers based only on their
caseload. As a result, there would be no specialization of case managers that could result
in a positive correlation between the propensity to grade and the likelihood to return to
work for reasons other than graded return-to-work itself. Based on observed characteristics
of clients that are assigned to the same case managers, we can test for this assumption
and biases that may stem from specialization. At the same time, we should bear in mind
that for analyses based on samples of graded individuals only, there may be non-random
selection – even if there is no specialization to start with. This may occur if for instance
case managers that only grade few individuals do this because they only grade the most
easy cases, which are also easy to grade early and at a high starting degree. In that case,
there will be a positive correlation between the weeks waited propensity (or the degree
grading propensity) and the likelihood to return to work, for other reasons than starting
the trajectory early (or starting at a high degree).
To ensure that potential non-random distribution of clients over case managers does
not affect our results, we run a set of sensitivity analyses which are reported in Table 7. As
the most prominent effects on graded work were found in the first year of absence, we focus
on the return-to-work dummy within one year as the variable that is to be explained. First,
we re-run the regressions while excluding specific sets of covariates. If these covariates are
correlated with both the probability to recover as well as the propensity to grade, the
baseline analysis is subject to omitted variable bias. We exclude sick types in column (2),
sick weeks until application in column (3), and all covariates expect the time dummies
estimates for trajectories that started in weeks 1 to 52, we find the most substantial
difference from the baseline occurs when excluding all variables, with a decrease in the
point estimate from 0.127 (0.122) to -0.0270 (0.132); see panel (a). Coefficient estimates
are hardly affected when we concentrate on trajectories starting in the first 26 weeks of
absence; see panel (b). It is only when we exclude the sick type dummies that the point
estimate increases from 0.380 to 0.477. To put these findings in perspective, it is important
to bear in mind that sick type is not known at the start of the case management trajectory,
but determined by the case manager after the client is assigned to him. Differences in
reporting a condition for example as general medical or physical, may be influenced by
case manager beliefs. These beliefs may in turn be correlated with the propensity to
grade. A similar explanation may also hold for the change in the effect estimate of the
initial degree of grading that occurs when we exclude sick type dummies – see panel (d).
In all cases, the sizes of the difference in point estimates do not lead to concerns about
the validity of our approach.
As a second sensitivity check, we exclude case managers with abnormal client group
compositions. We define a group composition by the group averages of the
characteris-tics of the clients per case manager-year combination. If a group average of one of the
characteristics is more than three (column 4) or two (column 5) standard deviations away
from the mean of the group averages the group composition is defined as abnormal. In
effect, it means that if a case managers has an extremely high or low number of clients
of the same sick type or gender or extremely high or low average ages, sick duration until
application at the office, or wage levels among his clients, the clients belonging to this
case manager in the respective year are removed from the sample. Excluding these
obser-vations results in slightly smaller point estimates than the baseline, but not statistically
significantly different.
Finally, we have conducted similar sensitivity tests that apply to the sample with
individuals with graded work only – i.e., the analyses on timing and initial degree of
graded work. In particular, we add the propensity used in panel (a) to the regressions in
with the overall propensity to grade.17 With results that are virtually identical, the picture that emerges is that sample selection effects are negligible.
5.4.2 Case manager quality
Graded return-to-work is only one of the pieces in the case manager’s toolbox. He may also
make use of other interventions such as paramedical care, job training, or coaching. Or he
may assert control by contacting the employee at the right moments and giving valuable
advice. A case manager thus can be effective in many different ways. For the validity of
our approach, we assume that the case managers’ propensity to grade is not correlated
with overall case manager quality – i.e., the exclusion restriction. This assumption may
not hold when, for example, high quality case managers are also better at motivating the
employer and employee in setting up graded return-to-work arrangements, so that there
exists a positive correlation between the propensity to grade and the likelihood to return
to work for reasons other than graded return-to-work itself. Or, on the contrary, it could
be that lower quality case managers tend to overestimate the ability of individuals to
participate in graded return-to-work and enter individuals in graded return-to-work too
early, leading to a negative correlation between propensities to grade and the likelihood
to return to work.
A straightforward measure of case manager quality is his success: does he or she
manage to get individuals back to work quickly? Similar to the propensity to grade, we
therefore define a ‘propensity to cure’ that measures the ability of the case manager to
get individuals, other that the individual concerned, back to work quickly. Column (2) of
Table 8 shows the results of the IV regressions when we control for case manager quality
using this propensity to cure. Again, we take the return-to-work within one year as the
relevant outcome measure. Being appointed to the highest quality case manager rather
than the lowest quality case manager increases the likelihood to return to work with 36
percentage point. At the same time, the effect of graded return-to-work itself decreases to
-0.027 when all trajectories are considered and to 0.191 when only the trajectories in the
17The correlation between the propensity to grade and the weeks waited propensity equals 0.3433. The