NEURORADIOLOGY REVIEW SERIES
Sellar and Parasellar Imaging
Carlos Zamora, MD, PhD Mauricio Castillo, MD
Department of Radiology, Division of Neuroradiology, University of North Caro-lina School of Medicine, Chapel Hill, North Carolina
Correspondence: Carlos Zamora, MD, PhD, Division of Neuroradiology, University of North Carolina School of Medicine,
3326 Old Infirmary Rd, Chapel Hill, North Carolina 27514.
E-mail:[email protected]
Received,December 16, 2015. Accepted,October 18, 2016. Published Online,December 7, 2016.
CopyrightC2016 by the
Congress of Neurological Surgeons.
The skull base is a complex anatomical region that harbors many important neurovascular structures in a relatively confined space. The pathology that can develop at this site is varied, and many disease processes may present with similar clinical and neuroimaging findings. While computed tomography maintains a role in the evaluation of many entities and can, for instance, delineate osseous erosion with great detail and characterize calcified tumor matrices, magnetic resonance imaging (MRI) is the mainstay in the neuroimaging assessment of most pathology occurring at the skull base. Various MRI sequences have proven to be robust tools for tissue characterization and can provide information on the presence of lipids, paramagnetic and diamagnetic elements, and tumor cellularity, among others. In addition, currently available MRI techniques are able to generate high spatial resolution images that allow visualization of cranial nerves and their involvement by adjacent pathology. The information obtained from such examinations may aid in the distinction of these disease processes and in the accurate delineation of their extent prior to biopsy or treatment planning.
KEY WORDS:Neuroimaging, Parasellar, Pituitary, Sella, Skull base, Sphenoid, Suprasellar
Neurosurgery 80:17–38, 2017 DOI:10.1093/neuros/nyw013 www.neurosurgery-online.com
C
haracterization of sellar and parasellarlesions is challenging due to the anatomical complexity of the skull base, the extensive breadth of pathology that one may encounter, and the similar imaging appearance and clinical presentations of some entities. The presence of various critical neurovascular struc-tures in a confined space complicates surgical access for tissue diagnosis or resection and under-scores the importance of appropriate imaging. We review relevant neuroimaging aspects of sellar and parasellar lesions with particular attention to the anterior skull base.
RELEVANT ANATOMY
AND EMBRYOLOGY
Pituitary Embryology
The adenohypophysis derives from a diver-ticulum that arises from the primitive oral cavity (Rathke’s pouch) and projects toward the central skull base at around weeks 4 and
5.1,2A diencephalic infundibulum then projects
inferiorly and contacts the diverticulum, which
loses its connection to the oral cavity.2 The
anterior wall of the pouch fills with cells and forms the pars distalis, leaving a small cleft between it and the posterior wall, which becomes
the pars intermedia.3 A small infundibular
process grows superiorly and becomes the pars
tuberalis.2 The posterior diencephalic tissue
evolves into the neurohypophysis.4
Anatomy of the Sphenoid Bone
The sphenoid bone is the largest component of the anterior skull base. Understanding its complex anatomy is key in evaluating sellar and parasellar pathology due to the popularity of endoscopic approaches to access many of
these lesions.5 The sphenoid bone holds the
pituitary gland within the sella and adjacent structures, including cavernous sinuses and traversing cranial nerves. It features numerous foramina and fissures through which neurovas-cular structures pass. The sphenoid body is situated in the midline and has a cuboidal shape. Anterolaterally and superiorly, it extends as the greater wings forming the anteromedial aspects of the middle cranial fossae. The carotid sulci are located above their attachment to the sphenoid body lodging the internal carotid arteries and lateral cavernous sinuses. The lesser wings project posterolaterally, forming the superior orbital fissures between themselves and the greater wings. The flat surface connecting the lesser wings is the planum sphenoidale.
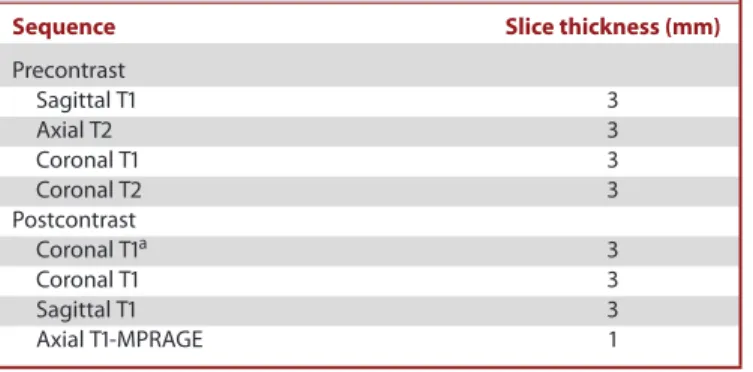
TABLE. Pituitary MRI Protocol at Our Institution
Sequence Slice thickness (mm)
Precontrast
Sagittal T1 3
Axial T2 3
Coronal T1 3
Coronal T2 3
Postcontrast
Coronal T1a 3
Coronal T1 3
Sagittal T1 3
Axial T1-MPRAGE 1
aDynamic scan with 5 slices per acquisition every 30 s for 3 min.
The sella is a saddle-shaped concavity in the sphenoid body that is devoid of a bony covering laterally and superiorly. The pituitary gland is lodged in the sella and bounded laterally by cavernous sinuses, which are large venous plexuses between inner and outer layers of dura mater. The cavernous sinuses are interconnected via channels crossing the midline along the anterior, inferior, and posterior pituitary surfaces. A reflection of the inner dural layer above the pituitary gland forms the diaphragma sellae, which has a variable-sized opening for the infundibulum.
IMAGING PROTOCOLS
Magnetic resonance imaging (MRI) is a mainstay in the evaluation of sellar and parasellar pathology, due to intrinsic high-contrast resolution and availability of advanced sequences
FIGURE 1.Microadenoma.A, Coronal andBsagittal postcontrast T1-weighted images demonstrate a small hypoenhancing focus in the right pituitary gland (arrow, A) abutting the right supraclinoid internal carotid artery (arrowhead, A). Notice upward convexity of the right superior pituitary surface and slight bulging into the suprasellar cistern without compression of the optic chiasm or nerves.
that offer high spatial resolution. Isotropic CISS (constructive interference in steady state) or its analog FIESTA-C (fast imaging employing steady-state acquisition cycled phases) are derived from steady-state free precession (SSFP) sequences that are acquired in a way that eliminates phase artifacts and generates fluid-sensitive images with high spatial resolution in a short
period of time.6The isovolumetric data provide excellent contrast
between fluid and surrounding tissues and can be reconstructed
in any plane.7 CISS and FIESTA-C are particularly useful for
delineating the cisternal segments of the cranial nerves due to the bright signal from surrounding cerebrospinal fluid (CSF). Administration of intravenous contrast material in SSFP-based sequences allows visualization of the interdural cranial nerve segments and may be able to depict their relationship with skull
base lesions.8,9 High-resolution cranial nerve MRI should be
performed at a minimum of 1.5 Tesla and ideally at 3.0 Tesla, as the latter provides higher signal-to-noise ratio and increases the
conspicuity of cranial nerves.10 Isovolumetric gradient echo
T1-weighted MR sequences (volumetric interpolated brain exami-nation, VIBE, or magnetization-prepared rapid acquisition with gradient echo, MP-RAGE) allow for multiplanar reconstruc-tions. However, contrast enhancement may be less conspicuous
compared to spin-echo images.11
For the pituitary gland, thinner slices are acquired with smaller field of views centered at the sella. Dynamic contrast-enhanced sequences are obtained in the coronal plane and acquired every
30 s for 3 min following intravenous contrast injection (Table).
These take advantage of the different contrast dynamics of adenomas in relation to pituitary tissue and may be useful for
evaluation of small tumors.12,13 Most adenomas enhance more
slowly (peak between 60 and 200 s) than the briskly and avidly
enhancing pituitary tissue.14
SELLAR AND PARASELLAR IMAGING
FIGURE 2. Cavernous sinus invasion and hemorrhage in a macroadenoma.A, Sagittal noncontrast T1-weighted image shows a sellar/suprasellar mass with a hyperintense upper component due to hemorrhage.B, Postcontrast T1-weighted image shows enhancement of the lesion except for the hemorrhagic component.C, Axial T2-weighted image shows a blood level within the mass (arrow).D, Coronal postcontrast T1-weighted image demonstrates definite left cavernous sinus invasion with complete encasement of the internal carotid artery (arrowhead).
NEOPLASTIC
Pituitary Adenoma
Adenomas account for 10% to 15% of intracranial tumors.15
They have a prevalence of 17% based on a meta-analysis of
autopsy and imaging data.16 Adenomas have been arbitrarily
classified into microadenomas (<10 mm) and macroadenomas
(≥10 mm). Microadenomas may be difficult to detect due to their
size but nonetheless be highly symptomatic, while macroade-nomas have the potential to exert mass effect. Ademacroade-nomas can also
be classified according to their cellular origin into lactotrophs, somatotrophs, gonadotrophs, corticotrophs, and thyrotrophs. In an epidemiologic study, 74% of macroadenomas and 22% of
microadenomas were nonfunctioning.17 Functioning adenomas
secrete prolactin in 25% to 41% and adrenocorticotropic and
growth hormones in 5% and 2.8% of cases, respectively.16
Identification of small lesions may benefit from dynamic contrast-enhanced MRI or, rarely, computed tomography (CT) techniques (usually when MRI cannot be performed) based on the differential rate of enhancement of adenomas compared to
FIGURE 3.Giant invasive macroadenoma. A, Axial postcontrast T1-weighted image shows tumor invading the cavernous sinuses, sinonasal cavity, right orbit, and left middle cranial fossa.B, Coronal postcontrast T1-weighted image shows carotid encasement bilaterally and mass effect on the right prechi-asmatic optic nerve.
FIGURE 4. Meningioma. Sagittal postcontrast T1-weighted image shows an avidly enhancing meningioma along the planum sphenoidale, tuberculum sellae, and sella turcica (arrow) with an associated dural tail (arrowhead) and pneumosinus dilatans (star).
FIGURE 5. Meningioma. Axial postcontrast T1-weighted image demon-strates a meningioma invading the left orbit (arrow) and posterior ethmoid cells. Note hyperostosis of the greater sphenoid wing (white arrowhead) and anterior clinoid process (black arrowhead).
SELLAR AND PARASELLAR IMAGING
FIGURE 6. Craniopharyngioma in a child.A, Axial noncontrast CT image shows a partially calcified suprasellar mass and obstructive hydrocephalus.B, coronal T2-weighted image shows the mass (black arrows) to have cystic and solid components.C, sagittal postcontrast T1-weighted image demonstrates the sellar, suprasellar, and prepontine extent of the tumor and areas of enhancement.D, Axial susceptibility-weighted imaging minimum intensity projection demonstrates blooming artifact within the mass (white arrow) related to calcification.
pituitary tissue. Normal pituitary parenchyma shows homoge-neous enhancement at 60 to 80 s following administration of
contrast material.18Maximum image contrast between adenomas
and pituitary tissue occurs at about 1 min and gradually decreases
thereafter (Figure 1).19 However, an adenoma may enhance
earlier than pituitary tissue due to direct arterial supply.18While
signal intensity on T2-weighted sequences is variable
(particu-larly in large tumors) due to hemorrhage, cysts, or necrosis,20T2
hypointensity has been commonly reported in
growth-hormone-producing adenomas.21,22
Large adenomas usually infiltrate the gland; therefore, a displaced but otherwise normal-appearing pituitary gland may be helpful in ruling out an adenoma. Up to 10% of adenomas invade the cavernous sinuses (more frequently larger lesions) and tend to be biologically aggressive, with increased surgical morbidity and
mortality.22-24 Imaging features that may be indicative or highly
suggestive of cavernous sinus invasion (or absence of such) are usually assessed on coronal pre- and postcontrast T1-weighted
sequences.24,25 In one study, greater than 67% encasement of
the internal carotid artery by tumor (about 241◦) yielded a
FIGURE 7.Chordoma discovered in a 10-year-old girl who presented for suspected adenoid enlargement.A, Sagittal noncon-trast T1-weighted image shows a large mass (m) centered at the lower clivus and projecting into the pharynx and posterior fossa with compression of the brain stem.B, Sagittal postcontrast T1-weighted image shows avid enhancement of the lesion.
C, Sagittal postcontrast CT shows erosive changes in the tip of the clivus.D, Axial T2-weighted image demonstrates marked T2-hyperintensity of the mass with dark intervening septations in a honeycomb pattern.E, Postcontrast T1-weighted image shows septal enhancement (arrowheads) and a more solid enhancing central component.F, Axial postcontrast CISS image demonstrates dural disruption (arrow) and extrusion of tumor into the subarachnoid space of the posterior fossa.
100% positive predictive value (PPV) for invasion as confirmed
by surgery.24 Other imaging findings included obliteration of
the carotid sulcus venous compartment (95% PPV) and tumor
extension beyond the lateral intercarotid line (85% PPV).24
Features predicting absence of invasion include less than 25% of carotid encasement, presence of pituitary tissue between the tumor and carotid artery, and tumor not extending beyond the
medial intercarotid line (Figure2).24
Five percent to 14% of surgically treated adenomas are
classified as “giant” (greater than 4 cm).15 Despite their benign
histology, such tumors can infiltrate the skull base and, rarely,
extend to the nasopharynx (Figure3).26Large adenomas undergo
spontaneous infarction at a greater rate than any other central nervous system (CNS) tumor, probably due to outgrowth of their blood supply, vascular compression from expansion, or other
intrinsic features.27,28 This occurs with or without hemorrhage
and may lead to pituitary apoplexy, which can rarely be
compli-cated by retroclival hematomas.27,29 Pituitary carcinomas are
exceedingly rare, and distant spread is the only imaging feature
that may distinguish them from adenomas.30
Meningioma
Meningiomas constitute the most common primary CNS neoplasms, with an incidence of 7 in 100 000 individuals
according to one population-based study.31 They are 3 times
more common in females and are largely tumors of adulthood,
with greater than 70% occurring after age 55.31 Meningiomas
are rarely seen in children unless syndromic or associated with radiation (less than 2% occur in patients 20 yr of age or
younger).32 With 15 subtypes in the 2007 WHO classification,
they are histologically heterogeneous, although most (90%)
are benign and classified as grade I.33 Six percent of
menin-giomas are anaplastic (grade II) and 5% frankly malignant
(grade III).33 Meningiomas arise from arachnoid cap cells
in the leptomeninges, which derive from the mesenchyme
and neural crest.34,35 They are almost always dural-based
(but may be intraventricular or very rarely extracranial) and commonly occur along dural reflections. Approximately 40%
arise in the skull base.36 Roughly one-half of anterior skull
base meningiomas arise at the sphenoid wings and the remainder from the tuberculum sellae, limbus sphenoidale, and
SELLAR AND PARASELLAR IMAGING
FIGURE 8. Chordoma with dural disruption.A, Axial postcontrast CT image shows an erosive lesion (black arrows) involving the left petroclival fissure and carotid canal.B, Axial noncontrast T1-weighted image shows the lesion to be mildly hyperintense relative to CSF.C, Axial postcontrast T1-weighted image shows avid enhancement of the mass.D, Axial T2-weighted image shows the mass to be well circumscribed and very bright.E, Axial postcontrast CISS shows the mass (thin arrows) in the left petroclival region. Note the location of both cranial nerves 6 in the prepontine cistern (black arrowheads).F, Sagittal postcontrast CISS shows dural disruption (white arrowhead) and subarachnoid extrusion of the mass with elevation of left cranial nerve 6 (white arrow).
chiasmatic and olfactory grooves (Figure 4).37 Therefore,
extension frequently occurs into the optic canals, cavernous
sinuses, or sella (Figure5). Arterial encasement may be present,
which can lead to stenosis.38 Anterior skull base meningiomas
can result in abnormal dilatation of an adjacent paranasal sinus
(pneumosinus dilatans).39
On noncontrast CT, meningiomas tend to be iso- to hyper-dense to cerebral cortex and are difficult to visualize unless they are large or calcified or there is hyperostosis, which appears to be more common in the skull base (occurring in 50% of patients)
compared to convexity meningiomas.40On MRI they are usually
well circumscribed, iso- to hypointense on T2, and show avid contrast enhancement, although this will vary according to the degree of calcification or, rarely, cystic degeneration. Although not entirely specific, identification of a dural tail may suggest a meningioma if the original definition is applied: the tail must (a) be thicker closer to the tumor and taper peripherally, (b) enhance to a greater degree than the tumor, and (c) be seen in 2 consecutive
tumor sections and more than one plane.41,42 Studies on their
apparent diffusion coefficient (ADC) characteristics have yielded
variable results.43
Craniopharyngioma
Craniopharyngiomas are nonglial epithelial tumors arising from remnants of Rathke’s pouch or rests of buccal mucosa at
any point along the trajectory of the craniopharyngeal duct.44
While their most common site of origin is the infundibulum, where squamous epithelial rests are known to occur, they may rarely arise primarily within the third ventricle, sphenoid bone,
or even nasopharynx.45They are rare, with an incidence of 0.5 to
2 cases per million persons per year, up to half occurring during
childhood and adolescence.46They constitute 4% of intracranial
neoplasms in the pediatric population and have a bimodal
distribution, with peaks at 5 to 14 and 50 to 75 yr of age.47,48
Histologically, craniopharyngiomas are almost always benign and have a high survival rate, but they can be locally aggressive and
may be associated with significant morbidity.46Those occurring
in childhood are more commonly of the adamantinomatous type and present as heterogeneous cystic and solid suprasellar
masses (Figure 6). Approximately 90% of these have
calcifi-cations that can be readily identified on CT.44,46 The solid
portions show contrast enhancement, and on MRI the cystic
FIGURE 9. Trigeminal schwannoma. Axial postcontrast T1-weighted image shows an avidly enhancing schwannoma (arrow) involving the trigeminal ganglion within Meckel cave and the cisternal segment of the nerve.
components may present with variable signal intensities depending on their contents of protein, cholesterol, or
hemor-rhage.44 Tumors in adulthood are more commonly of the
papillary type and are solid, less commonly calcified, and devoid
of cysts.44,46 Due to their preferred infundibular location, age
at presentation, and solid appearance with lack of calcification or cystic changes, papillary craniopharyngiomas may be difficult to distinguish from germinomas. While they both usually show strong contrast enhancement, germinomas have lower ADC values by virtue of their higher grade histology and cellularity
compared to papillary craniopharyngiomas.49
Chordoma
Most chordomas are histologically low-grade but locally aggressive tumors derived from embryonic remnants of the
notochord.50 Three subtypes have been recognized, with the
conventional form accounting for the majority, followed by chondroid chordoma with cartilaginous elements and the rare dedifferentiated chordomas, which are malignant and have the
worst prognosis.51,52 Half of all chordomas are sacrococcygeal,
one-third occur in the skull base, and a minority arise in the
spine.51 They are twice as common in males, have a peak
incidence between 50 and 60 yr of age, and are rare in children and
adolescents.52These tumors most frequently occur midline at the
spheno-occipital synchondrosis, although the chondroid subtype
has a tendency to arise laterally at the petroclival junction.50,53
Chordomas are extradural and almost always originate in bone, which may lead to bony sequestra (the chondroid variant may
have a true calcific matrix) that can be demonstrated on CT.53
On MRI, chordomas are well circumscribed with a pseudoen-capsulated appearance and markedly bright on T2-weighted
sequences, probably secondary to mucin and/or necrosis.53 T2
signal in the chondroid variant may be relatively low due to
cartilaginous tissue.54 Interlobular septa are formed by
epithe-lioid cells and appear hypointense on T2 with variable degrees of
contrast enhancement (Figure7).53 Chordomas are soft tumors
that tend to displace or encase blood vessels, but stenoses are
rare.55Dural transgression can be present, and tumor can extend
FIGURE 10. Optic pathway glioma in a patient with neurofibromatosis type 1.A, Axial T2-weighted image shows enlargement of the optic nerves bilaterally (arrows), worse on the left.B, Axial postcontrast T1-weighted image shows heterogeneous enhancement on both sides, extending to the chiasm on the left.
SELLAR AND PARASELLAR IMAGING
FIGURE 11. Sporadic optic pathway glioma.A, Axial T2 shows enlargement of the optic chiasm (black arrow) and tracts (arrowhead) due to infiltrative tumor.B, Sagittal postcontrast T1 shows a mass involving the chiasm, hypothalamus, and anterior third ventricle (white arrow) with a small focus of enhancement.
FIGURE 12.Cystic optic pathway glioma. Axial postcontrast T1-weighted image shows a nonenhancing cystic mass (arrow) expanding the left optic nerve.
into the subarachnoid space, increasing the risk of CSF leaks and
infection.56 Dural disruption may be identified on T2-weighted
imaging but is best visualized on high-resolution SSFP-based sequences, where administration of contrast may aid in delin-eation of tumor against nonenhancing dura and depiction of its
relationship to cranial nerves (Figure7).8
Chondrosarcoma
Chondrosarcomas are often described together with
chordomas, as they share similar imaging features, clinical presentations, and locations. Both are rare and usually present in adults between the fourth and fifth decades of life and
together constitute less than 1% of intracranial tumors.50,57
Chondrosarcomas represent 6% of all skull base tumors, and
only 1% of them occur at this site.58 Compared to chordomas,
conventional chondrosarcomas are relatively indolent and have
a more favorable prognosis.50 Metastases and recurrence are
rare, except for the unusual dedifferentiated subtype, which
has an aggressive course.59 While pathogenesis is uncertain,
chondrosarcomas are believed to arise from chondrocytes within endochondral cartilage rests and are commonly located at the petroclival (two-third of cases), spheno-occipital, and sphenopet-rosal synchondroses, therefore more commonly off-midline
compared to chordomas.60,61CT demonstrates osseous erosions
and destructive changes usually with a calcified chondroid matrix that may have typical “rings and arcs” or nonspecific foci of
amorphous calcifications.62Similarly, on MRI, chondrosarcomas
are usually well circumscribed and hyperintense on T2-weighted sequences, with variable degrees of heterogeneous contrast
enhancement (Figure 8).50,57,61 As opposed to chordomas,
FIGURE 13. Germinoma.A, Axial noncontrast CT image shows a hyperdense suprasellar mass (arrow).
B, Axial T2-weighted image shows the mass to be iso- to mildly hyperintense relative to cortex.C, Sagittal postcontrast T1-weighted image shows heterogeneous enhancement of the mass.D, ADC map shows low signal from the mass in keeping with restricted diffusion.
chondrosarcomas more often present with ophthalmoplegia,
presumably due to their preferred lateral location.61 Finally,
while some of their imaging features overlap, a recent study using diffusion-weighted imaging suggests that chondrosarcomas have
significantly higher ADC values than chordomas.63
Schwannoma
Schwannomas are benign, slow-growing neoplasms that arise from Schwann cells. They make up 8.5% of intracranial tumors and are usually seen in adulthood, the overwhelming majority originating from cranial nerve (CN) VIII (90%), followed by
CN V (1%-8%) and CN VII.64 In the parasellar region,
CN V schwannomas predominate, while CN III, IV, and VI schwannomas are rare, except in the setting of
neurofi-bromatosis type 2.64 The most common location of CN V
schwannomas is the gasserian ganglion, but they can also affect the cisternal or postganglionic segments, and the cavernous
sinus is often involved.65,66 Most patients present with CN V
dysfunction, although symptoms related to compression of CN
VI within Dorello’s canal may be present.65 On MRI,
schwan-nomas are iso- to hypointense on T1 and hyperintense on T2-weighted sequences and show avid contrast enhancement
(Figure 9).65,67 Their heterogeneity varies according to the
presence of cystic changes or, rarely, hemorrhage or
calcifica-tions.65-67 Melanotic schwannomas are rare and show intrinsic
T1 hyperintensity, in which case they may be confused with lipomas, although the latter suppress on fat-saturated sequences.59,68,69
SELLAR AND PARASELLAR IMAGING
FIGURE 14. Plasmacytoma.A, Axial postcontrast CT shows a large lytic skull base lesion (arrows).B, Axial T2-weighted image shows the mass to be predominantly iso- to hypointense and to encase the carotid arteries bilaterally.C, Sagittal noncontrast T1-weighted image shows that the mass (star) is hyperintense relative to brain parenchyma.D, Axial postcontrast T1-weighted image shows diffuse and avid enhancement of the mass.
Optic Pathway Glioma
These lesions represent 3% to 5% of brain tumors in children,
and the great majority are diagnosed before age 20.70 They
account for 65% of all optic nerve tumors, and roughly one-third
are associated with neurofibromatosis type 1.71They are, in fact,
the most common CNS neoplasms in this syndrome, in which
they have been reported in 7% to 20% of children.70Syndromic
optic nerve gliomas almost always develop before age 4 and are
low grade and generally indolent.72While it appears that sporadic
gliomas are associated with worse outcomes, their presentation differs from syndromic tumors in that the latter are usually found in asymptomatic patients as part of routine screening and
their natural history has not been conclusively demonstrated.73
Syndromic status also has implications for tumor location. Optic pathway gliomas in neurofibromatosis type 1 more frequently involve the optic nerves, while sporadic ones favor a
chias-matic or postchiaschias-matic location (Figures 10 and 11).72,73 On
MRI, they infiltrate and cause enlargement of optic nerves, chiasm, and/or optic tracts. They are iso- to hypointense on T1 and hyperintense on T2-weighted sequences and usually well
demarcated.73 Enhancement is variable and does not correlate
with tumor grade.74 Calcifications are uncommon and
hemor-rhage is exceedingly rare.70,72,75 Cysts may be present and are
more common in sporadic tumors (Figure 12).72 Increased T2
signal is generally not useful to evaluate involvement of the
optic tracts, as it may be also related to edema.72 Postcontrast
images may be helpful in this regard, since enhancement indicates
tumor.74
Germ Cell Tumor
Germinomas represent 50% to 70% of intracranial germ cell tumors, with the rest belonging to the nongerminomatous
FIGURE 15. Osseous metastasis in a patient with breast cancer.A, Axial T2-weighted image shows a hypointense mass in the skull base (arrow) with partial carotid encasement and extension into the anterior left Meckel cave (arrowhead).B, Axial postcontrast T1-weighted image shows enhancement of the tumor.
FIGURE 16. Rathke cleft cyst. Sagittal noncontrast T1-weighted image shows a hyperintense cyst (arrow) displacing the pars distalis anteriorly. Note the thin pars intermedia between the cyst and the bright posterior pituitary (arrowhead).
subtype.76Germ cell tumors are predominantly seen in children
and account for nearly 4% of pediatric intracranial tumors in the United States, most of them diagnosed between 5 and 14
yr of age.48 Pure germinomas are usually diagnosed in patients
between 10 and 21 yr of age, while nongerminomatous tumors
are more often seen in younger children.76 The incidence of
intracranial germ cell tumors is significantly higher in Asian countries and also in patients of Asian descent living in the United
States.77 Alfa-fetoprotein andβ-human chorionic gonadotropin
are commonly found in CSF and serum and may be helpful
markers for diagnosis.76,78
Intracranial germ cell tumors favor a midline location around
the third ventricle.79The majority of lesions arising in the pineal
region are nongerminomatous, while suprasellar ones are more likely to be germinomas, with these 2 sites constituting the most
common locations.80 Five percent to 10% of germinomas are
ectopic and occur in basal ganglia or thalami.81 These have an
increased incidence in Asia and may be associated with ipsilateral
cerebral or brainstem atrophy.82 Rarely, germinomas may occur
within the sella turcica.30While pineal germ cell tumors are most
common in males, suprasellar ones are slightly more frequent
in females.30,78 Pure germinomas are exquisitely radiosensitive,
with survival rates greater than 90% at 5 yr with radiotherapy
alone.76
The earliest finding of a suprasellar germinoma may be absence of the pituitary bright spot due to disruption of the
infundibulo-neurohypophyseal system.30 Enhancement is typically avid and
SELLAR AND PARASELLAR IMAGING
FIGURE 17. Intracystic nodule in a Rathke cleft cyst.A, Coronal T2-weighted image shows a dark intra-cystic nodule (arrow).B, Sagittal noncontrast T1-weighted image shows the nodule to be very bright.
more homogeneous in germinomas compared to
nongermi-nomatous tumors, which are more commonly hemorrhagic.83
Germinomas are highly cellular and, as a result, show restricted
diffusion on MRI and are usually hyperdense on CT.83,84
Compared to nongerminomatous tumors, one study suggests that
germinomas may show lower ADC values on MRI (Figure13).85
However, conventional imaging characteristics of germinomas and nongerminomatous tumors are similar, and reliable
discrimi-nation between histologic subtypes is not possible.76These lesions
are iso- to slightly hyperintense on T2-weighted images, and T1
signal intensity is variable.83,84 Cystic changes may be seen, and
calcifications are unusual (as opposed to pineal region tumors, in
which calcifications may “engulf ” the pineal gland).84Germ cell
tumors have a high propensity to seed CSF, and therefore imaging
of the entire neuraxis is warranted.30
Plasmacytoma
Plasma cell neoplasms can present systemically as multiple
myeloma or as discrete masses in the form of plasmacytomas.86
Plasmacytomas are usually intramedullary and solitary but may
occasionally be multiple or extramedullary.86 By definition,
solitary plasmacytomas occur without other stigmata of multiple myeloma, such as anemia, renal insufficiency, or scattered
skeletal lesions.87 Skull base plasmacytomas usually arise from
the nasopharynx, clivus, or petrous apex.88 The great majority
of patients with a solitary plasmacytoma will develop multiple myeloma, although this appears to be less common with
extramedullary tumors.88,89 While the imaging appearance is
nonspecific to allow a preoperative diagnosis, one of their most
characteristic features on MRI is perhaps the intrinsic T1 hyperin-tensity of some tumors, presumably related to densely packed cells
and a low water content (Figure14).88As opposed to
chondrosar-comas or chordomas, which are markedly hyperintense on T2, plasmacytomas are relatively isointense to gray matter due to high cellularity and lack a calcific matrix or areas of sequestered
bone.88,90 Plasmacytomas enhance avidly and homogeneously,
which are also features of lymphoma, but the latter tends to have intermediate to low signal intensity on both T1 and T2-weighted
sequences.30
Metastases
Metastases to the skull base occur in approximately 4%
of cancer patients.91 While various tumors metastasize to this
region, in one literature review, the most common primaries in order of frequency were prostate and breast cancer, lymphoma,
and lung cancer.92 Most skull base metastases probably spread
hematogenously, although seeding may also occur through the valveless Batson venous plexus, which connects the pelvic and
thoracic venous systems with intracranial veins and sinuses.92,93
Additionally, the skull base can be involved by direct extension of nasopharyngeal or sphenoid tumors or via perineural spread,
commonly along branches of CN V.94,95 Infiltration can lead
to a distinct parasellar syndrome, with neuropathies frequently
involving CNs III and V.96 On MRI, osseous metastases
are typically identified as hypointense geographic areas of marrow replacement on noncontrast T1-weighted sequences. Because marrow fat is normally hyperintense on both T1-and T2-weighted sequences, fat saturation is useful to visualize
FIGURE 18.Epidermoid tumor.A, Sagittal noncontrast T1-weighted image shows an extra-axial lesion (white arrows) in the suprasellar region and anterior to the brain stem. Its signal intensity is slightly higher than that of CSF.B, Axial T2-weighted image shows mild heterogeneity within an otherwise cystic-appearing lesion.C, Axial FLAIR demonstrates heterogeneous signal with a so-called “dirty” appearance (black arrows).
D, Axial diffusion-weighted image shows increased signal from the lesion (arrowheads).
metastases after administration of intravenous contrast material
(Figure15). Diffusion-weighted imaging may improve detection
of calvarial metastases by showing areas of increased marrow signal, with the exception of prostate cancer, which is primarily sclerotic.97,98
In contradistinction, pituitary metastases are relatively rare. They are most frequently secondary to lung and breast cancer (more than one-half of cases), followed by renal and colorectal
cancer.99 Pituitary metastasis present as a mass involving the
pituitary stalk or gland, may have a waist at the diaphragma sellae, can extend cranially to involve the hypothalamus, and the majority show loss of the pituitary bright spot and avid contrast
enhancement.99 Their distinction from adenomas is difficult.
While smooth expansion of the sella favors an adenoma, erosion of the sella or skull base does not necessarily indicate a metastasis,
as macroadenomas can be large and infiltrative.100Edema along
the optic tracts may be present but is a nonspecific finding that
can be seen in a variety of tumors.101
SELLAR AND PARASELLAR IMAGING
FIGURE 19. Ruptured dermoid tumor. Sagittal noncontrast T1 shows a predominantly hyperintense suprasellar mass (arrow). Hyperintense lipid material can be seen in the lateral and fourth ventricles, quadrigeminal and prepontine cisterns, and posterior fossa.
CONGENITAL
Rathke Cleft Cyst
These are benign, true epithelial cysts believed to arise from remnants of Rathke’s pouch due to incomplete obliteration of
the embryonic cleft.30 They are more common in females, with
symptomatic patients usually presenting between ages 30 and 60,
although they may be seen at any age.30,102 While the majority
of them are small, asymptomatic, and found incidentally (in up to 33% of pituitary glands at autopsy), they may occasionally
grow and cause mass effect.102,103 Their contents are almost
always homogeneous, but their signal characteristics on MRI vary according to the presence of protein, mucopolysaccharides,
and, rarely, hemorrhage.104 They are located centrally or near
centrally within the pituitary gland (typically without deviation of the stalk) between the pars distalis and the pars intermedia
but may also have suprasellar extension (Figure16).18,102While
they are frequently hyperintense on T2-weighted images, lesions that are homogeneously T2 hypointense are highly suggestive of the diagnosis, as is the presence of a T1-hyperintense and T2-hypointense intracystic nodule (representing a mucinous
mass with cholesterol and protein) (Figure17).103,105,106 Aside
from intracystic nodules and epithelial rests, they do not have solid components, do not enhance with contrast material, and
rarely calcify.104Rathke cleft cysts may rarely be complicated by
infection, hemorrhage, or chemical meningitis.107,108
Dermoid and Epidermoid Tumor
Both of these nonneoplastic lesions develop from inclusion of ectodermal remnants during neural tube closure and differ histopathologically in that dermoids contain dermal appendages
and epidermoids do not.109,110 They both accumulate
desqua-mated debris from their capsules and grow slowly.109 Despite
being congenital, they are infrequently found in children and
usually manifest later in life.109Both are rare, but dermoids are
less common.108Their location may vary, but dermoids are more
commonly found midline while epidermoids tend to occur
off-midline or asymmetrically to one side.108,110Between 40% and
50% of intracranial epidermoids occur in the cerebellopontine angles, 30% are parasellar, and 25% are primarily intraosseous
with potential involvement of the subdural space.111
On CT, most epidermoids have low density that approaches CSF and may be difficult to distinguish from arachnoid cysts. Increased density in a minority of them may result from
hemor-rhage, increased protein, or saponification.112,113 On MRI,
their T1 and T2 signal intensities are usually close to those of CSF, but the lesion does not suppress on fluid-attenuated inversion recovery (FLAIR) sequences, on which it shows a
“dirty” appearance (Figure18).114Classically, they demonstrate
very high (“light bulb bright”) signal intensity on diffusion-weighted sequences, with ADC values that may not be as low as expected, probably from a combination of restricted diffusion
and T2 shine-through effects.114,115 Calcification is present in
10% of epidermoid tumors.116 Dermoids tend to follow fat
characteristics on CT and MRI but may be hypointense on T2
(Figure19). Except for a thin peripheral rim in some, dermoids
and epidermoids do not enhance.116,117 Malignant
transfor-mation to squamous cell carcinoma is rare and can be seen in
both lesions but is more common in epidermoids.118
Arachnoid Cyst
Arachnoid cysts are benign nonneoplastic structures filled with
CSF and lined by arachnoid cells and collagen.119They are more
common in males and have an imaging prevalence of 1% to 3%,
with 75% found in children.120,121Between third and
one-half are located in the middle cranial fossa, followed by the
retro-cerebellar region.121,122Growth is rare for incidentally found cysts
and the majority are asymptomatic, although they occasionally may result in obstructive hydrocephalus, cranial neuropathies,
seizures, or headaches.121Lack of or incomplete communication
between the cyst and subarachnoid space is thought to be a factor
in the development of mass effect and progressive symptoms.123
While this has traditionally been assessed with CT cisternog-raphy, more recent studies have focused on the use of phase-contrast MRI to document jet-like flow within communicating arachnoid cysts or on the demonstration of cyst walls using
SSFP sequences (Figure 20).123-125 Arachnoid cysts are
well-demarcated, expansile, and unilocular lesions without internal
architecture, which often result in osseous remodeling.83,126Most
arachnoid cysts follow CSF signal intensity on all MRI sequences
FIGURE 20.Arachnoid cyst.A, Sagittal noncontrast T1-weighted image shows an extra-axial lesion with CSF signal intensity (arrows).B, Axial FLAIR shows suppression of signal from the lesion (arrowheads).C, Sagittal noncontrast CISS delineates the walls of the cyst and its mass effect on the diencephalic structures and optic nerves.D, Axial postcontrast T1-weighted image shows no enhancement within the lesion.
and suppress on FLAIR, except for some that may contain
increased proteins or hemorrhage.126
Hypothalamic Hamartoma
These are benign lesions consisting of neuronal and glial tissues that arise from the inferior hypothalamus or tuber
cinereum.127,128 They are classically associated with gelastic
seizures, precocious puberty, and developmental delay, although
there is considerable variability in their presentation.129
Hamar-tomas can develop along the floor of the third ventricle or within the hypothalamus proper or be pedunculated, often with
attach-ments to the mammillary bodies or tuber cinereum.129,130 On
MRI, they do not strictly follow gray matter signal intensity, and most are mildly hyperintense on T2 (probably due to glial tissue) and iso- to hypointense on T1-weighted sequences
(Figure21).128-130Like normal brain parenchyma, hamartomas
have a functional blood–brain barrier and should not show
contrast enhancement.130
VASCULAR
Giant Aneurysm
Most aneurysms are thought to develop from a combination of hemodynamic stress and acquired or inherited factors (including
SELLAR AND PARASELLAR IMAGING
FIGURE 21. Hypothalamic hamartoma.A, Sagittal noncontrast T1-weighted image shows a mass (white arrow) along the floor of the third ventricle. The lesion is isointense to cortex.B, Coronal FLAIR shows that the lesion (black arrow) is mildly hyperintense relative to cortex.
connective tissue disorders) that result in progressive weakening
of the parent vessel.131Giant aneurysms are greater than 25 mm
in diameter and are rare but important lesions that may occur
in the suprasellar or parasellar regions.132 Their recognition is
critical due to treatment implications and, most importantly, to avoid a catastrophic biopsy. Giant aneurysms can cause osseous erosion of the skull base and may occasionally extend to the
parapharyngeal space, paranasal sinuses, or infratemporal fossa.133
Their imaging characteristics may be misleading, with heteroge-neous signal intensities and incomplete enhancement owing to thrombosis and blood at various stages. Areas of profound T2 hypointensity within a skull base mass may represent a vascular flow void, and the lesion should be carefully scrutinized to rule out an aneurysm. Pulsation artifact in the phase-encoding direction
may be a useful clue when present (Figure22).
INFLAMMATORY/GRANULOMATOUS
Sarcoidosis
Autopsy studies have found subclinical CNS involvement in
25% of patients with systemic sarcoidosis.134,135This can involve
any part of the brain, meninges, cranial nerves, or calvarium, and its appearance is nonspecific, with leptomeningeal or pachy-meningeal thickening and enhancement and/or cerebral or
soft-tissue granulomata.136 Infiltration of the pituitary gland and
infundibulum/hypothalamus is rare and generally proportional to disease severity but can rarely occur in isolation (which may mimic the appearance of lymphocytic hypophysitis or Langerhans
cell histiocytosis).135 More commonly, hypothalamic/pituitary
involvement is associated with nodular leptomeningeal basilar
enhancement.135-137 As with other granulomatous infections,
sarcoid lesions may be hypointense on T2-weighted images, but
this finding is nonspecific (Figure23).137
Lymphocytic Hypophysitis
Lymphocytic hypophysitis is an infiltrative autoimmune/ inflammatory disorder that may affect the anterior or posterior pituitary gland or infundibulum and is characterized by variable
degrees of pituitary dysfunction.138 It is most commonly seen
in pregnant or postpartum patients but has also been linked to a number of autoimmune conditions, including drug related
(eg, ipilimumab).139 Its imaging appearance is nonspecific and
may be indistinguishable from other infiltrative processes such as Langerhans cell histiocytosis and may also be confused with primary or metastatic neoplasms. It usually leads to thick-ening and avid enhancement of the affected portions of the gland, sometimes with absence of the pituitary bright spot
(Figure 24).140 In some patients, a T2-hypointense area is seen
in the parasellar region, which may suggest the diagnosis.138
CONCLUSION
The sellar and parasellar regions are relatively small areas of the skull base that harbor important neurovascular struc-tures and feature complex anatomy. The pathology that can occur at these sites is varied, and some of the diseases may present with similar clinical and imaging characteristics. Knowledge of relevant neuroimaging features may assist in characterization of these lesions, delineation of their extent, and
FIGURE 22. Giant parasellar aneurysm.A, Coronal noncontrast T1-weighted image shows a partially thrombosed aneurysm (black arrowheads) along the right aspect of the sella and middle cranial fossa.B, Coronal postcontrast T1-weighted image shows enhancement of the nonthrombosed inferior portion of the aneurysm (black arrow).C, Axial T2-weighted image demonstrates a vascular flow void (white arrowhead) related to the perfused portion of the aneurysm.D, Axial FLAIR image shows the presence of pulsation artifact along the phase-encoding direction (white arrows).
FIGURE 23.Neurosarcoid.A, Sagittal postcontrast T1-weighted image shows enhancing tissue in the hypothalamus and along the upper pituitary infundibulum (white arrow) as well as leptomeningeal enhancement along the falx cerebri.B, Coronal postcontrast T1-weighted image shows that the lesion partially encases the prechiasmatic optic nerves. There is leptomeningeal enhancement along the falx cerebri and there are granulomas in the corpus callosum.
C, Axial T2-weighted image shows the suprasellar sarcoid granuloma to be hypointense (black arrow).
SELLAR AND PARASELLAR IMAGING
FIGURE 24. Autoimmune hypophysitis in a patient with hypopituitarism following ipilimumab infusion for melanoma.A, Baseline noncontrast sagittal T1-weighted image shows a normal configuration of the pituitary gland.
B, Sagittal postcontrast T1-weighted image 9 days after ipilimumab infusion shows enlargement and enhancement of the pituitary gland (arrow) and infundibulum.C, Sagittal postcontrast T1-weighted image 5 days later shows decreased size and enhancement of these structures.
awareness of potential mimics prior to diagnostic biopsy or resection.
Disclosure
The authors have no personal, financial, or institutional interest in any of the drugs, materials, or devices described in this article.
REFERENCES
1. Kollias SS, Ball WS, Prenger EC. Review of the embryologic development of the pituitary gland and report of a case of hypophyseal duplication detected by MRI.Neuroradiology. 1995;37(1):3-12.
2. Ikeda H, Suzuki J, Sasano N, Niizuma H. The development and morphogenesis of the human pituitary gland.Anat Embryol (Berl). 1988;178(4):327-336. 3. Larkin S, Karavitaki N, Ansorge O. Rathke’s cleft cyst. In:Handbook of Clinical
Neurology. Vol 2. Elsevier, Cambridge, MA 02139, USA. 2014:255-269. 4. Solov’ev GS, Bogdanov AV, Panteleev SM, Yanin VL. Embryonic
morpho-genesis of the human pituitary.Neurosci Behav Physiol. 2008;38(8):829-833. 5. Patel CR, Fernandez-Miranda JC, Wang WH, Wang EW. Skull base anatomy.
Otolaryngol Clin North Am. 2016;49(1):9-20.
6. Chavhan GB, Babyn PS, Jankharia BG, Cheng HL, Shroff MM. Steady-state MR imaging sequences: physics, classification, and clinical applications. Radio-graphics. 2008;28(4):1147-1160.
7. Xie T, Zhang XB, Yun H, Hu F, Yu Y, Gu Y. 3D-FIESTA MR images are useful in the evaluation of the endoscopic expanded endonasal approach for midline skull-base lesions.Acta Neurochir (Wien). 2011;153(1):12-18. 8. Blitz AM, Macedo LL, Chonka ZD, et al. High-resolution CISS MR
imaging with and without contrast for evaluation of the upper cranial nerves: segmental anatomy and selected pathologic conditions of the cisternal through extraforaminal segments.Neuroimaging Clin N Am. 2014;24(1):17-34. 9. Hayashi M, Chernov MF, Tamura N, et al. Usefulness of the advanced
neuroimaging protocol based on plain and gadolinium-enhanced constructive interference in steady state images for gamma knife radiosurgery and planning microsurgical procedures for skull base tumors.Acta Neurochir Suppl (Wien). 2013;116:167-178.
10. Fischbach F, Muller M, Bruhn H. Magnetic resonance imaging of the cranial nerves in the posterior fossa: a comparative study of t2-weighted spin-echo sequences at 1.5 and 3.0 tesla.Acta Radiol. 2008;49(3):358-363.
11. Furutani K, Harada M, Mawlan M, Nishitani H. Difference in enhancement between spin echo and 3-dimensional fast spoiled gradient recalled
acquisition in steady state magnetic resonance imaging of brain metastasis at 3-T magnetic resonance imaging. J Comput Assist Tomogr. 2008;32(2): 313-319.
12. Gao R, Isoda H, Tanaka T, et al. Dynamic gadolinium-enhanced MR imaging of pituitary adenomas: usefulness of sequential sagittal and coronal plane images. Eur J Radiol. 2001;39(3):139-146.
13. Friedman TC, Zuckerbraun E, Lee ML, Kabil MS, Shahinian H. Dynamic pituitary MRI has high sensitivity and specificity for the diagnosis of mild Cushing’s syndrome and should be part of the initial workup.Horm Metab Res. 2007;39(6):451-456.
14. Sakamoto Y, Takahashi M, Korogi Y, Bussaka H, Ushio Y. Normal and abnormal pituitary glands: gadopentetate dimeglumine-enhanced MR imaging. Radiology. 1991;178(2):441-445.
15. Chabot JD, Chakraborty S, Imbarrato G, Dehdashti AR. Evaluation of outcomes after endoscopic endonasal surgery for large and giant pituitary macroadenoma: a retrospective review of 39 consecutive patients. World Neurosurg. 2015;84(4):978-988.
16. Ezzat S, Asa SL, Couldwell WT, et al. The prevalence of pituitary adenomas: a systematic review.Cancer. 2004;101(3):613-619.
17. Agustsson TT, Baldvinsdottir T, Jonasson JG, et al. The epidemiology of pituitary adenomas in Iceland, 1955-2012: a nationwide population-based study. Eur J Endocrinol. 2015;173(5):655-664.
18. Castillo M. Pituitary gland: development, normal appearances, and magnetic resonance imaging protocols.TMRI. 2005;16(4):259-268.
19. Miki Y, Matsuo M, Nishizawa S, et al. Pituitary adenomas and normal pituitary tissue: enhancement patterns on gadopentetate-enhanced MR imaging. Radiology. 1990;177(1):35-38.
20. Bonneville JF, Bonneville F, Cattin F. Magnetic resonance imaging of pituitary adenomas.Eur Radiol. 2005;15(3):543-548.
21. Hagiwara A, Inoue Y, Wakasa K, Haba T, Tashiro T, Miyamoto T. Comparison of growth hormone-producing and non-growth hormone-producing pituitary adenomas: imaging characteristics and pathologic correlation.Radiology. 2003;228(2):533-538.
22. Potorac I, Petrossians P, Daly AF, et al. Pituitary MRI characteristics in 297 acromegaly patients based on T2-weighted sequences.Endocr Relat Cancer. 2015;22(2):169-177.
23. Ahmadi J, North CM, Segall HD, Zee CS, Weiss MH. Cavernous sinus invasion by pituitary adenomas.Am J Roentgenol. 1986;146(2):257-262. 24. Cottier JP, Destrieux C, Brunereau L, et al. Cavernous sinus invasion by
pituitary adenoma: MR imaging.Radiology. 2000;215(2):463-469.
25. Vieira JO, Jr, Cukiert A, Liberman B. Evaluation of magnetic resonance imaging criteria for cavernous sinus invasion in patients with pituitary adenomas:
logistic regression analysis and correlation with surgical findings.Surg Neurol. 2006;65(2):130-135; discussion 135.
26. Inagawa H, Ishizawa K, Mitsuhashi T, et al. Giant invasive pituitary adenoma extending into the sphenoid sinus and nasopharynx: report of a case with intra-operative cytologic diagnosis.Acta Cytol. 2005;49(4):452-456.
27. Briet C, Salenave S, Chanson P. Pituitary apoplexy.Endocrinol Metab Clin North Am. 2015;44(1):199-209.
28. Oldfield EH, Merrill MJ. Apoplexy of pituitary adenomas: the perfect storm.J Neurosurg. 2015;122(6):1444-1449.
29. Azizyan A, Miller JM, Azzam RI, et al. Spontaneous retroclival hematoma in pituitary apoplexy: case series.J Neurosurg. 2015;123(3):808-812.
30. Huang BY, Castillo M. Nonadenomatous tumors of the pituitary and sella turcica.TMRI. 2005;16(4):289-299.
31. Dolecek TA, Dressler EV, Thakkar JP, Liu M, Al-Qaisi A, Villano JL. Epidemiology of meningiomas post-Public Law 107-206: the benign brain tumor cancer registries amendment act.Cancer. 2015;121(14): 2400-2410.
32. Zhou P, Ma W, Yin S, Li Y, Jiang S. Three risk factors for WHO grade II and III meningiomas: a study of 1737 cases from a single center.Neurol India. 2013;61(1):40-44.
33. Bhat AR, Wani MA, Kirmani AR, Ramzan AU. Histological-subtypes and anatomical location correlated in meningeal brain tumors (meningiomas).J Neurosci Rural Pract. 2014;5(3):244-249.
34. Fathi AR, Roelcke U. Meningioma.Curr Neurol Neurosci Rep. 2013;13(4):337. 35. Barshes N, Demopoulos A, Engelhard HH. Anatomy and physi-ology of the leptomeninges and CSF space. Cancer Treat Res. 2005; 125:1-16.
36. Schick U, Hassler W. Surgical management of tuberculum sellae meningiomas: involvement of the optic canal and visual outcome.J Neurol Neurosurg Psychiatry. 2005;76(7):977-983.
37. DeMonte F. Surgical treatment of anterior basal meningiomas.J Neurooncol. 1996;29(3):239-248.
38. Nanda A, Konar SK, Maiti TK, Bir SC, Guthikonda B. Stratification of predictive factors to assess resectability and surgical outcome in clinoidal menin-gioma.Clin Neurol Neurosurg. 2016;142:31-37.
39. Parizel PM, Carpentier K, Van Marck V, et al. Pneumosinus dilatans in anterior skull base meningiomas.Neuroradiology. 2013;55(3):307-311.
40. Pieper DR, Al-Mefty O, Hanada Y, Buechner D. Hyperostosis associated with meningioma of the cranial base: secondary changes or tumor invasion. Neuro-surgery. 1999;44(4):742-746; discussion 746-747.
41. Rokni-Yazdi H, Sotoudeh H. Prevalence of "dural tail sign" in patients with different intracranial pathologies.Eur J Radiol. 2006;60(1):42-45.
42. Goldsher D, Litt AW, Pinto RS, Bannon KR, Kricheff II. Dural "tail" associated with meningiomas on Gd-DTPA-enhanced MR images: character-istics, differential diagnostic value, and possible implications for treatment. Radiology. 1990;176(2):447-450.
43. Schwyzer L, Berberat J, Remonda L, Roelcke U. Susceptibility changes in meningiomas influence the apparent diffusion coefficient in diffusion-weighted MRI.J Neuroradiol. 2015;42(6):332-337.
44. Fernandez-Miranda JC, Gardner PA, Snyderman CH, et al. Craniopharyn-gioma: a pathologic, clinical, and surgical review.Head Neck. 2012;34(7):1036-1044.
45. Zada G, Lin N, Ojerholm E, Ramkissoon S, Laws ER. Craniopharyngioma and other cystic epithelial lesions of the sellar region: a review of clinical, imaging, and histopathological relationships.Neurosurg Focus. 2010;28(4):E4.
46. Muller HL. Craniopharyngioma.Endocr Rev. 2014;35(3):513-543.
47. Bunin GR, Surawicz TS, Witman PA, Preston-Martin S, Davis F, Bruner JM. The descriptive epidemiology of craniopharyngioma.J Neurosurg. 1998;89(4):547-551.
48. Ostrom QT, de Blank PM, Kruchko C, et al. Alex’s Lemonade Stand Foundation: infant and childhood primary brain and central nervous system tumors diagnosed in the United States in 2007-2011.Neuro oncol. 2015;16(suppl 10):x1-x36.
49. Lee HJ, Wu CC, Wu HM, et al. Pretreatment diagnosis of suprasellar papillary craniopharyngioma and germ cell tumors of adult patients.Am J Neuroradiol. 2015;36(3):508-517.
50. Almefty K, Pravdenkova S, Colli BO, Al-Mefty O, Gokden M. Chordoma and chondrosarcoma: similar, but quite different, skull base tumors.Cancer. 2007;110(11):2457-2467.
51. Fernandez-Miranda JC, Gardner PA, Snyderman CH, et al. Clival chordomas: a pathological, surgical, and radiotherapeutic review.Head Neck. 2014;36(6):892-906.
52. Jahangiri A, Jian B, Miller L, El-Sayed IH, Aghi MK. Skull base chordomas: clinical features, prognostic factors, and therapeutics.Neurosurg Clin N Am. 2013;24(1):79-88.
53. Erdem E, Angtuaco EC, Van Hemert R, Park JS, Al-Mefty O. Comprehensive review of intracranial chordoma.Radiographics. 2003;23(4):995-1009. 54. Sze G, Uichanco LS, 3rd, Brant-Zawadzki MN, et al. Chordomas: MR imaging.
Radiology. 1988;166(1 Pt 1):187-191.
55. Meyers SP, Jr Hirsch WL, Curtin HD, Barnes L, Sekhar LN, Sen C. Chordomas of the skull base: MR features.Am J Neuroradiol. 1992;13(6):1627-1636.
56. Choi D, Gleeson M. Surgery for chordomas of the craniocervical junction: lessons learned.Skull Base. 2010;20(1):41-45.
57. Van Gompel JJ, Janus JR. Chordoma and chondrosarcoma.Otolaryngol Clin North Am. 2015;48(3):501-514.
58. Bloch O, Parsa AT. Skull base chondrosarcoma: evidence-based treatment paradigms.Neurosurg Clin N Am. 2013;24(1):89-96.
59. Aprile I, Scott CA, Cervesato D, Beltrami CA, Meo A, Fabris G. Two rare lumbar tumours with unusual MRI characteristics.Neuroradiology. 2000;42(6):458-461.
60. Bloch OG, Jian BJ, Yang I, et al. Cranial chondrosarcoma and recurrence.Skull Base. 2010;20(3):149-156.
61. Lustig LR, Sciubba J, Holliday MJ. Chondrosarcomas of the skull base and temporal bone.J Laryngol Otol. 2007;121(8):725-735.
62. Lee YY, Van Tassel P. Craniofacial chondrosarcomas: imaging findings in 15 untreated cases.Am J Neuroradiol. 1989;10(1):165-170.
63. Yeom KW, Lober RM, Mobley BC, et al. Diffusion-weighted MRI: distinction of skull base chordoma from chondrosarcoma.Am J Neuroradiol. 2013;34(5):1056-1061, S1051.
64. Chowdhury FH, Haque MR, Kawsar KA, Sarker MH, Hasan M, Goel AH. Intracranial nonvestibular neurinomas: young neurosurgeons’ experience.J Neurosci Rural Pract. 2014;5(3):231-243.
65. MacNally SP, Rutherford SA, Ramsden RT, Evans DG, King AT. Trigeminal schwannomas.Br J Neurosurg. 2008;22(6):729-738.
66. Zhang L, Yang Y, Xu S, Wang J, Liu Y, Zhu S. Trigeminal schwannomas: a report of 42 cases and review of the relevant surgical approaches.Clin Neurol Neurosurg. 2009;111(3):261-269.
67. Liu XD, Xu QW, Che XM, Yang DL. Trigeminal neurinomas: clinical features and surgical experience in 84 patients.Neurosurg Rev. 2009;32(4):435-444. 68. Buhl R, Barth H, Hugo HH, Mautner VF, Mehdorn HM. Intracranial and
spinal melanotic schwannoma in the same patient.J Neurooncol. 2004;68(3):249-254.
69. Dahlen RT, Johnson CE, Harnsberger HR, et al. CT and MR imaging characteristics of intravestibular lipoma.Am J Neuroradiol. 2002;23(8): 1413-1417.
70. Fried I, Tabori U, Tihan T, Reginald A, Bouffet E. Optic pathway gliomas: a review.CNS Oncol. 2013;2(2):143-159.
71. Dutton JJ. Gliomas of the anterior visual pathway. Surv Ophthalmol. 1994;38(5):427-452.
72. Kornreich L, Blaser S, Schwarz M, et al. Optic pathway glioma: correlation of imaging findings with the presence of neurofibromatosis.Am J Neuroradiol. 2001;22(10):1963-1969.
73. Shamji MF, Benoit BG. Syndromic and sporadic pediatric optic pathway gliomas: review of clinical and histopathological differences and treatment impli-cations.Neurosurg Focus. 2007;23(5):E3.
74. Pepin SM, Lessell S. Anterior visual pathway gliomas: the last 30 years.Semin Ophthalmol. 2006;21(3):117-124.
75. Della Puppa A, Rustemi O, Gioffre G. The rare event of optic-chiasmatic hemor-rhagic low grade glioma in adulthood. Considerations on treatment strategy. Neurol Sci. 2014;35(4):623-625.
76. Echevarria ME, Fangusaro J, Goldman S. Pediatric central nervous system germ cell tumors: a review.Oncologist. 2008;13(6):690-699.
77. Poynter JN, Fonstad R, Tolar J, Spector LG, Ross JA. Incidence of intracranial germ cell tumors by race in the United States, 1992-2010. J Neurooncol. 2014;120(2):381-388.
78. Packer RJ, Cohen BH, Cooney K. Intracranial germ cell tumors.Oncologist. 2000;5(4):312-320.
SELLAR AND PARASELLAR IMAGING
79. Villano JL, Propp JM, Porter KR, et al. Malignant pineal germ-cell tumors: an analysis of cases from three tumor registries.Neuro oncol. 2008;10(2):121-130. 80. Jennings MT, Gelman R, Hochberg F. Intracranial germ-cell tumors: natural
history and pathogenesis.J Neurosurg. 1985;63(2):155-167.
81. Kim DI, Yoon PH, Ryu YH, Jeon P, Hwang GJ. MRI of germinomas arising from the basal ganglia and thalamus.Neuroradiology. 1998;40(8):507-511. 82. Ozelame RV, Shroff M, Wood B, et al. Basal ganglia germinoma in children
with associated ipsilateral cerebral and brain stem hemiatrophy.Pediatr Radiol. 2006;36(4):325-330.
83. Borja MJ, Plaza MJ, Altman N, Saigal G. Conventional and advanced MRI features of pediatric intracranial tumors: supratentorial tumors.Am J Roentgenol. 2013;200(5):W483-503.
84. Kanagaki M, Miki Y, Takahashi JA, et al. MRI and CT findings of neurohy-pophyseal germinoma.Eur J Radiol. 2004;49(3):204-211.
85. Ogiwara H, Tsutsumi Y, Matsuoka K, Kiyotani C, Terashima K, Morota N. Apparent diffusion coefficient of intracranial germ cell tumors.J Neurooncol. 2015;121(3):565-571.
86. Cerase A, Tarantino A, Gozzetti A, et al. Intracranial involvement in plasmacy-tomas and multiple myeloma: a pictorial essay.Neuroradiology. 2008;50(8):665-674.
87. Dimopoulos MA, Moulopoulos LA, Maniatis A, Alexanian R. Solitary plasma-cytoma of bone and asymptomatic multiple myeloma.Blood. 2000;96(6):2037-2044.
88. Wein RO, Popat SR, Doerr TD, Dutcher PO. Plasma cell tumors of the skull base: four case reports and literature review.Skull Base. 2002;12(2):77-86. 89. Gangadhar K, Santhosh D. Radiopathological evaluation of primary malignant
skull tumors: a review.Clin Neurol Neurosurg. 2012;114(7):833-839. 90. Agarwal A. Neuroimaging of plasmacytoma. A pictorial review.Neuroradiol J.
2014;27(4):431-437.
91. Greenberg HS, Deck MD, Vikram B, Chu FC, Posner JB. Metastasis to the base of the skull: clinical findings in 43 patients.Neurology. 1981;31(5):530-537. 92. Laigle-Donadey F, Taillibert S, Martin-Duverneuil N, Hildebrand J, Delattre
JY. Skull-base metastases.J Neurooncol. 2005;75(1):63-69.
93. Pearce JM. The craniospinal venous system.Eur Neurol. 2006;56(2):136-138. 94. Razek AA, Castillo M. Imaging lesions of the cavernous sinus.Am J Neuroradiol.
2009;30(3):444-452.
95. Roh JL, Sung MW, Kim KH, et al. Nasopharyngeal carcinoma with skull base invasion: a necessity of staging subdivision.Am J Otolaryngol. 2004;25(1):26-32. 96. Johnston JL. Parasellar syndromes. Curr Neurol Neurosci Rep. 2002;2(5):
423-431.
97. Ginat DT, Mangla R, Yeaney G, Ekholm S. Diffusion-weighted imaging of skull lesions.J Neurol Surg B Skull Base. 2014;75(3):204-213.
98. Nemeth AJ, Henson JW, Mullins ME, Gonzalez RG, Schaefer PW. Improved detection of skull metastasis with diffusion-weighted MR imaging.Am J Neuro-radiol. 2007;28(6):1088-1092.
99. Habu M, Tokimura H, Hirano H, et al. Pituitary metastases: current practice in Japan.J Neurosurg. 2015;123(4):998-1007.
100. Shrivastava RK, Arginteanu MS, King WA, Post KD. Giant prolactinomas: clinical management and long-term follow up.J Neurosurg. 2002;97(2):299-306. 101. Saeki N, Uchino Y, Murai H, et al. MR imaging study of edema-like change along the optic tract in patients with pituitary region tumors.Am J Neuroradiol. 2003;24(3):336-342.
102. Han SJ, Rolston JD, Jahangiri A, Aghi MK. Rathke’s cleft cysts: review of natural history and surgical outcomes.J Neurooncol. 2014;117(2):197-203. 103. Byun WM, Kim OL, Kim D. MR imaging findings of Rathke’s cleft cysts:
significance of intracystic nodules.Am J Neuroradiol. 2000;21(3):485-488. 104. Nishioka H, Haraoka J, Izawa H, Ikeda Y. Magnetic resonance imaging, clinical
manifestations, and management of Rathke’s cleft cyst.Clin Endocrinol (Oxf ). 2006;64(2):184-188.
105. Bonneville F, Chiras J, Cattin F, Bonneville JF. T2 hypointense signal of rathke cleft cyst.Am J Neuroradiol. 2007;28(3):397.
106. Park M, Lee SK, Choi J, et al. Differentiation between cystic pituitary adenomas and Rathke Cleft Cysts: a diagnostic model using MRI. Am J Neuroradiol. 2015;36(10):1866-1873.
107. Chaiban JT, Abdelmannan D, Cohen M, Selman WR, Arafah BM. Rathke cleft cyst apoplexy: a newly characterized distinct clinical entity.J Neurosurg. 2011;114(2):318-324.
108. Hess CP, Dillon WP. Imaging the pituitary and parasellar region.Neurosurg Clin N Am. 2012;23(4):529-542.
109. Caldarelli M, Massimi L, Kondageski C, Di Rocco C. Intracranial midline dermoid and epidermoid cysts in children. J Neurosurg. 2004;100(5 suppl Pediatrics):473-480.
110. Orakcioglu B, Halatsch ME, Fortunati M, Unterberg A, Yonekawa Y. Intracranial dermoid cysts: variations of radiological and clinical features.Acta Neurochir (Wien). 2008;150(12):1227-1234; discussion 1234.
111. Nagasawa DT, Choy W, Spasic M, et al. An analysis of intracranial epidermoid tumors with malignant transformation: treatment and outcomes.Clin Neurol Neurosurg. 2013;115(7):1071-1078.
112. Timmer FA, Sluzewski M, Treskes M, van Rooij WJ, Teepen JL, Wijnalda D. Chemical analysis of an epidermoid cyst with unusual CT and MR characteristics. Am J Neuroradiol. 1998;19(6):1111-1112.
113. Brown JY, Morokoff AP, Mitchell PJ, Gonzales MF. Unusual imaging appearance of an intracranial dermoid cyst.Am J Neuroradiol. 2001;22(10):1970-1972.
114. Hakyemez B, Aksoy U, Yildiz H, Ergin N. Intracranial epidermoid cysts: diffusion-weighted, FLAIR and conventional MR findings.Eur J Radiol. 2005;54(2):214-220.
115. Santhosh K, Thomas B, Radhakrishnan VV, et al. Diffusion tensor and tensor metrics imaging in intracranial epidermoid cysts. JMRI. 2009;29(4): 967-970.
116. Nagasawa D, Yew A, Safaee M, et al. Clinical characteristics and diagnostic imaging of epidermoid tumors. J Clin Neurosci. 2011;18(9): 1158-1162.
117. Ren X, Lin S, Wang Z, et al. Clinical, radiological, and pathological features of 24 atypical intracranial epidermoid cysts.J Neurosurg. 2012;116(3): 611-621.
118. Hamlat A, Hua ZF, Saikali S, et al. Malignant transformation of intra-cranial epithelial cysts: systematic article review. J Neurooncol. 2005;74(2): 187-194.
119. Rengachary SS, Watanabe I. Ultrastructure and pathogenesis of intracranial arachnoid cysts.J Neuropathol Exp Neurol. 1981;40(1):61-83.
120. Al-Holou WN, Yew AY, Boomsaad ZE, Garton HJ, Muraszko KM, Maher CO. Prevalence and natural history of arachnoid cysts in children.J Neurosurg. Pediat. 2010;5(6):578-585.
121. Al-Holou WN, Terman S, Kilburg C, Garton HJ, Muraszko KM, Maher CO. Prevalence and natural history of arachnoid cysts in adults.J Neurosurg. 2013;118(2):222-231.
122. Cincu R, Agrawal A, Eiras J. Intracranial arachnoid cysts: current concepts and treatment alternatives.Clin Neurol Neurosurg. 2007;109(10):837-843. 123. Yildiz H, Erdogan C, Yalcin R, et al. Evaluation of communication between
intracranial arachnoid cysts and cisterns with phase-contrast cine MR imaging. Am J Neuroradiol. 2005;26(1):145-151.
124. Algin O, Hakyemez B, Gokalp G, Korfali E, Parlak M. Phase-contrast cine MRI versus MR cisternography on the evaluation of the communication between intra-ventricular arachnoid cysts and neighbouring cerebrospinal fluid spaces. Neurora-diology. 2009;51(5):305-312.
125. Awaji M, Okamoto K, Nishiyama K. Magnetic resonance cisternography for preoperative evaluation of arachnoid cysts.Neuroradiology. 2007;49(9):721-726. 126. Osborn AG, Preece MT. Intracranial cysts: radiologic-pathologic correlation and
imaging approach.Radiology. 2006;239(3):650-664.
127. Maixner W. Hypothalamic hamartomas–clinical, neuropathological and surgical aspects.Childs Nerv Syst. 2006;22(8):867-873.
128. Amstutz DR, Coons SW, Kerrigan JF, Rekate HL, Heiserman JE. Hypotha-lamic hamartomas: correlation of MR imaging and spectroscopic findings with tumor glial content.Am J Neuroradiol. 2006;27(4):794-798.
129. Mittal S, Mittal M, Montes JL, Farmer JP, Andermann F. Hypothalamic hamartomas. Part 1. Clinical, neuroimaging, and neurophysiological character-istics.Neurosurg Focus. 2013;34(6):E6.
130. Arita K, Ikawa F, Kurisu K, et al. The relationship between magnetic resonance imaging findings and clinical manifestations of hypothalamic hamartoma. J Neurosurg. 1999;91(2):212-220.
131. Bonneville F, Sourour N, Biondi A. Intracranial aneurysms: an overview. Neuroimaging Clin N Am. 2006;16(3):371-382, vii.
132. Choi IS, David C. Giant intracranial aneurysms: development, clinical presen-tation and treatment.Eur J Radiol. 2003;46(3):178-194.
133. Fisher A, Som PM, Mosesson RE, Lidov M, Liu TH. Giant intracranial aneurysms with skull base erosion and extracranial masses: CT and MR findings. J Comput Assist Tomogr. 1994;18(6):939-942.