Vol.8 (2018) No. 1
ISSN: 2088-5334
User Acceptance Analysis of Potato Expert System
Application Based on TAM Approach
Taufiq Rachman
#, Darmawan Napitupulu
* #Management Department, Faculty of Economic, Indonesia Prima University, 20118 Medan, Indonesia E-mail: [email protected]
*
Research Center for Quality System and Testing Technology, Indonesian Institute of Sciences, 15314 Tangsel, Indonesia E-mail: [email protected]
Abstract— This study aims to determine the level of user acceptance of the application of potato expert system in the diagnosis of
plant pests and diseases based on Android that has been developed. The application of an expert system is intended to help farmers and extension workers in particular to identify types of plant pests and diseases based on symptoms that appear and control solutions easily, quickly and accurately. In this study, the effects of perceived ease of use and the perceived usefulness on behavioural intention to use based on the perspective of farmers and extension workers in the field were measured. The method used in this study is a survey with Technology Acceptance Model (TAM) with the total respondents of 204. The results showed the perceived ease of use has a positive correlation with behavioural intention to use; perceived usefulness has a positive correlation with behavioural intention to use, and both perceived ease of use and perceived usefulness have a positive correlation with behavioural intention to use.
Keywords— User acceptance; TAM; ease of use; usefulness; potato; expert system
I. INTRODUCTION
Potato is not the staple food of Indonesians, but the consumption of potatoes in Indonesia cannot be underestimated. The national production in 2014 increased by 8.79% but decreased by 12.20% in 2015. The production centers in Central Java, West Java, East Java, South Sumatra and North Sumatra have no significant increase or even decrease. The increase of national production was only in Aceh and Jambi province in 2014 [1].
From year to year, the demand for this commodity always increases, because it is supported by many food products made of potatoes. Increasing population and also the number of foreign tourists has roles in raising the consumption of potatoes. The number of factories which produce snack for children which use potatoes as a raw material is also increased.
Potato horticultural commodity is one of the commodities that is safe from turmoil. However, it is necessary for optimal potato cultivation. One of the obstacles in the cultivation of the potato crop encountered in the field is related to pest and disease control. Losses suffered by potato farmers especially due to late diagnosis of pests and diseases in their agricultural until it reached the severe stage which often leads to crop failure. In general, pests and diseases in every plant, before reaching the severe stage, showing
symptoms but still in light stage and little in number. But farmers often ignore these symptoms because of ignorance or lack of information they have, until the symptoms are getting severe and pervasive that it is too late to control. The conditions of minimal knowledge, as well as minimal information of control solutions for types of pest and disease, make farmers are not able to perform optimal cultivation. To access the information from a person considered as an expert of potato crop is sometimes difficult and takes a long time considering the remote location and not to mention that it requires a relatively high cost. Though pest and disease management should be performed as soon as possible so that the possibility of crop failure can be avoided.
application anytime and anywhere. Data Plus cellular phone users in Indonesia in 2015 had reached 300 million people beyond the number of internet users that only 70 million people.
In general, the expert system is trying to adopt a system of human knowledge in computers designed for modeling ability to solve problems like an expert. With this expert system, people can solve problems or look for the actual quality information which usually can only be obtained with the help of experts. With the application of the expert system, potato farmers expected to know what types of pests and diseases and the control solutions that will be able to reduce or minimize the risk of crop failure.
However, the fundamental question is whether farmers want to use expert system applications that have been developed or not? Or in other words how the acceptance of farmers to technology in the form of expert system application that has been developed? This needs to be reviewed based on the observation considering that not all farmers are accustomed to using android technology . Also, there are farmers who do not have adequate means of Android-based mobile phone and internet connections. Therefore, research is needed to answer questions related to the acceptance of the developed application that can be used by users, in this case, farmers or agricultural extension workers, in the field. This study aims to examine whether the application of expert system developed can be accepted by users or not. According to Jogiyanto (2007), users of the technology will have the behavioural intention of using the technology if the technology is helpful and easy to use [2]. Technology Acceptance Model (TAM) identifies two key factors for individual approval to technologies, i.e., benefit, and ease of use. This study aims to determine the correlation between perceived usefulness and perceived ease of use with behavioural intention to use. It is also very useful for predicting the success of an expert system application that has been developed. Thus, there are three research questions that can be formulated, whether the perceived usefulness has a positive correlation with behavioural intention to use; whether perceived ease of use has a positive correlation with behavioural intention to use and whether both perceived usefulness and perceived ease of use positively correlated with behavioural intention to use. Those three research questions are underlying this research, especially related to the level of user acceptance of the technology expert system.
II. MATERIALS AND METHOD
Based on the perspective of information systems research, there have been several theories put forward about the correlation between factors affect the acceptance of the technology. Most of these factors are related to user attitudes, perceptions, beliefs and actual use of the system. Theories or models such as TPB (Theory of Planned Behaviour), the theory of DOI (diffusion of innovations), UTAUT (the unified theory of acceptance and use of technology), a model of success information systems by DeLone & McLean and user satisfaction measurement. Those theories are quite popular to use in the context of the acceptance of the technology. However, most of the models or theories focus more on technical factors [3].
Technology acceptance model (TAM) is a theory or model which is widely used in the field of information systems, especially for measuring technology acceptance and its high validity had been demonstrated empirically in studies or research [3], [4], [5], [6]. In other words, TAM model has been tested to measure the acceptance of the technology based on user perception. TAM model has been used in various fields of information systems such as e-learning, e-library, e-government, e-commerce, etc. Sensuse explores the level of user acceptance from the perspective of students using TAM Model in the context of e-learning [7]. In the field of e-library, Thong examines the factors affect the acceptance of digital libraries. According to Thong, one's acceptance of digital library technology affects the level of utilization in the future [8]. Almost equal to previous research [8], Kim applies TAM to examine the factors that influence user acceptance of online database of electronic journals provided by library [9]. Also in the field of e-Government, Napitupulu developed the conceptual model of user adoption on the behavioral intention among government officials in the use of e-government system with TAM approach in Indonesia [10]. The result stated that TAM model could be used in the context of e-Government considering that e-Government is also part of the information system. Also in the field of e-commerce, TAM model has also been used extensively. One of the studies conducted by Devi & Suartana who conducted an analysis of TAM on the use of information systems in the Nusa Dua Beach Hotel [11]. User acceptance of information systems is influenced by two main factors, namely perceived ease of use, and perceived usefulness.
Although TAM has been widely used in various fields of information systems, but the use of TAM model on the measurement of user acceptance of the expert systems application is still very rare, especially in the diagnosis of plant pests and diseases of potato and the control solutions. Technology in the form of expert system application that has been developed used to determine the level of acceptance by users, in this regard farmers and extension workers, so it can predict their utilization.
TAM model developed by Davis consists of five constructs namely perceived ease of use, perceived usefulness, attitude towards the use, behavioural intention to use and behaviour of the actual system [12]. But in its development TAM models are modified, for example, researches conducted Venkatesh & Davis and Chuttur suggest that the construct or variable of attitude toward the use is empirically removed because the variable cannot mediate the effect of the perception of the benefit on behavioral intention to use [13], [14] Other research like Gahtani modified TAM model by combining variable of behavioural intention to use the actual system into the construct of acceptance [15]. By following the previous study conducted by Napitupulu et al., the conceptual model proposed in the study is as follows [16]:
Fig. 1 Conceptual research model [12]
Based on the conceptual model of the research above, the authors take a series of hypotheses tested, they are:
• H1: Perceived usefulness has a positive correlation with behavioural intention to use
• H2: Perceived ease of use has a positive correlation with behavioural Intention to use
• H3: Both perceived usefulness and perceived ease of use positively correlated with behavioural intention to use
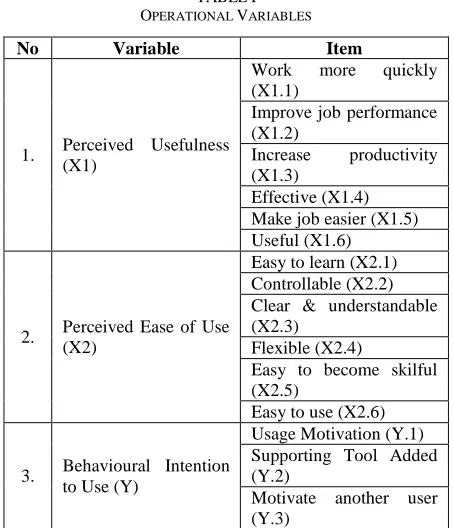
Operational variables in this study consist of the perceived usefulness which has 6 items/indicators, perceived ease of use which has 6 items/ indicators, and behavioural intention to use which has 3 items (Davis, 1989) are presented in Table 1 [12].
Hypothesis testing in this study using multiple regression analysis based on the functional relationship or causal of two or more predictor variables with one criterion variable. Predictor variables, in this case, are perceived usefulness and perceived ease of use while the criterion variable in this study is behavioural intention to use. The relationship between the predictor variables and the criterion variable in linear equations can be written as follows:
Y = a + b1X1 + b2X2 + e (1) where
Y = Behavioural intention to use
a = Direct relationship between predictor and criterion variable
b1 = Coefficient of perceived usefulness on behavioural intention to use
b2 = Coefficient of perceived ease of use on behavioural intention to use
e = Residual error
TABLEI OPERATIONAL VARIABLES
No Variable Item
1. Perceived Usefulness (X1)
Work more quickly
(X1.1)
Improve job performance (X1.2)
Increase productivity (X1.3)
Effective (X1.4) Make job easier (X1.5) Useful (X1.6)
2. Perceived Ease of Use (X2)
Easy to learn (X2.1) Controllable (X2.2) Clear & understandable (X2.3)
Flexible (X2.4)
Easy to become skilful (X2.5)
Easy to use (X2.6)
3. Behavioural Intention to Use (Y)
Usage Motivation (Y.1) Supporting Tool Added (Y.2)
Motivate another user (Y.3)
In order to do tests on the regression equation, firstly, the test of classic assumptions was performed. This test includes the non-occurrence of multicollinearity between the independent variables, the absence of heteroskedasticity, and autocorrelation between the residuals of each independent variable.
III.RESULTS AND DISCUSSION
A. Validity and Reliability Testing
Based on the results of data collection to 215 respondents, only 204 questionnaires that can be used for further analysis. Since there were 204 questionnaires completed by respondents so that no data was missing. Incomplete questionnaires showed inaccuracy or lack of seriousness of respondents and excluded for the next stage of analysis. Before the data was processed and the results of the questionnaire were analysed, firstly, the validity and reliability testing of the questionnaire was needed to perform to find out whether the questionnaire as a research instrument can measure the data accurately and consistently. The criteria of validity testing of the questionnaire in this study are based on instrument validity index value rcount (corrected item-total correlation), whereas if rcount is greater than rtable then it can be said to be valid [17].
TABLEII
RESULT OF RELIABILITY TESTING
No Variable Cronbach Alpha
1. Perceived ease of use 0.758
2. Perceived usefulness 0.799
3. Behavioural intention to use 0.739
Based on Table 2 above, it can be seen that the variables of research namely to behavioural intention to use, usefulness and ease of use reliably meet the elements. This is evidenced by Cronbach alpha values for behavioural intention to use of 0.6419, the convenience of 0.8704 and benefits of the use of 0.8021. Results of Cronbach's alpha is greater than 0.60 as a requirement that the instrument can be said to be reliable.
Table 3 shown below indicated that all indicators or measurement items have values greater than rtable where rtable for 204 respondents is 0.396. Thus, the overall indicators/ measurement items are valid because they have met the requirements (> 0.396).
TABLEIII RESULT OF VALIDITY TESTING
B. Descriptive Statistical Analysis
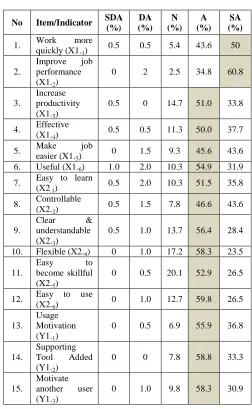
Based on the results of questionnaires that have been processed, descriptive statistics were obtained and presented in Table 4 below where the respondents’ answers can be seen for each item or indicator measurement, frequency responses of strongly agree (SA) and agree (A) have high percentage compared to other answer options. For example, as the item / indicator of "work more quickly" (X1.1) has 50% of respondents strongly agreed (SA), 43% of respondents agree (A) and the remaining 5.4% answered undecided (N), 0.5% of respondents answered disagree (DA) and only 0.5% answered strongly disagree (SDA). This indicates that the application of expert system developed thought to help speed up the completion of the work performed. Likewise, for the item / indicator "easy to use" (X2.6) it can be seen that as many as 59.8% of respondents agree (A) and 26.5% of respondents strongly agreed (SA) while the remaining 12.7% answered undecided (R) and only 1% who answered disagree (DA).
TABLEIV DESCRIPTIVE ANALYSIS
It means that general respondents, in this case, the farmer/extension worker, considered that the application of the expert system is easy to use or operate. This also applies to items or indicators of other measurements. Thus, the results of frequency analysis of responses can be said the majority of the perception of respondents agree that the application of expert system developed is helpful (perceived usefulness) and easy to use (perceived ease of use). Perceptions of the respondents also indicate that the majority of respondents agreed with the behavioural intention to use.
In addition, based on the frequency or distribution of respondents, we also can see descriptive statistics numeric form of the mean value (Mean) to see the level of agreement whereby if the average value (Mean) > 4 then it means that respondents agree with a variable but on the contrary if the average value (Mean) <4 then it means that respondents do not agree with a variable, as shown in Table 5.
Based on Table 5, it can be seen from descriptive statistics numerically that for the variable of perceived usefulness, respondents have range answers between 2.83 to 5.0 produced the average value (Mean) of 4.3072 (>4) so that it can be said the respondents agreed that the application developed fulfilling the beneficial aspects. For the variable
No Item/Indicator
Corrected Item-Total Correlation
(rcount)
1. Work more quickly (X1.1) 0.410
2. Improve job performance (X1.2) 0.424
3. Increase productivity (X1.3) 0.581
4. Effective (X1.4) 0.536
5. Make job easier (X1.5) 0.566
6. Useful (X1.6) 0.527
7. Easy to learn (X2.1) 0.541
8. Controllable (X2.2) 0.584
9. Clear & understandable (X2.3) 0.432
10. Flexible (X2.4) 0.627
11. Easy to become skillful (X2.5) 0.624
12. Easy to use (X2.6) 0.506
13. Usage Motivation (Y1.1) 0.580
14. Supporting Tool Added (Y1.2) 0.546
15. Motivate another user (Y1.3) 0.615
No Item/Indicator SDA (%)
DA (%)
N (%)
A (%)
SA (%)
1. Work more
quickly (X1.1)
0.5 0.5 5.4 43.6 50
2.
Improve job performance (X1.2)
0 2 2.5 34.8 60.8
3.
Increase productivity (X1.3)
0.5 0 14.7 51.0 33.8
4. Effective (X1.4)
0.5 0.5 11.3 50.0 37.7
5. Make job
easier (X1.5)
0 1.5 9.3 45.6 43.6
6. Useful (X1.6) 1.0 2.0 10.3 54.9 31.9
7. Easy to learn (X2.1)
0.5 2.0 10.3 51.5 35.8
8. Controllable (X2.2)
0.5 1.5 7.8 46.6 43.6
9.
Clear & understandable (X2.3)
0.5 1.0 13.7 56.4 28.4
10. Flexible (X2.4) 0 1.0 17.2 58.3 23.5
11.
Easy to
become skillful (X2.5)
0 0.5 20.1 52.9 26.5
12. Easy to use (X2.6)
0 1.0 12.7 59.8 26.5
13.
Usage Motivation (Y1.1)
0 0.5 6.9 55.9 36.8
14.
Supporting
Tool Added
(Y1.2)
0 0 7.8 58.8 33.3
15.
Motivate another user (Y1.3)
of perceived ease of use, respondents have a range of answers between 2.50 to 5.00 produced average value (Mean) of 4.1405(>4). Thus, it can be said respondents agreed to the ease of use of the developed application. As for behavioural intention to use, the respondents have a range of answers between 2.33 to 5.00 produced the average value (Mean) of 4.2451 so respondents agreed with the behavioural intention to use of the application.
TABLEV
NUMERICAL STATISTICAL DESCRIPTIVE
C. Hypotheses Analysis
Hypotheses testing in this study was conducted by multiple linear regression analysis which aims to determine the correlation of two predictor variables of research namely perceived ease of use and perceived usefulness with variable criterion namely behavioural intention to use.
Thus, there are three hypotheses to be tested in this study: first, whether the perceived usefulness has a positive correlation with behavioural intention to use; second, whether the perceived ease of use has a positive correlation with behavioural intention to use; and third, whether both perceived usefulness and perceived ease of use positively correlated with behavioural intention to use.
The hypotheses were tested through a series of processes ranging from the test regression equations, simultaneous parameter test (F-test), individual parameter test (t-test) and the coefficient of determination (R2) test which can be shown as follows:
TABLEVI
RESULT OF MULTIPLE REGRESSION
Model
Unstandardized
Coefficients t Sig. B Std. Error
1
(Constant) .981 .252 3.900 .000
Perceived
Usefulness .370 .067 5.517 .000
Perceived Ease of
Use .403 .066 6.119 .000
Based on table 6 above, the equation of multiple linear regression is as follows:
Y = 0.981 + 0.370X1 + 0.403X2 (2)
The above equation can be explained as follows:
1) Constant value of 0.981 indicates if the perceived usefulness and perceived ease of use is equal to zero, then the value of behavioural intention increased by 0.981 units
2) Perceived usefulness has a regression coefficient with a positive direction of 0.370 indicates if the value of the perceived usefulness increased by 1 unit, then the value of behavioural intention will be increased by 0.370 units.
3) Perceived ease of use has a regression coefficient of 0.403 with a positive direction, so if the value of perceived
ease of use incremented by 1 unit, then the behavioural intention will increase by 0.403 units.
In addition, from Table 6 above, the results of the parameters individual test (t-test) indicates the probability of significance for perceived usefulness of 0.000 (less than 0.05) and the t value of 5.517 (greater than ttable) with a regression coefficient of 0.370 (positive). This means that the first hypothesis (H1) stated that the perceived usefulness has a positive correlation with behavioural intention can be supported because it has met the requirements. As for variable of the perceived ease of use it also has a probability of significance of 0.000 (less than 0.05) and the t value of 6.119 (greater than ttable) with a regression coefficient of 0.403 (positive). This means that the second hypothesis (H2) stated that the perceived ease of use has a positive correlation with behavioural intention to use can be accepted.
TABLEVII
RESULT OF SIMULTANEOUS PARAMETER TESTING BY ANOVA
Model Sum of Squares df
Mean
Square F Sig.
1 Regression 23.204 2 11.602 85.712 .000b
Residual 27.208 201 .135
Total 50.412 203
a. Dependent Variable: Behavioural Intention to Use b. Predictors: (Constant), Ease of Use, Usefulness
The results of the simultaneous parameter (F-test) to determine the effect that benefits both predictor variables of perceived usefulness and perceived ease of use to the dependent variable, behavioural intention to use.
Based on Table 7 above, it can be seen that the Fcount value is 85.712 with significance probability of 0.000. Therefore, the probability of significance is much smaller than 0.05 (5%) it can be concluded that the third hypotheses (H3) are also acceptable where both variables of perceived usefulness and perceived ease of use have a positive correlation with the variable of behavioural intention to use.
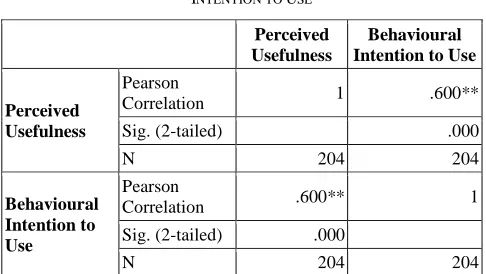
Besides, analysing the correlation between the predictor variables with criterion variables that can be presented in Table 8 and Table 9.
TABLEVIII
CORRELATION OF PERCEIVED USEFULNESS AND BEHAVIOURAL INTENTION TO USE
Perceived Usefulness
Behavioural Intention to Use
Perceived Usefulness
Pearson
Correlation 1 .600**
Sig. (2-tailed) .000
N 204 204
Behavioural Intention to Use
Pearson
Correlation .600** 1
Sig. (2-tailed) .000
N 204 204
**. Correlation is significant at the 0.01 level (2-tailed).
Variable N Minim Max Mean
PU 204 2.83 5.00 4.3072
PEOU 204 2.50 5.00 4.1405
TABLEIX
CORRELATION OF PERCEIVED EASE OF USE AND BEHAVIOURAL INTENTION TO USE
Perceived Ease of Use
Behavioural Intention to Use
Perceived Ease of Use
Pearson
Correlation 1 .615**
Sig. (2-tailed) .000
N 204 204
Behavioural Intention to Use
Pearson
Correlation .615** 1
Sig. (2-tailed) .000
N 204 204
**. Correlation is significant at the 0.01 level (2-tailed).
From the hypotheses result, it can be said that the perceived usefulness has significantly influenced the behavioural intention to use. In the context of the expert system, the farmers and extension workers gained the benefit of using the application. They could get faster and easier information about the disease and pest of potato plants. Thus, finally, they have the intention to use the application. Meanwhile, the perceived ease of use has also influenced the behavioural intention to use significantly. The farmers and extension workers perceived that the application is easy to learn and to operate. The user interface design is simple and suitable to their needs. Thus, they have no much effort to use the applications.
According to the table 8, it can be seen that the variable of benefits has a correlation coefficient of 0.600 with 0.000 significance (<0.05) so it can be said that the variable of benefits has a strong correlation with behavioural intention to use. Likewise, in Table 9 it can be seen that correlation coefficients for the that perceived variable o ease of use obtained are 0..615 with 0.000 significance (<0.05), so the conclusion is that the variable of ease of use also has a strong correlation with behavioural intention to use.
TABLEX
THE RESULT OF DETERMINATION COEFFICIENT
Model R R Square Adjusted R Square
Std. Error of the Estimate
1 .678a .460 .455 .36791
Based on Table 10 it can be seen that the value of Adjusted R Square (R2) is approximately 0.455. This may imply that 45.5% of the variation of determination coefficient of behavioural intention to use can be explained by the perceived usefulness and perceived ease of use. While the rest of 54.5% is explained by other variables that are not included in the model.
IV.CONCLUSIONS
Based on research that has been done, some conclusions drawn are as follows:
1) The First Hypotheses (H1): can be supported by the analysis where the variable of perceived usefulness turned out to have a correlation with behavioural intention to use. It can be shown from the results of the t-test with the
significance of 0.000 with a regression coefficient which is equal to 0.370.
2) The Second Hypotheses (H2): can be supported by the
analysis where the variable of perceived ease of use is also correlated with behavioural intention to use. It can be shown from the results of the t-test with the significance of 0.000 with a regression coefficient which is equal to 0.403.
3) The Third Hypotheses (H3): can be supported by the analysis where both variables of perceived usefulness and perceived ease of use are correlated with behavioural intention to use. It can be shown from the results of the F test with the significance of 0.000.
4) The Linear Regression Model: is useful in predicting the overall variation of the variable of behavioural intention to use. Based on the test results, it is indicated that variation of determination coefficient of behavioural intention to use of 45.5% can be explained by two variables, namely variables of perceived usefulness and perceived ease of use.
5) Based on the Analysis: the users – in this case, farmers/extension workers – considered that the expert system application developed is very useful and easy to use so as to encourage interest in using the application. Thus, in turn, it can increase the level of use and utilization of expert system application technology in diagnosing pests and diseases in potato plant based on android widely, especially to support the cultivation of the potato crop in Indonesia.
6) Based on the Results of Coefficient Determination Test: it showed that only 45.5% contribution from both predictor variables to explain the criterion variable, behavioural intention to use. Thus, there are 54.5% more influential variables outside the model. Suggestion for further studies is to look for variables or factors other than the model which also have a correlation with behavioural intention to use.
ACKNOWLEDGMENT
We would like to thank all participants who involved in the development and improvement of the expert system and also to the institution that always supported the research that had been conducted.
REFERENCES
[1] BPS and Hortikultura, “Luas Panen Kentang Menurut Provinsi 2011-2015,” Retrieved from: http://www.pertanian.go.id/Data5tahun/pdf-HORTI2016/1.1-LPanen%20Kentang.pdf , 2015.
[2] Jogiyanto., “Sistem Informasi Keperilakukan,” Yogyakarta : Andi, Edisi 1, 2007.
[3] K. Al-Busaidi and H. Al-Shihi, “Instructors Acceptance of Learning Management Systems: A Theoretical Framework,” Communications of the IBIMA, 2010.
[4] Q, Ma and L. Liu, “The Technology Acceptance Model: A Meta-Analysis of Empirical Findings,” Journal of Organizational and End User Computing (JOEUC), 16, 59-72, 2004.
[5] D. Kim and H. Chang, “Key Functional Characteristics In Designing and Operating Health Information Websites for User Satisfaction: An application of the extended technology acceptance model,” International Journal of Medical Informatics, 76, 790-800. 2007. [6] J. Moon and Y. Kim, “Extending the TAM for a World-Wide-Web
context,” Information & Management, 38, 217-230, 2001.
[7] D.I. Sensuse and D. Napitupulu, “The Study of User Acceptance Toward e-Learning System in Higher Education,” International Journal of Electrical Engineering and Computer Science, 7(2), 466-473, 2017.
Individual Differences and System Characteristics,” Journal of Management Information Systems. 18(3), 97-124, 2004.
[9] J. Kim, “User Acceptance of Web-based Subscription Database,” Dissertation of Doctor, Tallahassee Florida: Information Studies Department Florida State University, 2005.
[10] G. Putra, “Kajian Minat Berperilaku Aparatur Pemerintah Kota Dalam Menggunakan E-Government: Aplikasi Technology Acceptance Model (TAM),” National Conference on Management Research, 1-15, 2008.
[11] D. Napitupulu, “A Conceptual Model of e-Government Adoption in Indonesia, “ International Journal on Advanced Science, Engineering and Information Technology, 7(4), 1471-1478, 2017.
[12] F.D. Davis, “Perceived Usefulness, Perceived Ease of Use, and User Acceptance of Information Technology,” MIS Quarterly, 13(3), 319-339, 1989.
[13] V. Venkatesh and F.D. Davis, “A Model of the Perceived Ease of Use Development and Test,” Decision Sciences, 27(3), 451-481, 1996.
[14] M. Chuttur, “Overview of The Technology Acceptance Model: Origins, Developments and Future Directions,” Sprouts, Working Papers on Information Systems, 9(37), 2009.
[15] S.A. Gahtani, “The Applicability of TAM Outside North America: An Empirical Test in United Kingdom,” Information Resource Management Journal, 14(3), 37-46, 2001.
[16] D. Napitupulu, J.A. Kadar and R.K. Jati, Validity Testing of Technology Acceptance Model Based on Factor Analysis Approach. Indonesian Journal of Electrical Engineering and Computer Science, 5(3), 697-704, 2017.
[17] S. Azwar, “Reliabilitas and validity,” Yogyakarta: Pustaka Pelajar, 2012.