ORGANIC MATTER DEGRADATION BY MICROBIAL COMMUNITIES IN FRESHWATER AND MARINE SYSTEMS
Avery Katherine Bullock
A thesis submitted to the faculty at the University of North Carolina at Chapel Hill in partial fulfillment of the requirements for the degree of Master of Science in the Marine Sciences
Department.
Chapel Hill 2014
© 2014
ABSTRACT
Avery Katherine Bullock: Organic Matter Degradation by Microbial Communities in Freshwater and Marine Systems
(Under the direction of Carol Arnosti)
Organic matter in freshwater and marine systems exists in many of sizes and structures. It is introduced into these systems by autochthonous production or allochthonous input via
groundwater, terrestrial run-off, and estuarine mixing. Organic matter is an important source of organic carbon and nutrients to the heterotrophic microbial community, but microbial
ACKNOWLEDGEMENTS
TABLE OF CONTENTS
LIST OF TABLES………...…viii
LIST OF FIGURES………ix
CHAPTER 1: A MULTI-SEASON INVESTIGATION OF MICROBIAL COMMUNITY ACTIVITIES IN THE NEUSE AND TAR-PAMLICO RIVERS………...1
Introduction………...1
Methods……….3
Study Site……….3
Sample Collection………4
Extracellular Enzyme Activities………..4
Bacterial Cell Counts and Production………..7
Dissolved Organic Carbon………...7
Statistical Analysis………...8
Results………...9
Environmental and hydrological characteristics………..9
Microbial cell counts and leucine incorporation data………10
Activities of polysaccharide-hydrolyzing enzymes………...11
Activities of glucosidase, peptidase, and phosphatase in the Neuse River………..12
Overview………17
Trends in Microbial Community Activities………...18
Seasonal and Spatial Patterns in Microbial Composition and Activities……….20
Upstream and Downstream Connectivity………..23
Impacts of Hurricane Irene………24
Conclusion……….25
Figures……….26
CHAPTER 2: CONTRASTING RATES AND PATTERNS OF ORGANIC MATTER DEGRADATION BY MICROBIAL COMMUNITIES IN THE COASTAL NORTH ATLANTIC……….49
Introduction……….49
Methods………...51
Study Sites & Sample Collection………...51
Sample Filtration………52
Measurements of Extracellular Enzyme Activities………52
Bacterial Cell Counts and Bacterial Protein Production………55
Dissolved Organic Carbon & Total Dissolved Carbohydrate Analyses………..55
Results……….56
Station Environment………..56
DOC and Total Dissolved Carbohydrates……….57
Discussion………...63
Organic Carbon and Nutrient Degradation Patterns………..63
Conclusions………68
Figures……….69
Table 1 (a-b): Temperature, DO (dissolved oxygen), pH, salinity, TSS (total suspended solids), gage height, and discharge data for each month sampled from the Neuse (a)
and Tar-Pamlico (b) Rivers.………...27
Table 2: Dissolved organic carbon (DOC) and total dissolved
carbohydrate (TCHO) concentrations for Hatteras Cruise………71
Table 3: Bacterial protein production, total glucosidase hydrolysis, leucine aminopeptidase hydrolysis, and phosphatase hydrolysis normalized to per-cell values for each station and depth (all values x 10-8
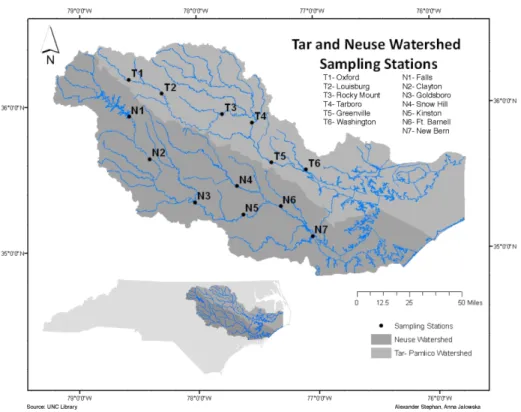
Figure 1: Map depicting the sampling stations on the Neuse and
Tar-Pamlico Rivers………26
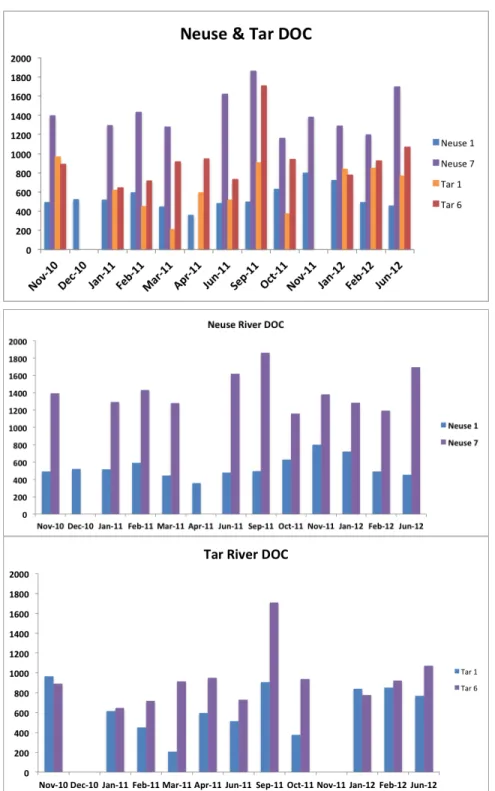
Figure 2 (a-c): Dissolved organic carbon data from the upstream and downstream stations in the Neuse and Tar-Pamlico Rivers………28
Figure 3 (a-b): River discharge for the Tar-Pamlico river……….29
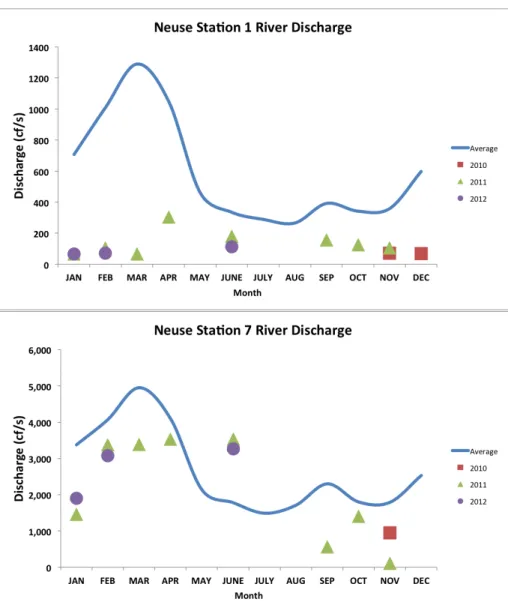
Figure 4 (a-b): River discharge for the Neuse river………...30
Figure 5 (a-b): River gage height for the Tar-Pamlico river………..31
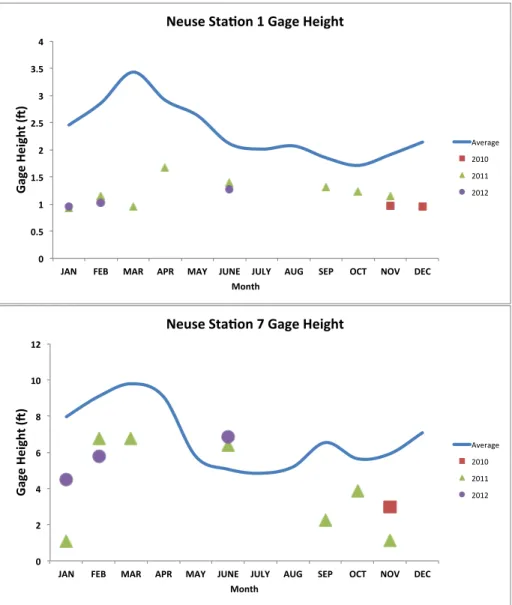
Figure 6 (a-b): River gage height for the Neuse river………32
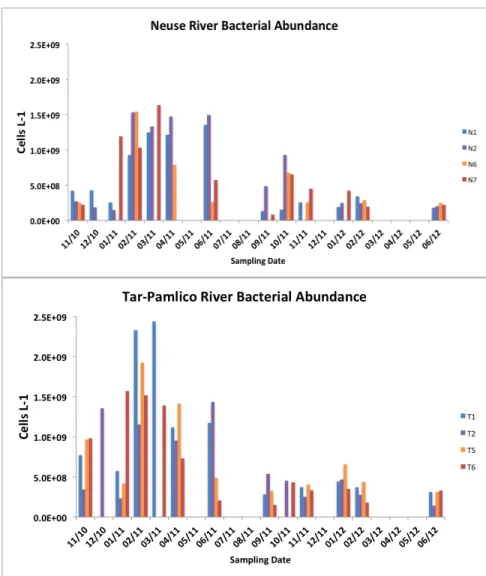
Figure 7 (a-b): Time series graphs of bacterial abundance in the Neuse (a) and Tar-Pamlico Rivers (b) ………33
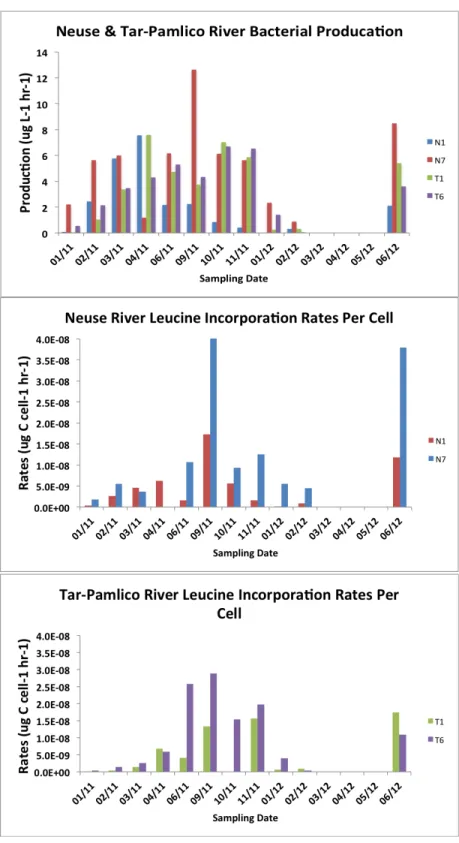
Figure 8 (a-c): Bacterial production time series on a volume (a) and per cell (b, c) basis for both rivers. ………...34
Figure 9 (a-b): Summed hydrolysis rates for the six polysaccharides at upstream and downstream stations in the Neuse River………35
Figure 10 (a-b): Summed hydrolysis rates for the six polysaccharides at upstream and downstream stations in the Tar-Pamlico River………..36
Figure 13 (a-b): Hydrolysis rates of leucine aminopeptidase from the
upstream and downstream stations in the Neuse River……….39
Figure 14 (a-b): Hydrolysis rates of phosphatase from the upstream and
downstream stations in the Neuse River………40
Figure 15 (a-b): Hydrolysis rates of α-glucosidase from the upstream and
downstream stations in the Tar-Pamlico River………..41
Figure 16 (a-b): Hydrolysis rates of β-glucosidase from the upstream and
downstream stations in the Tar-Pamlico River………..42
Figure 17 (a-b): Hydrolysis rates of leucine aminopeptidase from
the upstream and downstream stations in the Tar-Pamlico River………..43
Figure 18 (a-b): Hydrolysis rates of phosphatase from the upstream
and downstream stations in the Tar-Pamlico River………...44
Figure 19 (a-e): Relative contribution of each polysaccharide hydrolysis rate to summed polysaccharide hydrolysis
rates at Neuse station 1………..45
Figure 20 (a-d): Relative contribution of each polysaccharide hydrolysis rate to summed polysaccharide
hydrolysis rates at Neuse station 7……….46
Figure 21 (a-c): Relative contribution of each polysaccharide hydrolysis rate to summed polysaccharide
hydrolysis rates at Tar-Pamlico station 1………...47
Figure 22 (a-d): Relative contribution of each polysaccharide hydrolysis rate to summed polysaccharide
Figure 24 (a-c): Beam attenuation (a), temperature (b), and salinity (c)
depth-profiles for the three stations………...70
Figure 25 (a-b): Graphs depicting bacterial abundance measurements from the surface (a) and particle-maximum depths (b)
for all stations. ………...72 Figure 26 (a-b): Graphs depicting bacterial protein production from
the surface (a) and particle-maximum depths (b) for all stations. ………73
Figure 27 (a-b): Graphs of the hydrolysis rates for α- and β- glucosidases at the surface for the non-particle associated (a) and particle-associated
(b) microbial communities. ………...75
Figure 28 (a-b): Graphs of the hydrolysis rates for α- and β- glucosidases at the particle-maximum depth for the non-particle associated (a) and particle-associated
(b) microbial communities. ………...76
Figure 29 (a-b): Graphs of the hydrolysis rates for leucine aminopeptidase and phosphatase at the surface for the non-particle associated (a) and particle-associated
(b) microbial communities……….77
Figure 30 (a-b): Graphs of the hydrolysis rates for leucine Aminopeptidase and phosphatase at the
particle-maximum depth for the non-particle associated
(a) and particle-associated (b) microbial communities. ………78
Figure 31 (a-c): Graphs of the hydrolysis rates of the six polysaccharides
(b) at Stn. CBM. ………81
Figure 33 (a-b): Graphs of total polysaccharide hydrolysis rates over the entire time-series incubation for the whole water at both depths (a) and for the particle-associated community
at both depths (b) at Stn. CHO………...82
Figure 34 (a-b): Graphs of total polysaccharide hydrolysis rates over the entire time-series incubation for the whole water at the
CHAPTER 1: A Multi-Season Investigation of Microbial Community Activities in the Neuse and Tar-Pamlico Rivers
INTRODUCTION
Riverine systems are important sources of organic carbon and nutrients for coastal and estuarine systems (Paerl et al 1998, Stow et al 2001, Lin et al 2007). The availability of organic matter that can be processed within rivers is dependent on multiple physical, biological, and chemical factors, including the nature and extent of allochthonous input via runoff and
groundwater, as well as autochthonous production within the system (Spencer et al 2012). The quantity and quality of organic carbon and nutrients ultimately delivered to estuaries and coasts is partially the outcome of organic matter processing by heterotrophic microbial communities within the rivers. These communities facilitate the transformation and respiration of organic matter, and regeneration of nutrients (Blackburn et al 1996). The extent to which organic matter is processed and transformed within a riverine system is thus dependent in part on the
capabilities of heterotrophic microbial communities. The initial step of organic matter
of a microbial community may produce specific extracellular enzymes, but the products of hydrolysis can be accessed by a wider range of organisms (Cotta 1992, Turley et al 1994). The activities of extracellular enzymes may therefore benefit a wider community, and measurement of extracellular enzyme activities can represent the potential to initiate organic matter
remineralization at the community-level.
A number of biological, chemical, and physical factors can influence the production of extracellular enzymes (Allison & Vitouesk 2005, Artigas et al 2009), while the degradation of organic matter can be dependent upon such factors as substrate type (McCallister et al 2006), availability (Sinsabaugh & Morehead 1994), and community nutrient demands (Rier et al 2011). In addition, studies have shown that organic mater concentration and type have seasonal fluxes in freshwater watersheds (Singh et al 2013). Therefore, changes in organic matter supply, environmental conditions, or microbial community composition across spatiotemporal scales may be reflected in the enzymatic profiles and activities of a microbial community.
Since organic matter type, concentration, and microbial community composition likely influence enzymatic activities, spatial and temporal variability of enzymatic activities could vary widely. Freshwater systems such as creeks and streams have shown to be a medley of different microbial community activities, responding to temporally-changing environmental gradients (Frossard et al 2012). Prior studies of freshwater systems have, in general, been limited by either the number of sites studied or length of the study period. One objective of the current
material. We therefore measured the activities of extracellular enzymes using substrate proxies common to prior studies, as well as using high molecular weight substrates that reflect the activities of enzymes that cleave organic matter mid-chain (endo-acting enzymes.)
We investigated spatial and seasonal variations in microbial activities and organic matter remineralization in two distinct river systems in central and eastern North Carolina: the Neuse River and the Tar-Pamlico River. These rivers were sampled 13 times over a 20-month period in order to investigate the manner in which changing biological, physical, and chemical parameters such as temperature, river discharge, and bacterial abundance may affect organic carbon and nutrient cycling, as measured via activities of extracellular enzymes. Both rivers feed into the Albemarle-Pamlico Sound estuary system, the second largest estuary system in the United States (Paerl et al. 2010), and home to 90% of the nurseries for North Carolina’s major fisheries
(NCOEE 2007). Though Albemarle-Pamlico Sound, as well as other estuary systems, serves as an important link between terrestrial/riverine systems and the marine environment (Paerl et al. 1998), the dynamics of organic matter processing occurring in the Neuse and Tar-Pamlico Rivers remains unknown. We sought to understand connectivity patterns between activities and a suite of chemical, physical, and biological parameters that could further the understanding of the spatiotemporal drivers of community activity and therefore organic matter remineralization.
METHODS
Study Site
The Neuse and Tar-Pamlico Rivers, located in central and eastern North Carolina, feed into Pamlico Sound, a major nursery for the mid-Atlantic and Southeastern United States’
is heavily urbanized upstream, with a population of over 1.5 million residing within its watershed (Burgess 2007). The Neuse is also subject to heavy industrialized agricultural use, with over 12 million hogs within its watershed (Paerl et al. 2009). The Tar-Pamlico River is a smaller, less developed river both in terms of agricultural and urban development, but it is the largest tributary of the Pamlico River Estuary (Overton et al 2012). The mean discharge to the
Albemarle-Pamlico estuarine system is 190 m3 s-1
for the Neuse River and 148 m3 s-1
for the Tar-Pamlico River (Lin et al 2007).
Surface water samples were collected from four stations (N1, N2, N6 and N7) in the Neuse River, and four stations (T1, T2, T5, and T6) in the Tar River (Fig. 1). These stations were chosen to capture the different land-use impacts of the rivers (urbanization of upstream stations; agricultural impacts of downstream stations), as well as the transition from a freshwater to an estuarine ecosystem. Due to the timing of our sampling program, we also partially captured the influence of a major storm event on the lower river stations.
Sample Collection
Surface water samples were collected over a 20-month period (November 2010 to June 2012) from each of the four stations in the Neuse and Tar-Pamlico Rivers (Fig. 1). Samples were collected in 33 L Nalgene carboys and stored at in-situ temperatures during transportation back to UNC-Chapel Hill. Dissolved oxygen, temperature, and pH data were collected on site using a YSI (YSI Inc. 556MPS). River discharge and gage height for each of the river stations were obtained from the USGS’s monitoring website (http://waterdata.usgs.gov/nc/nwis/rt).
Activities of exo-acting (terminal-unit cleaving) as well as endo-acting (mid-chain cleaving) enzymes were measured using two different methods. Small substrate proxies (4-methylumbelliferone- (MUF-) and 4-methylcoumarinyl-7-amide- (MCA-) labeled substrates) were used to measure a- and b-glucosidase, leucine aminopeptidase, and phosphatase activities (Hoppe 1983; Hoppe et al. 1988). Using water from the main carboy, triplicate water samples from each station were amended with MUF labeled α-D-glucoside, β-D-glucopyranoside, phosphate, and MCA labeled leucine (all obtained from Sigma-Aldrich USA) to a final concentration of 400 μM (this concentration was chosen at the start of the project, from a saturation curve made to determine the appropriate saturation concentration of each substrate in the river water). Killed controls consisted of autoclaved water to which substrate was added. Samples were incubated for a period of 3-5 hours; an initial time-zero measurement was taken at the start of this period, and two to three subsequent time points were measured during this period. For each measurement, a 1-ml aliquot was taken from the incubating sample and combined with 1-ml of 20 mM borate buffer, and fluorescence was measured using single-cell fluorometers (Turner Biosystem TBS-380 or a Promega Quantifluor-ST). A dilution curve was created with each fluorophore in autoclaved river water to determine a fluorescence-hydrolysis rate conversion factor for each river. Hydrolysis rates were then calculated using the conversion factors and fluorescence measurements in Excel (Microsoft, 2011).
The second method to measure enzyme activities focused on the activities of extracellular enzymes responsible for endo-acting (mid-chain cleaving) hydrolysis of a specific set of
USA) were labeled with fluoresceinamine as described in Arnosti (2003). Because of the time and resources required for measurements with FLA-polysaccharides, polysaccharide hydrolysis rates were measured at only at the upriver-most and downriver-most station in each river. At these stations (Stns. T1, T6; N1, and N7), duplicate live water samples, as well as an autoclaved control water sample for each station, were separately amended with one of each of the six substrates to a final concentration of 175 nM monosaccharide equivalent. A time-zero
measurement was immediately taken, and the samples were then incubated in the dark at near in-situ temperature for a period of 2-3 weeks, with 4-5 subsequent time-point measurements taken during this time. The incubation period was chosen to allow sufficient time for all six
polysaccharides, as our prior work had shown considerable variations in the time point at which hydrolysis of specific substrates was detectable. After processing the samples, we found that all polysaccharides were hydrolyzed after three days. The 3-day incubation data are reported here, as it was the first time-point with detectable hydrolysis and we sought the shortest possible incubation period to minimalize community changes as a result of the “bottle effect” (see Stewart et al 2012 for further discussion).
missing data are as follows: 09/11 (FUC), 11/11 (FUC), and 06/12 (LAM).
Bacterial Cell Counts and Production
Aliquots of water were fixed for bacterial cell counts, following Porter & Feig (1980). Staining was carried out with 4’, 6-diamidino-2-phenylindole (Sigma-Aldrich USA), and slides were counted under an epifluorescence microscope (Olympus U-RFL, Olympus USA) using MetaMorph Microscopy software (Molecular Devices USA). 10 fields of view were counted per slide, with duplicate slides made for each river station.
Bacterial production was measured using 3
H-leucine incorporation (Kirchman et al. 1985; Kirchman 2001). These measurements were only initiated in January 2011, so no data are
available for the 2010 sample dates. Water from the upstream- and downstream-most stations (same stations used to measure polysaccharide hydrolysis) in each river, plus autoclaved control water, was amended with 3
H-leucine to a final concentration of 20 nM. Samples were incubated for 1-2 hours; following this incubation period, reactions were terminated using 100%
trichloroacetic acid (TCA). Samples were then concentrated and washed with 80% ethanol following Kirchman (2001) before drying over night. Samples were then amended with
scintillation liquid and allowed to sit for a 2-day period before analysis in a scintillation counter (Perkin Elmer TriCarb 3110 TR).
Dissolved Organic Carbon
Dissolved organic carbon concentrations from these samples measured via high temperature catalytic oxidation and non-dispersive infrared detection on a Shimazdu TOC-L series instrument (Shimadzu Corp. Kyoto). Samples were acidified to a pH <2 and sparged with commercially obtained CO2 free, zero-grade air for 10 minutes for inorganic carbon removal. Standards were generated from dilution of commercially prepared potassium hydrogen phthalate [KHP] (La-Mar-Ka Inc., Baton Rouge, LA) with 18.2 MΩ ultrapure water.
Statistical Analysis
Exploratory data analyses were carried out to determine if any correlations existed between extracellular enzyme activities and chemical, physical, or biological parameters. Based on the exploratory analyses, three statistical modeling methods were applied to examine the effects of location, date, river discharge, river gage height, leucine incorporation data,
temperature, pH, dissolved oxygen, cell count data, precipitation data, and total suspended solids data on enzyme activities. The three modeling methods (multiple linear regression, linear mixed regression, and ordinary/logistic regression) were all performed in R (RStudio, Inc. USA).
The Shannon Diversity Index (SDI), a measure of population “evenness”, was used on the enzyme “populations” to determine the distribution of enzymatic hydrolysis rates among the polysaccharide substrates (Steen et al. 2010). This index was applied by determining the relative contribution of individual polysaccharide hydrolysis rate to the summed polysaccharide
hydrolysis rates. The SDI value was determined by:
,
determine magnitude of difference between each value. All calculations were preformed in R (RStudio, Inc. USA).
RESULTS
Environmental and Hydrological Characteristics
Environmental data including dissolved oxygen (DO), pH, salinity, dissolved organic carbon (DOC), river gage height, and river discharge were used establish a picture of the seasonal environmental characteristics and dynamics of both rivers, and to investigate potential connections between community activity and river characteristics.
In the Neuse River, salinity remained near zero upstream (Stns. N1, N2); although downstream salinity (Stn. N7) exhibited greater fluctuations with time, the station maintained either freshwater or estuarine conditions (Table 1). Temperature in the Neuse River fluctuated seasonally between 4°C and 30°C, and was comparable among stations at a given time point (Table 1). Salinity of the Tar-Pamlico River remained close to zero, even at the station farthest downriver (Stn. T6) (Table 1). Temperature in the Tar-Pamlico River, similar to the Neuse, varied seasonally between near 0°C to 29°C, and was comparable among stations sampled at the same time (Table 1). Dissolved oxygen (DO) followed a strong inverse relationship with
temperature in both rivers. The range of DO for both downstream stations (Stns. N7, T6) was greater than the DO ranges upstream.
In the Neuse River, DOC concentrations were consistently higher at the downstream-most station, N7. DOC concentrations at Stn. N7 were near or above 1200 μmol C L-1
, whereas DOC concentrations at Stns N1, N2 and N6 ranged from about 400-1000 μmol C L-1
. No seasonal trends were evident, but the highest DOC measured at Stn. N7 (1861 μmol C L-1
September 2011, following Hurricane Irene (Fig. 2b). In the Tar River, DOC concentrations at most stations and seasons ranged from around 300 to 1000 μmol C L-1
. DOC concentrations did not show distinct patterns by station or by sampling months for the different years (Fig. 2 a-c). As for the Neuse River, the highest concentrations DOC were recorded at the downriver stations, Stns. T5 and T6, in September 2011, following Hurricane Irene, when DOC at Stn. T6 exceeded 1700 μmol C L-1
.
Because gage height and river discharge data were not calibrated by the USGS,
hydrological data for the T1 and T6 stations are not available; data from stations T2 and T5 are presented instead to examine hydrological trends in the Tar-Pamlico River (Figs. 3-6). Gage height data for the upstream and downstream stations in both the Neuse and Tar-Pamlico Rivers (Figs. 5-6) showed large fluctuations across the sampling period, with higher maxima
downstream. The upstream station in the Neuse River (Stn. N1) was located near a dam, possibly explaining lower variability compared to the other three stations. River discharge was much greater downstream in both rivers (Figs. 3-4). Both rivers also showed a greater deviation from long-term discharge averages at the upstream stations, most likely due to prolonged recovery from drought conditions (Figs. 3-6; USGS, http://waterdata.usgs.gov/nc/nwis/rt). Additionally, lower gage height and river discharge values upstream most likely reflect the smaller watersheds at these stations, as well as a greater groundwater influence as compared to downstream stations. Peaks in river discharge and gage height occurred in late spring and early summer for both rivers at all stations, with secondary peaks occurring in the late summer and early fall. The effects of Hurricane Irene are evident in the lower portion of the Tar River in particular, in which
Microbial Cell Counts & Leucine Incorporation Data
Seasonally, bacterial numbers were greatest in the winter and early spring of 2011. In both rivers, months sampled in the winter and late spring of 2012 had lower bacterial abundance than their 2011 counterparts. Bacterial abundance (Fig. 7) varied by a factor of 10 over the time course of the study, and was generally higher in the Tar-Pamlico River. Bacterial protein production rates (Fig. 8a) showed slight increases during the spring through fall months, with minima occurring during the winter months for both rivers. However, when normalized on a per cell basis (Fig. 8b, c), the summer and late fall months show greater bacterial production. The patterns of per-cell production rates were similar between upstream and downstream Neuse stations (Stns. N1 and N7), but appeared decoupled in the Tar-Pamlico River (Stns. T1 and T6).
Activities of polysaccharide-hydrolyzing enzymes
delayed manner, with summed hydrolysis rates decreasing between the April and June 2011 sampling dates, then showing a large increase between the June and September 2011 sampling dates.
Although all six polysaccharides were hydrolyzed at all time points and stations, the relative contribution of each activity varied by substrate, station, and time. Overall, chondroitin and xylan constituted the greatest contributions to the summed polysaccharide hydrolysis rates across all seasons and stations in both rivers. At stations N1, T1, and T6, hydrolysis rates generally decreased in the order xylan, chondroitin, arabinogalactan, laminarin, with very small contributions from fucoidan and pullulan (Figs. 9 &10). For station N7 (Fig. 9b), hydrolysis rates generally decreased in the order xylan, chondroitin > laminarin > arabinogalactan >> fucoidan, pullulan. In the Neuse River, hydrolysis rates of arabinogalactan, chondroitin, fucoidan, and pullulan were similar between the upstream and downstream stations, but xylan and laminarin showed a larger range of hydrolysis rates downstream (Stn. N7). In the Tar-Pamlico River, upstream and downstream stations had generally similar capabilities for hydrolysis of all six polysaccharides, even for cases in which hydrolysis rates varied at an individual time point.
In the Neuse River, summed hydrolysis rates were generally greater downstream, while summed rates for the Tar-Pamlico River were greater upstream. However, when hydrolysis rates in each river were compared using the three statistical models, there was no significant statistical correlation for location. In addition to the summed hydrolysis rates, patterns of individual
Activities of glucosidase, peptidase, and phosphatase in the Neuse River
Glucosidase, peptidase, and phosphatase activities (Figs. 11-14) were measured as soon as possible after sample water collection, in order to capture the potential for the exo-acting enzymatic activities at each station. Seasonally, both AGLU and BGLU hydrolysis rates were significantly lower in the winter and early spring months (p < 0.05), and higher in the late spring and fall. Overall, BGLU hydrolysis rates (Fig. 12) were higher, and had a larger dynamic range (the difference between the largest and smallest hydrolysis rate), than AGLU hydrolysis rates (Fig. 11), with average rates below 5 nmol liter-1
hour-1
for AGLU and between 10-15 nmol liter -1
hour-1
for BGLU. There was no clear spatial trend (upstream versus downstream) for either AGLU or BGLU hydrolysis. At both upstream and downstream stations, AGLU hydrolysis rates had variable similarity between stations (ie, between N1 and N2; N6 and N7); and the same trend was even more exaggerated for BGLU hydrolysis rates between the upstream stations and the downstream stations.
The range of LEU hydrolysis rates across seasons was at times several orders of
magnitude greater than for either AGLU or BGLU hydrolysis rates (Fig. 13), generally between 100-300 nmol liter-1
hour-1
. At a number of time points, LEU hydrolysis rates were greater downstream (Stns. N6 and N7) than upstream, though a consistent pattern was not observed. Between the upstream stations (Stns. N1 and N2), LEU hydrolysis rates were somewhat similar, while between the downstream stations (Stns. N6 and N7) rates tended to be very different. Though a statistically significant seasonal trend was not observed for LEU hydrolysis, the lowest hydrolysis rates were observed in the winter or early spring months.
PHOS hydrolysis rates (Fig. 14), ranges, and patterns were on the whole similar to LEU in the Neuse River; rates generally ranged between 50-200 nmol liter-1
hour-1
downstream stations (Stns. N6 and N7), PHOS hydrolysis rates were more closely coupled than between the two upstream stations (Stns. N1 and N2), which showed larger differences at each month sampled. As with total GLU hydrolysis, PHOS hydrolysis rates were lowest in the sampled winter or early spring months (p < 0.05). The winter and spring minima for α- and β-GLU, LEU, and PHOS hydrolysis rates suggest that rates of organic matter remineralization and phosphate acquisition are generally lowest in these months across both rivers, but more specific patterns vary with substrate and location.
Activities of glucosidase, peptidase, and phosphatase in the Tar-Pamlico River
For the Tar-Pamlico River, hydrolysis rates and dynamic ranges (Figs. 15 & 16) for both AGLU and BGLU were generally greatest upstream (5-20 nmol liter-1
hour-1
for AGLU; 10-50 nmol liter-1
hour-1
for BGLU), and were generally greater than the Neuse River at all stations. Between the upstream stations (Stns. T1 and T2), AGLU hydrolysis rates were more closely coupled than BGLU hydrolysis rates, which showed greater differences between the two stations. The opposite trend was seen between the two downstream stations (Stns. T5 and T6), with
AGLU hydrolysis rates showing greater variability than BGLU hydrolysis rates. In contrast to the Neuse River, there were no strong seasonal trends for AGLU (Fig. 15) or BGLU (Fig. 16) hydrolysis in the Tar-Pamlico River. However, similar to the Neuse, minimum rates were observed in the winter or early spring months. It should be noted that hydrolysis rates for both GLU at station T6 were beyond the scale of the graph during April 2011; this elevated rate was also reflected in summed polysaccharide hydrolysis rates. The values for AGLU and BGLU hydrolysis (204 and 195 nmol l-1
hr-1
hydrolysis rates were at a minimum during April 2011, and total GLU hydrolysis rates were unremarkable. Though there are many possible explanations for this peak in GLU rates at T6, this dramatic increase was not seen in the other collected physical and biochemical data; the fact that it was observed using different methods of measurement suggest that this observation is not a sampling artifact, but the possible driver(s) behind this increase were not captured by our data.
Hydrolysis rates for LEU (Fig. 17) were greater downstream in the Tar-Pamlico River (100-400 nmol liter-1
hour-1
, p < 0.05), and overall were higher than in the Neuse River. A seasonal trend was not clearly present for LEU hydrolysis, though minimum hydrolysis rates did occur in winter months at all stations, as with other substrates in both rivers. LEU hydrolysis rates were more tightly coupled between the two upstream stations (Stns. T1 and T2) and showed more variability between the two downstream stations (Stns. T5 and T6).
There was no clear locational distinction between upstream and downstream stations for PHOS hydrolysis rates (Fig. 18) in the Tar-Pamlico River, both generally had rates ranging from 100-400 nmol liter-1
hour-1
. Between the two upstream stations (Stns. T1 and T2), PHOS
Shannon Diversity Index
The Shannon Diversity Index (SDI) demonstrates the relative contribution of each polysaccharide hydrolysis rate to the summed total hydrolysis rates at a particular station and date (Steen et al. 2010). A larger SDI value indicates that individual hydrolysis rates were comparable among all six polysaccharides, whereas a smaller SDI value indicates total
hydrolysis was dominated by the hydrolysis of a select few polysaccharides. It should be noted that the SDI measures only the proportion of hydrolysis contributed by each individual
polysaccharide to the summed hydrolysis rate, and not the identity of the individual
polysaccharide contributing to this pattern. The SDI therefore allows for a measure of “eveness” to be measured among individual hydrolysis rates.
At station N1 on the Neuse River, the SDI value for June 2011 (Fig. 19) was significantly larger than April 2011, September 2011, and October 2011 (all p < 0.01), indicating that June 2011 had maximum diversity of the microbial community’s hydrolysis potential as compared to the surrounding months. The SDI values indicated a significant change in hydrolysis capabilities from September 2011 to October 2011, and from October 2011 to November 2011 (both p < 0.05). This change in polysaccharide hydrolysis patterns from month-to-month indicates a change in the functional capabilities of the microbial community over this time.
Both stations on the Tar-Pamlico River (Fig. 21 & Fig. 22) demonstrated similar seasonal progressions as the Neuse River, with hydrolysis patterns having maximum diversity of
capabilities in the summer months. Again, this suggests that the functional capabilities of the microbial communities are changing between these sampling months, resulting in different hydrolysis patterns. However, these data do not suggest repeatable patterns, predictable progressions, or why such polysaccharide hydrolysis capabilities are changing.
DISCUSSION
Overview
Sound. In aquatic systems, the microbial community is expected to optimize its extracellular enzymatic profile for optimum nutrient acquisition (Martinez et al 1996); in such a case, a wide range of hydrolysis capabilities could be indicative of the variety of organic substrates made available. In examining how enzymatic hydrolysis rates correlate with location, as well as environmental and biological factors, we hoped to further understand the factors that are driving organic matter remineralization in riverine systems.
Trends in Microbial Community Activities
polysaccharide substrates during the spring sampling, and this was trend not observed upon a repeated sampling the following fall (Ziervogel et al 2014). In marine systems, previous latitudinal transect studies have found limited locations where hydrolysis of all six
polysaccharides occurs (Arnosti et al 2005, Arnosti et al 2011). Sites in the northern Gulf of Mexico are notable for extensive hydrolysis of all six polysaccharides at three distinct locations (Steen et al 2012), but this investigation did not have a seasonal aspect for comparison. One possible explanation for the broad hydrolysis capabilities of microbial communities in the Neuse and Tar-Pamlico Rivers may be the comparatively modest size of the rivers, their extensive watersheds, seasonal flooding events, and subsequent heavy terrestrial input into the systems, which provides the microbial community with a greater quantity and diversity of organic matter sources. Though previous studies have suggested that freshwater and estuarine organic matter of autochthonous, as opposed to allochthonous, origin is of greater importance to the microbial community for uptake (McCallister et al 2006), significant input of terrestrial organic matter may well influence, and possibly increase, hydrolytic capabilities. Moreover, other investigations have demonstrated overlap between terrestrial and freshwater microbial communities (Crump et al 1999), and larger possible community diversity could result in more diverse community activities and functional capabilities.
Because the extent of enzymatic activities may be related to the prevalence of specific substrates in a system, comparing hydrolysis rates may provide insight into the nature and types of substrates that are present in a system. Chondroitin and xylan were the most rapidly
al 2012), the Delaware Bay Estuary (Ziervogel & Arnosti 2009, Keith & Arnosti 2001), and latitudinal marine transects (Arnosti et al 2005, Arnosti et al 2011) have also demonstrated higher rates of chondroitin, laminarin, or xylan hydrolysis compared to fucoidan and pullulan. Laminarin is a storage polysaccharide of algal origins and xylan originates from vascular plants such as those found in marshes and terrestrial systems (Bold 1985). Higher hydrolysis rates of both laminarin and xylan relative to other polysaccharides could be indicative of the origins of organic matter in both rivers, possibly connected to the heavy terrestrial input. The specific sources of chondroitin are yet unknown, but, as observed in this study, its hydrolysis is rapid across a variety of locations. Thus, though observed polysaccharide hydrolysis rates have been seen on similar scales in both freshwater and marine systems previously, the extent of use and polysaccharide hydrolysis at all stations and time-points in the two rivers provides unique insight into freshwater systems.
Seasonal and Spatial Patterns in Microbial Composition and Activities
a limited response via temperature and light, but also noted that other underlying and unknown factors were likely influencing enzymatic activities, highlighting the difficulty of spatiotemporal interpretations of such data (Frossard et al 2012).
Our data also suggest a complex relationship between organic matter remineralization and seasonal or environmental changes. This could be in part due to the limited spatiotemporal focus of past studies. For example, BGLU activity has been previously correlated with seasonal changes via benthic biomass (Artigas et al 2009), chlorophyll (Tiquia 2011), temperature (Frossard et al 2012), and phytoplankton blooms (Allison et al 2012). This study found seasonal patterns of BGLU activities via precipitation (p < 0.05), but only in the Tar-Pamlico River. The lack of BGLU seasonality in the Neuse River highlights the difficulty in finding seasonal and temporal trends in enzymatic activities with larger datasets.
For both the small substrates and polysaccharides, none of the measured parameters suggested a strong correlation with hydrolysis activities in either the Neuse or Tar-Pamlico Rivers. As a result, a reliable seasonal pattern of hydrolysis activities was not discovered in this study. Though the polysaccharide activities, and to some extent the GLU, LEU, and PHOS activities, demonstrated sporadic seasonal trends (ie, lower hydrolysis rates in colder months), an environmental or biological proxy that predicted such trends was not evident. This suggests that, though there may be a seasonal aspect to remineralization activities of the microbial community, the relationship between the seasonality of environmental and biological factors and microbial community activities is more complex and yet to be captured.
Figs. 3-6) had strong seasonal trends, others such as bacterial abundance, bacterial production, and community activities did not. It is perhaps the interplay between factors that do and do not have consistent seasonal trends (e.g., temperature and bacterial abundance) that is driving enzymatic activities, and masking seasonal correlations. In the past, seasonal trends of bacterial abundance have been observed in urban rivers in southeast Michigan (Tiquia 2011), in a
eutrophic river in northeast Germany (Freese et al 2006), and in the Columbia River and Estuary (Fortunato et al 2011); this study showed no clear seasonal trend for bacterial abundance.
However, evidence suggests that microbial communities in freshwater, estuarine, and marine systems are able to respond rapidly to increased organic matter inputs (Williams & Jochem 2006, Allison et al 2012). Such rapid responses may be the reason that consistent, long-term
seasonality is not evident in the Neuse and Tar-Pamlico Rivers, as it may have been obscured by the length of time between sampling dates.
Comparisons of the Shannon Diversity Index (SDI) values imply that in the Neuse and Tar-Pamlico Rivers, shifts in the functional capabilities of the microbial community may coincide with changes in temperature, precipitation, river discharge, and other environmental conditions. The SDI is a measure of population distribution, and it has been adapted for use with the polysaccharide substrates (Steen et al 2010). A larger SDI value indicates that hydrolysis was more evenly distributed among all six polysaccharides. At all stations where polysaccharide hydrolysis was measured in both rivers, June 2011 had a larger SDI value and was significantly different from either the preceding or following months sampled, or both (Fig. 19b, Fig. 20a, Fig. 21b, Fig. 22b). As this functional shift was seen both upstream (Stns. T1 and N1) and
winter months. Microbial community composition in the Tar-Pamlico River also demonstrated temporal shifts (Balmonte et al, in prep), which could possibly explain the shift in community activities. However, past studies have highlighted the unclear relationship between microbial community composition and activity (Frossard et al 2012, Morrissey et al 2013), indicating that though enzymatic profiles are likely related to community composition, the relationship between composition and functionality is complicated. There was no evidence for annual patterns of enzymatic activity, which suggests these rivers instead observe functional shifts with seasonal transitions as a result of the many changing environmental and biological parameters.
Upstream and Downstream Connectivity
Hydrological data, enzymatic activities, and microbial community composition (Balmonte et al, in prep) indicated that both the Neuse and Tar-Pamlico Rivers remain
disconnected between the upstream and downstream stations. Hydrology data indicated that river flow upstream is more dependent upon precipitation than downstream, which has a larger
drainage basin that feeds into it. Larger fluctuations in river discharge and gage height upstream can also result in diluted DOC concentrations upstream when precipitation or drainage is high. As downstream stations posses larger drainage basins and experience greater anthropogenic inputs, increased discharge at these stations may lead to increased DOC concentrations. The contrasting impacts of river discharge on organic carbon availability could in part explain the decoupling of enzymatic activities and microbial community composition between river stations.
individual activities varied, but for the most part were more closely coupled in the Tar-Pamlico. Activities between the two downstream stations in both rivers (N6 and N7, T5 and T6) also indicated a greater degree of connectivity in the Tar-Pamlico River as opposed to the Neuse. The evidence for spatial trends of enzymatic activity is variable in previous studies: significant differences in microbial community functional capabilities, as measured through polysaccharide hydrolysis, have been observed over large-scale spatial differences in marine systems (Arnosti et al 2011). However, smaller spatial scales in freshwater (Ziervogel et al 2014) and estuarine systems (Keith & Arnosti 2001) could cause local environmental and biological parameters to characterize locational similarities or differences. Other studies have found or nutrient gradients (Mulholland et al 2003, Williams & Jochem 2006) to be drivers or controls on hydrolysis rates. What these data indicate is that the ultimate spatial drivers may be a combination of connectivity and local environmental and biological factors. The enzymatic activities among all ten substrates along all sites in the Neuse and Tar-Pamlico Rivers suggest a complex relationship between anthropogenic inputs, hydrological conditions, station connectivity, and environmental conditions to influence microbial community composition and functional capabilities.
Impacts of Hurricane Irene
hydrolysis rates for AGLU, BGLU, and PHOS at N7 in September 2011 demonstrated relative peaks in hydrolysis activity (Figs. 11b, 12b, 14b). This again could be due to a short response period by the microbial communities, or that a response did not occur in all communities. Bacterial production on a per-cell basis reach a maximum for these stations during September 2011, less than one month after the storm (Figure 8b, c). Balmonte et al (in prep.) found
significant shifts in the bacterial community composition following Hurricane Irene at station T6 the Tar-Pamlico River. Balmonte et al also noticed coupling between upstream and downstream stations reflected in the community composition following the hurricane, a phenomenon not seen in other sampled months. Polysaccharide hydrolysis patterns at station T6 in September 2011 were similar as well, further suggesting an increased level of connectivity following the storm. This community shift, combined with elevated bacterial production in September 2011, suggests the hurricane did impact the composition and activities of the microbial community. As past studies have suggested that hydrolysis can shift significantly on a timescale of hours or days (Allison et al 2012, Gilbert et al 2010), it is possible that the September 2011 sampling did not capture the change in enzymatic production by the community due to the hurricane. If this is the case, then it also suggests that enzymatic dynamics of a community can stabilize faster than the community itself.
Conclusions
The microbial community activities of the Neuse and Tar-Pamlico River offer insight into the complex spatiotemporal trends of organic carbon and nutrient remineralization in river
proves to be the most influential in shaping community activities. Though a disconnect between the upstream and downstream stations was evident in both rivers, it was less pronounced in the Neuse River and disrupted in the Tar-Pamlico River following a storm event, suggesting that connectivity within the rivers may fluctuate. This study provides further insight into organic matter processing occurring in rivers, and such insight may ultimately be used to further understand the organic matter entering estuaries and coastal systems. Future studies of similar spatiotemporal scales are necessary for comparison and better understanding of the factors that are driving organic matter remineralization.
FIGURES
Table 1 (a-b): Temperature, DO (dissolved oxygen), pH, salinity, TSS (total suspended solids), gage height, and discharge data for each month sampled from the Neuse (a) and Tar-Pamlico (b)
Station Date Temp (C) DO (mg/L) pH Salinity (ppt) TSS (mg/L)
N1 Nov_10 13.6 10.1 7.50 0.04 3.91
Dec_10 5.1 13.4 10.38 0.04 3.09
Jan_11 3.9 13.7 7.27 0.04 1.58
Feb_11 6.8 12.4 7.51 0.04 4.93
Mar_11 11.9 10.1 7.45 0.04 3.30
Apr_11 14.2 9.1 7.65 0.04 4.95
Jun_11 26.9 7.4 7.46 0.05 0.83
Sep_11 27.5 6.9 7.65 0.05 1.55
Oct_11 20.3 8.35 7.66 0.05 1.03
Nov_11 14.1 10.3 7.84 0.05 1.04
Jan_12 8.4 12.3 7.8 0.05 NA
Feb_12 10.0 11.7 7.93 0.05 NA
Jun_12 24.4 7.5 7.84 0.05 3.93
N7 Nov_10 13.2 10.3 7.58 0.04 4.58
Jan_11 4.1 13.7 8.25 14.03 14.92
Feb_11 NA NA NA NA NA
Mar_11 15.0 7.7 7.10 0.15 3.50
Apr_11 NA NA NA NA NA
Jun_11 28.5 7.8 8.10 7.41 2.03
Sep_11 29.6 1.7 7.08 1.10 8.58
Oct_11 19.4 7.3 7.78 5.59 7.03
Nov_11 16.0 9.8 7.81 1.17 NA
Jan_12 10.3 11.0 8.11 3.64 12.37
Feb_12 12.5 9.6 7.66 0.18 NA
Jun_12 23.0 4.6 7.24 1.34 5.81
Station Date Temp (C) DO (mg/L) pH Salinity (ppt) TSS (mg/L)
T1 Nov_10 NA NA NA NA 1.56
Jan_11 0.6 13.3 7.39 0.04 11.80
Feb_11 5.4 11.3 7.34 0.04 10.88
Mar_11 12.0 8.8 7.23 0.03 19.12
Apr_11 17.7 7.2 7.30 0.03 7.42
Jun_11 NA NA NA NA 5.44
Sep_11 22.9 5.6 7.12 0.02 NA
Nov_11 9.3 7.7 7.56 0.03 NA
Jan_12 4.4 12.8 8.00 0.03 4.74
Feb_12 8.0 10.8 7.94 0.03 13.92
Jun_12 20.8 4.5 7.61 0.04 7.84
T6 Nov_10 13.9 10.6 6.71 0.02 4.12
Jan_11 3.9 12.9 7.40 0.03 8.29
Feb_11 NA NA NA NA 7.90
Mar_11 12.6 8.0 6.83 0.04 6.60
Apr_11 18.9 5.7 6.87 0.04 2.35
Jun_11 28.7 7.1 7.74 2.11 8.70
Sep_11 27.0 2.1 6.96 0.06 9.32
Oct_11 18.5 7.0 7.38 0.65 4.86
Nov_11 14.0 8.5 7.54 0.05 NA
Jan_12 8.0 11.3 7.70 0.07 4.67
Feb_12 11.7 9.4 7.47 0.42 8.46
Figure 3 (a-b): River discharge for the Tar-Pamlico river. Average line depicts the historical average for each location.
0" 2000" 4000" 6000" 8000" 10000" 12000"
JAN" FEB" MAR" APR" MAY" JUNE" JULY" AUG" SEP" OCT" NOV" DEC"
Ri
ve
r"D
is
ch
ar
ge
"(c
f/
s)
"
Month"
Tar"StaKon"5""River"Discharge"
Average' 2010'
2011'
Figure 5 (a-b): River gage height for the Tar-Pamlico river. Average line depicts the historical average for each location.
0" 2" 4" 6" 8" 10" 12" 14"
JAN" FEB" MAR" APR" MAY" JUNE" JULY" AUG" SEP" OCT" NOV" DEC"
Ga ge"Hei gh t"( C )" Month" Tar"StaHon"2""Gage"Height" Average' 2010' 2011' 2012' 0" 2" 4" 6" 8" 10" 12" 14"
JAN" FEB" MAR" APR" MAY" JUNE" JULY" AUG" SEP" OCT" NOV" DEC"
Figure 6 (a-b): River gage height for the Neuse river. Average line depicts the historical average for each location.
0" 0.5" 1" 1.5" 2" 2.5" 3" 3.5" 4"
JAN" FEB" MAR" APR" MAY" JUNE" JULY" AUG" SEP" OCT" NOV" DEC"
Ga ge"Hei gh t"( D )" Month" Neuse"StaJon"1"Gage"Height" Average' 2010' 2011' 2012' 0" 2" 4" 6" 8" 10" 12"
JAN" FEB" MAR" APR" MAY" JUNE" JULY" AUG" SEP" OCT" NOV" DEC"
Figure 10 (a-b): Summed hydrolysis rates for the six polysaccharides at upstream and
Figure 12 (a-b): Hydrolysis rates of β-glucosidase from the upstream and downstream stations in the Neuse River.
0" 5" 10" 15" 20" 25" 30" 35" 40"
11/10" 12/10" 01/11" 02/11" 03/11" 04/11" 06/11" 09/11" 10/11" 11/11" 01/12" 06/12"
H yd ro ly si s" Ra te "(n m ol "L ;1 "h r; 1) " Sampling"Date" Upstream"Neuse"Beta"Glucosidase"" N1# N2# 0" 5" 10" 15" 20" 25" 30" 35" 40"
11/10" 01/11" 02/11" 03/11" 04/11" 06/11" 09/11" 10/11" 11/11" 01/12" 02/12" 06/12"
Figure 15 (a-b): Hydrolysis rates of α-glucosidase from the upstream and downstream stations in the Tar-Pamlico River.
0" 10" 20" 30" 40" 50" 60" 70" 80"
11/10" 12/10" 01/11" 02/11" 03/11" 04/11" 06/11" 09/11" 10/11" 11/11" 01/12" 02/12" 06/12"
H yd ro ly si s" Ra te s" (n m ol "L =1 "h r= 1) " Sampling"Date" Upstream"Tar=Pamlico"Alpha"Glucosidase" T1# T2# 0" 10" 20" 30" 40" 50" 60" 70" 80"
11/10" 01/11" 02/11" 03/11" 04/11" 06/11" 09/11" 10/11" 11/11" 01/12" 02/12" 06/12"
Figure 16 (a-b): Hydrolysis rates of β-glucosidase from the upstream and downstream stations in the Tar-Pamlico River.
0" 10" 20" 30" 40" 50" 60" 70" 80"
11/10" 12/10" 01/11" 02/11" 03/11" 04/11" 06/11" 09/11" 10/11" 11/11" 01/12" 02/12" 06/12"
Figure 19 (a-e): Relative contribution of each polysaccharide hydrolysis rate to summed polysaccharide hydrolysis rates at Neuse station 1.
Figure 20 (a-d): Relative contribution of each polysaccharide hydrolysis rate to summed polysaccharide hydrolysis rates at Neuse station 7.
Figure 21 (a-c): Relative contribution of each polysaccharide hydrolysis rate to summed polysaccharide hydrolysis rates at Tar-Pamlico station 1.
Tar$Sta'on$1:$March$2011$
ARA# CHO# FUC# LAM# PUL## XYL#
Tar$Sta'on$1:$June$2011$
ARA#
CHO# FUC# LAM# PUL## XYL#
Tar$Sta'on$1:$September$2011$
Figure 22 (a-d): Relative contribution of each polysaccharide hydrolysis rate to summed polysaccharide hydrolysis rates at Tar-Pamlico station 6.
Tar$Pamlico+Sta.on+6:+April+2011+
ARA#
CHO# FUC# LAM# PUL## XYL#
Tar$Pamlico+Sta.on+6:+June+2011+
ARA# CHO# FUC# LAM# PUL## XYL#
Tar$Pamlico+Sta.on+6:+October+2011+
ARA# CHO# FUC#
LAM# PUL# XYL#
Tar$Pamlico+Sa-on+6:+November+2011+
CHAPTER 2: Contrasting Rates and Patterns of Organic Matter Degradation by Microbial Communities in the Coastal North Atlantic
INTRODUCTION
Coastal microbial communities play a key role in organic matter decomposition and cycling in global biogeochemical cycles (Caruso 2010). Interactions between the microbial community and organic matter are fundamental to the global carbon cycle, as dissolved organic matter in marine systems is one of the largest sources of organic carbon (Amon et al 2001) and, in marine systems, the remineralization of organic carbon and nutrients is mainly carried out by the heterotrophic microbial community (Blackburn et al 1996, Arrieta & Herndl 2002).
However, different bacterial groups can remineralize different types of organic matter (Cottrell & Kirchman 2000), and the bioavailability of organic substrates changes over space and time (Carlson et al 2004).
and cycling at the community-level. At the community-level, a multitude of factors can influence organic matter degradation, such as substrate type (Crost and Suida 2006, McCallister et al 2006), availability (Sinsabaugh & Morehead 1994), as well as the microbial community composition (Morrissey et al 2013). And while the community composition can influence the types of substrates that are degraded, the diversity of the microbial community can also be selectively influenced by the types of substrates present in a system (Landa et al 2013.)
Though types of organic matter can influence microbial community composition, the distribution of organic matter does not appear to be a determining factor in the distribution of microbial communities in the world’s oceans (Cottrell & Kirchman 2000). In addition to a general pattern of distribution among marine microbial communities (Fuhrman 2009), a limited number of studies have found geographical patterns to organic matter degradation by the microbial community (Arnosti et al 2005, Arnosti et al 2011). Therefore, though organic matter degradation and the marine microbial community both have demonstrated geographical
distributions, the relationship between microbial biogeography and organic matter
remineralization remains unclear. Therefore, on a global scale, only limited assumptions can be made as to how biogeochemical cycling of organic carbon and nutrients may change with time and space.
This study examined the degradation of organic carbon and nitrogen, as well as
phosphate acquisition, by microbial communities at three distinct locations in the coastal North Atlantic in order to better understand marine biogeochemical cycles. Each location had unique water quality and depth characteristics, and the waters were influenced by different
degradation, phosphate acquisition, as well as polysaccharide hydrolysis. We also investigated how enzymatic activities, and therefore remineralization rates, differed between the particle-associated and free-living microbial communities. Bacterial abundance and protein production measurements provided insight into the microbial communities at each location and water depth sampled. Altogether, these measurements allowed for a better understanding of how organic matter degradation changed between the three stations and water masses. Understanding how organic matter processing by the microbial community may vary over small spatial scales will allow for more precise models of biogeochemical cycling, and better predict how these processes may change with changing oceans and climates.
METHODS
Study Sites & Sample Collection
Water samples were collected November 1st
thru 5th
2010 from the R/V Cape Hatteras. A Niskin bottle rosette sampler equipped with a conductivity-temperature-depth (CTD) gauge was deployed to collect surface water samples as well as samples at the particle maximum (as determined by beam attenuation recorded by the CTD) depth at each of the three stations (Fig. 23). The CTD recorded temperature, salinity, and beam attenuation at each of the sites (Fig. 24). Station CBM (36.962° N, 75.998° W; water column depth 22 m) was located at the mouth of the Chesapeake Bay. Samples were collected at depths of 1 m (surface) and 21 m
immediately after collection.
Sample Filtration
Triplicate water samples (1.5 - 4 liters) from the surface (CBM, CHO, CLN) and particle-maximum depths (CBM, CHO) were gravity-filtered through 3 μm isopore membrane filters (Milipore USA) immediately after the CTD rosette was retrieved to capture the particle-associated microbial communities. The specific volume of water filtered through each of the replicates ranged from 1.5 to 6 liters; rates reported are normalized to volume filtered. The filters were divided into 8 equal portions using a sterile razor blade. Duplicate portions from one filter were used for the measurement of three polysaccharide hydrolase activities; duplicate portions from a second filter were used to measure the activities of a separate three polysaccharide hydrolases. Duplicates from the final filter were used to measure the hydrolytic activities of α- and β-glucosidase, leucine aminopeptidase, and phosphatase.
Measurements of Extracellular Enzyme Activities
Exo-acting (terminal-unit cleaving) Enzymes:
Activities of exo-acting β- and α-glucosidases and phosphatase were measured using 4-methylumbelliferone- (MUF-) labeled β- and α- glucose and phosphate, respectively. Leucine aminopeptidase activity was measured with 4-methylcoumarinyl-7-amide- (MCA-) labeled leucine; all measurements were made after Hoppe (1983).
μM) (all obtained from Sigma-Aldrich USA). These concentrations were determined prior to the
first station, from a saturation curve made to determine the appropriate saturation concentration of each substrate. Killed controls consisted of autoclaved sample water to which substrate was added. Whole water samples were incubated for a period extending from 1-12 hours depending on station; an initial time-zero measurement was taken at the start of the incubation period, and two to three subsequent time points were measured. For each measurement, a 1-ml aliquot was taken from the incubating sample and combined with 1-ml of 20 mM borate buffer (pH 8). Fluorescence was measured using single-cell fluorometers (Turner Biosystem TBS-380 or a Promega Quantifluor-ST).
Duplicate, one-eight portions of a 3-μm filter from each station and depth were mixed with autoclaved water from the corresponding station and depth, then amended with one of the substrates at the concentrations listed above. Killed controls for these samples consisted of 1/8th of a new, clean 3 μm filter that had been divided with a sterile razor blade. The filter piece was mixed with autoclaved sample water from the corresponding station and depth and then amended with substrate. These samples were incubated and sampled over the same time courses as the live samples.
Fluorescence signals were converted to concentrations using a dilution curve made with each fluorophore in autoclaved sample water. Hydrolysis rates were then calculated in Excel (Microsoft, 2011) using the conversion factors and fluorescence measurements.
Endo-acting (mid-chain cleaving) Enzymes:
chondroitin (CHO), fucoidan (FUC), laminarin (LAM), pullulan (PUL), and xylan (XYL) (all obtained from Sigma-Aldrich USA) were labeled with fluoresceinamine as described in Arnosti (2003). At each depth at all three stations, duplicate live water samples, duplicate 3 μm
filter+autoclaved water samples, and an autoclaved control water sample were separately amended with one of each of the six substrates to a final concentration of 175 nM
monosaccharide equivalent (data missing for the filtered samples from the particle-maximum depth at Stn. CBM). A time-zero measurement was immediately taken, and the samples were then incubated in the dark for a period of ca. 3 weeks, with 4-5 subsequent time-point
measurements taken during this time. Measurements of hydrolysis rates are made as a time course because detection of hydrolysis is based upon a change in the molecular weight distribution of the added polysaccharides, and the time point at which sufficient substrate is hydrolyzed to detect a change is unknown prior to analysis (see Arnosti 2003 for further
discussion). After processing the samples, we found that all polysaccharides were hydrolyzed by the first time-point (typically 3 days). The focus here is primarily on the first time-point
incubation data, since the shortest incubation period would minimalize community changes as a result of the “bottle effect” (Stewart et al 2012). However, further time-points reflect the
1996, 2003).
Bacterial Cell Counts and Bacterial Protein Production
Water samples were fixed with buffered formaldehyde and kept refrigerated aboard ship and during transport back to UNC-Chapel Hill. Cell counts were made after staining with 4’, 6-diamidino-2-phenylindole (Sigma-Aldrich USA) prior to counting under a fluorescence
microscope, after Porter & Feig (1980). Slides were prepared by filtering 10 - 20 ml of stained water through duplicate 0.2 μm black polycarbonate filters (Millipore USA). Slides were counted under an epifluorescence microscope (Olympus U-RFL, Olympus USA) using MetaMorph Microscopy software (Molecular Devices USA); 10 fields of view were counted per slide, with duplicate slides made for water depth at each station.
Bacterial protein production was measured by 3
H-leucine incorporation (Kirchman et al. 1985; Kirchman 2001). Water from each depth at each station, along with autoclaved control water, was amended aboard ship with 3
H-leucine to a final concentration of 20 nM. Samples were incubated for 1-2 hours; following this incubation period, reactions were terminated using 100% trichloroacetic acid (TCA). Samples were then concentrated and washed with 80% ethanol following Kirchman (2001) before drying over night. Samples were then amended with
scintillation liquid and allowed to sit for a 2-day period before analysis in a scintillation counter (Perkin Elmer TriCarb 3110 TR).
Dissolved Organic Carbon & Total Dissolved Carbohydrate Analyses
Water samples collected aboard shipat surface (CBM, CHO, CLN) and
GF-prefilter syringe filter (Sartorius Stedim Biotech, Germany) into pre-combusted glass scintillation vials and frozen at -20°C until further analysis.
Dissolved organic carbon concentrations from these samples were measured via high temperature catalytic oxidation and non-dispersive infrared detection on a Shimazdu TOC-L series instrument (Shimadzu Corp. Kyoto). Samples were acidified to a pH <2 and sparged with commercially obtained CO2 free, zero-grade air for 10 minutes to remove inorganic carbon. Standards were generated from dilution of commercially prepared potassium hydrogen phthalate [KHP] (La-Mar-Ka Inc., Baton Rouge, LA) with 18.2 MΩ ultrapure water.
Total carbohydrate concentrations were determined from the filtered, frozen water samples using the phenol-sulfuric acid assay (Du Bois et al. 1956). Aliquots of the thawed sample water were combined with concentrated, commercial-grade sulfuric acid and 5% phenol solution and absorbance was measured at 490 nm using a Genesys 10S UV-Vis spectrophotomer (Thermo Scientific, USA).
RESULTS
Station Environment
The three stations showed distinct contrasts in physical and chemical characteristics. Station CBM surface water was the coldest, freshest water of all the stations sampled, with a surface temperature and salinity of 16.4° C and 29.3 PSU, respectively (Fig. 24b, c).
m (Fig. 24a). At Stn. CHO, surface water salinity and temperature (36.2 PSU and 26.4°C,
respectively; Fig. 24b, c) were consistent with origin from a Gulf-Stream eddy. Temperature and salinity data indicated that the upper 20 m of this station were well mixed, where temperature and salinity decreased with depths from 20 – 60 m, reaching temperature and salinity of 21.4° C and 35.3 PSU at a depth of 61 m. Beam attenuation data showed a slight decrease in
transmittance from 85% at the surface to 80% near the bottom (Fig. 24a). Station CLN was shallow (depth of 12.5 m) and well mixed. Surface water temperature was 19.1° C (Fig. 24b), and salinity was similar to surface water at Stn. CHO, at 34.7 PSU (Fig 24c). Beam attenuation showed 70% transmittance throughout the water column (Fig. 24a).
DOC and Total Dissolved Carbohydrates
DOC concentrations varied considerably among sites and depths, with Stn. CLN having both the greatest DOC and total dissolved carbohydrate concentrations in the surface waters (381 μM and 86 μM, respectively, Table 2). DOC concentrations in the surface waters were next
CBM surface waters had the smallest DOC concentration of all the stations, it had the greatest contribution of total dissolved carbohydrates to DOC. The contribution of total dissolved
carbohydrates to DOC at the particle-maximum depth was also greater at Stn. CBM as compared to Stn. CHO.
Bacterial Abundance and Protein Production
Bacterial abundances did not vary greatly among the three stations and depths. Stns. CBM and CLN had very similar bacterial abundances in the surface waters (1.75 x 10⁸
cells liter -1
and 1.83 x 10⁸
cells liter-1
, respectively) (Fig. 25a). While Stn. CBM had more bacterial cells in the surface waters, Stn. CHO had almost identical bacterial abundance in surface and particle-maximum depths (between 1.38 – 1.39 x 10⁸
cells liter-1
, Fig. 25a, b). Bacterial abundances at the particle-maximum depth for Stns. CBM and CHO were also very similar (Fig. 25b).
Unlike bacterial abundance, bacterial protein production varied greatly between stations and depths, on a per-cell as well as per-liter basis. Stn. CLN had the greatest bacterial production rates (on a per-cell as well as per-liter basis) of all the surface waters, at 287 x 10-8 ng C cell-1 hour-1
and 525 ng C liter-1 hour-1
, respectively. (Fig. 26a, Table 3). These rates were nearly double the bacterial production of the bacterial community in Stn. CBM’s surface waters, and over 20 times greater than surface water production at Stn. CHO. Bacterial production rates at the surface were slightly higher than at the particle-maximum depth for Stn. CBM (290 ng C liter-1
hour-1
versus 212 ng C liter-1 hour-1
, respectively, Fig. 26a, b; Table 3). The same trend was seen between the surface and particle-maximum depths at Stn. CHO, although the difference between rates was less (Fig. 26a, b; Table 3).