COMPILER OPTIMIZATION EFFECTS ON REGISTER COLLISIONS
A Thesis presented to
the Faculty of California Polytechnic State University, San Luis Obispo
In Partial Fulfillment
of the Requirements for the Degree Master of Science in Computer Science
by Jonathan Tan
c 2018 Jonathan Tan
COMMITTEE MEMBERSHIP
TITLE: Compiler Optimization Effects on Register Collisions
AUTHOR: Jonathan Tan
DATE SUBMITTED: June 2018
COMMITTEE CHAIR: Aaron Keen, Ph.D.
Professor of Computer Science
COMMITTEE MEMBER: Theresa Migler, Ph.D.
Professor of Computer Science
COMMITTEE MEMBER: John Seng, Ph.D.
ABSTRACT
Compiler Optimization Effects on Register Collisions Jonathan Tan
ACKNOWLEDGMENTS
Thanks to:
• My advisor, Aaron Keen, for guiding, encouraging, and mentoring me on the thesis and classes. Words cannot describe the impact you had on me.
• My committee members (John Seng and Theresa Migler) for taking time out of their busy schedules to help better my thesis.
• My many great professors that taught me so many invaluable lessons.
• My Dad, Mom, and Brother (Jeffrey Tan, Shirley Her, and Benjamin Tan) for taking care of me and calling me to check in and see how I am doing.
• My roomates (Andrew Kim, Michael Djaja, Dylan Sun, Pierson Yieh) for en-couragement to push through the hard times and the great times.
TABLE OF CONTENTS
Page
LIST OF FIGURES . . . viii
CHAPTER 1 Introduction . . . 1
1.1 Register Collisions . . . 1
1.2 Optimizations . . . 3
1.3 Motivation . . . 4
1.4 Contributions . . . 4
2 Background & Related Works . . . 5
2.1 Control-Flow Graph . . . 5
2.2 Live Ranges . . . 6
2.3 Register Allocation . . . 8
2.3.1 Interference Graph . . . 9
2.3.2 Graph Coloring . . . 10
2.4 Related Works . . . 11
2.4.1 Heuristics . . . 11
2.4.2 Graph Coloring Algorithm . . . 11
3 Setup & Experimental Design . . . 13
3.1 Clang and LLVM . . . 13
3.2 Aggregation . . . 17
3.3 Benchmarks . . . 18
4 Results & Analysis . . . 20
4.1 Baseline Graph Anaylsis . . . 21
4.1.1 Average Register Collisions Across Functions . . . 21
4.1.2 Maximum Register Collisions Across Functions . . . 22
4.1.3 Register Collisions Across Registers . . . 24
4.1.4 Stack Space . . . 28
4.2 All-Loops Configuration . . . 28
4.2.2 All-Loops Optimization Off . . . 32
4.3 General Observations . . . 35
4.3.1 Stack Space On Optimization . . . 36
4.3.2 Stack Space Off Optimization . . . 40
4.4 Double Optimizations . . . 41
4.4.1 All-Loops and Argpromotion Optimization . . . 42
4.4.2 Licm and All-loops Optimization . . . 45
4.4.3 Licm and Argpromotion Optimization . . . 50
4.5 Thumb Architecture . . . 52
4.5.1 All-Loops Optimization . . . 52
4.5.2 Jump-threading and Early-cse-memssa Optimization . . . 56
4.5.3 Spills Between Architectures . . . 57
5 Future Works & Conclusion . . . 61
5.1 Future Works . . . 61
5.1.1 Subject Optimizations . . . 61
5.1.2 Optimization Combinations . . . 61
5.1.3 Register Allocator . . . 61
5.1.4 Timings . . . 62
5.1.5 Architectures . . . 62
5.2 Conclusion . . . 62
BIBLIOGRAPHY . . . 64
APPENDICES A -O3 Optimization List . . . 67
B ARM Double Optimization Numbers . . . 69
C Register Collision Graphs . . . 70
LIST OF FIGURES
Figure Page
1.1 Example of the loop-unrolling compiler optimization. Left side is
original loop. Right side is with loop-unrolling applied. . . 2
2.1 Example of creating a CFG given a program . . . 6
2.2 Example of a live range with virtual registers . . . 7
2.3 Example of Non-SSA form when compared to SSA form . . . 8
2.4 Example of why SSA may be beneficial . . . 9
4.1 Average Reg Collisions by Function, Baseline All Subject Optimizations Off, No Minimum Register Collisions Threshold . . . 21
4.2 Average Reg Collisions by Function, Baseline All Subject Optimizations On, No Minimum Register Collisions Threshold . . . 22
4.3 Baseline Average Register Collisions by Function . . . 23
4.4 Baseline Maximum Register Collisions by Function . . . 25
4.5 Baseline Register Collisions by Register . . . 26
4.6 Baseline Stack Space . . . 27
4.7 Average Register Collisions by Function, All-Loops On . . . 29
4.8 Maximum Register Collisions by Function, All-Loops On . . . 30
4.9 Register Collisions by Register, All-Loops On . . . 30
4.10 Stack Space All-Loops On . . . 31
4.11 Average Register Collisions by Function, All-Loops Off . . . 33
4.12 Maximum Register Collisions by Function, All-Loops Off . . . 33
4.13 Register Collisions by Register, All-Loops Off . . . 34
4.14 Stack Space All-Loops Off . . . 35
4.15 x86 Average Register Collisions by Function, Collision Statistics (Percentage at or Below Threshold) . . . 36
4.16 x86 Maximum Register Collisions by Function, Collision Statistics (Percentage at or Below Threshold) . . . 37
4.17 x86 Register Collisions by Register Statistics (Percentage at or Below Threshold) . . . 37
4.19 Stack On Tail Call Elimination . . . 39
4.20 Stack Off LICM . . . 40
4.21 x86 Double Optimization Average Collisions by Function, Collision Statistics (Percentage at or Below Threshold) . . . 42
4.22 x86 Double Optimization Maximum Collisions by Function, Collision Statistics (Percentage at or Below Threshold) . . . 42
4.23 x86 Double Optimization Register Collisions by Registers, Collision Statistics (Percentage at or Below Threshold) . . . 43
4.24 Register Level On All-Loops and Argpromotion . . . 44
4.25 Register Collisions by Register Level Off All-Loops and Argpromotion . . . 45
4.26 Stack On All-Loops and Argpromotion . . . 46
4.27 Stack Off All-Loops and Argpromotion . . . 46
4.28 Stack On Licm and All-Loops . . . 48
4.29 Stack Off, Licm and All-Loops . . . 49
4.30 Stack On, Licm and Argpromotion . . . 51
4.31 Stack Off Licm and Argpromotion . . . 51
4.32 Thumb Average Register Collisions by Function Statistics . . . 53
4.33 Thumb Maximum Register Collisions by Function Statistics . . . . 53
4.34 Thumb Register Collisions by Register Statistics . . . 54
4.35 ARM Average Register Collisions by Function, All-loops Off . . . . 55
4.36 ARM Stack Space All-loops Off . . . 55
4.37 ARM Average Register Collisions by Function, Off Early-CSE-Memssa . . . 57
4.38 ARM Average Register Collisions by Function, Off Jump-Threading . . . 58
4.39 ARM Stack Space Off Early-CSE-Memssa . . . 59
4.40 ARM Stack Space Off Jump-Threading . . . 59
4.41 Number of Spills in the x86 Architecture . . . 60
4.42 Number of Spills in the Thumb Architecture . . . 60
B.1 THUMB Average Register Collisions by Function Statistics . . . 69
B.2 THUMB Maximum Register Collisions by Function Statistics . . . 69
C.1 x86 Average Register Collisions by Function, Off Licm . . . 70
C.2 x86 Average Register Collisions by Function, On Licm . . . 71
C.3 x86 Maximum Register Collisions by Function, On Licm . . . 71
C.4 x86 Maximum Register Collisions by Function, Off Licm . . . 72
C.5 x86 Register Collisions by Register, On Licm . . . 72
C.6 x86 Register Collisions by Register, Off Licm . . . 73
C.7 x86 Average Register Collisions by Function, Off Tail Call Elimination . . . 73
C.8 x86 Average Register Collisions by Function, On Tail Call Elimination . . . 74
C.9 x86 Maximum Register Collisions by Function, Off Tail Call Elimination . . . 74
C.10 x86 Maximum Register Collisions by Function, On Tail Call Elimination . . . 75
C.11 x86 Register Collisions by Register, Off Tail Call Elimination . . . . 75
C.12 x86 Register Collisions by Register, On Tail Call Elimination . . . . 76
C.13 x86 Stack Space, Off Tail Call Elimination . . . 76
C.14 x86 Average Register Collisions by Function, Off All-Loops and Argpromotion . . . 77
C.15 x86 Average Register Collisions by Function, On All-Loops and Argpromotion . . . 77
C.16 x86 Maximum Register Collisions by Function, Off All-Loops and Argpromotion . . . 78
C.17 x86 Maximum Register Collisions by Function, On All-Loops and Argpromotion . . . 78
C.18 x86 Average Register Collisions by Function, On Licm and All-Loops . . . 79
C.19 x86 Average Register Collisions by Function, Off Licm and All-Loops . . . 79
C.20 x86 Maximum Register Collisions by Function, On Licm and All-Loops . . . 80
C.21 x86 Maximum Register Collisions by Function, Off Licm and All-Loops . . . 80
C.23 x86 Register Collisions by Register,
Off Licm and All-Loops . . . 81 C.24 x86 Average Register Collisions by Function,
On Licm and Argpromotion . . . 82 C.25 x86 Average Register Collisions by Function,
Off Licm and Argpromotion . . . 82 C.26 x86 Maximum Register Collisions by Function,
On Licm and Argpromotion . . . 83 C.27 x86 Maximum Register Collisions by Function,
Off Licm and Argpromotion . . . 83 C.28 x86 Register Collisions by Register,
On Licm and Argpromotion . . . 84 C.29 x86 Register Collisions by Register,
Off Licm and Argpromotion . . . 84 C.30 ARM Average Register Collisions by Function, On All-Loops . . . . 85 C.31 ARM Maximum Register Collisions by Function, On All-Loops . . 85 C.32 ARM Maximum Register Collisions by Function, Off All-Loops . . 86 C.33 ARM Register Collisions by Register, On All-Loops . . . 86 C.34 ARM Register Collisions by Register, Off All-Loops . . . 87 C.35 ARM Stack Space, On All-Loops . . . 87 C.36 ARM Average Register Collisions by Function,
On Early-CSE-Memssa . . . 88 C.37 ARM Maximum Register Collisions by Function,
On Early-CSE-Memssa . . . 88 C.38 ARM Maximum Register Collisions by Function,
Off Early-CSE-Memssa . . . 89 C.39 ARM Register Collisions by Register, On Early-CSE-Memssa . . . 89 C.40 ARM Register Collisions by Register, Off Early-CSE-Memssa . . . 90 C.41 ARM Stack Space, On Early-CSE-Memssa . . . 90 C.42 ARM Average Register Collisions by Function,
On Jump-Threading . . . 91 C.43 ARM Maximum Register Collisions by Function,
On Jump-Threading . . . 91 C.44 ARM Maximum Register Collisions by Function,
C.45 ARM Register Collisions by Register, On Jump-Threading . . . 92 C.46 ARM Register Collisions by Register, Off Jump-Threading . . . 93 C.47 ARM Stack Space, On Jump-Threading . . . 93 D.1 Number of Spills in the x86 Architecture
(Double Optimizations) . . . 94 D.2 Number of Spills in the ARM Architecture
Chapter 1 INTRODUCTION
The main purpose of a compiler is to generate code. It is generally desirable that the resulting code is fast. Multiple factors contribute to the performance of the generated code. Of utmost importance is proper utilization of the memory hierarchy and registers, in particular. Accessing a value in a register is orders of magnitude faster than retrieving a value from memory [12]. In addition, optimizing compilers transform the code to improve processor utilization. This thesis explores the effects of optimizations on register utilization.
To generate code, there are many phases that the compiler will go through to translate a high-level language such as Java or C into low-level assembly. This chapter gives a high-level overview of the compiler process, the optimizations, the motivation, and the contributions of this thesis.
1.1 Register Collisions
the code will run on.
Because the IR may use an unlimited amount of virtual registers, the compiler needs to map these virtual registers to the actual physical registers that the CPU architecture supports. One register allocation technique creates an interference graph where the graph nodes are the virtual registers and the edges represent when the virtual registers will hold values that are used at the same time. The edges in the interference graph are a representation of collisions between virtual registers. Register allocation is then reduced to a graph coloring problem where the physical registers are the colors. This coloring maps the virtual registers to physical registers. The number of edges is also linked to register pressure, which is a measure of the number of values that are simultaneously active or live and will ideally all be mapped to physical registers.
1.2 Optimizations
Code optimization is one of the many phases of the compiler that takes place before register allocation. When the code is in its IR, the compiler can perform various optimizations to the IR to improve the final target assembly. Each optimization might affect the use of virtual registers. If there are more virtual registers that are being used at the same time, we say that there is higher register pressure, so increasing the overlap of virtual registers may increase register pressure. Optimizations can also be run multiple times and in different orders to combat certain inefficiencies that other optimizations may introduce into the code and may make the overall code a bit more efficient.
1.3 Motivation
Previous studies have focused on improving the efficiency of register allocation through advanced heuristics [5, 20, 7]. Additionally, researchers have also looked at different ways of coloring the interference graph [8, 11]. This thesis explores how compiler optimizations might affect register pressure and whether the optimizations actually help or hinder the overall performance of the assembly.
1.4 Contributions
Chapter 2
BACKGROUND & RELATED WORKS
This section gives an overview of important background information related to the portion of the compiler that this work focuses on. A more in-depth explanation of the topics can be found in [21].
2.1 Control-Flow Graph
The compiler creates a Control-Flow Graph (CFG) for each function to represent the flow of control through the function and to store instructions. A CFG contains nodes that represents basic blocks of code that may potentially be executed. As control flow constructs, such as anif,else,while, orfor statement, are processed, new nodes are created to hold the instructions that lie within the basic blocks. An edge then connects from the previous node to any new nodes to signify potential paths along which execution of the code can follow.
Figure 2.1: Example of creating a CFG given a program
purposes, but would typically be translated to the IR the compiler is using and could eventually be translated to the target assembly.
2.2 Live Ranges
The compiler represents variables used in the original code and intermediate values as symbolic placeholders or virtual registers in the IR. Virtual registers are used as an abstraction of the actual target architecture. The compiler can potentially use a different number of virtual registers before and after optimizations. The live range of a register is the union of the sequences of instructions from each instruction that defines the register (i.e. targets it) to the last instruction that uses that definition.
Figure 2.2 gives an example of the live ranges of virtual registers. The bars depict the live range of each register. Note that v1 and v2 are not defined by these instructions so their live ranges begin prior to this code segment.
Figure 2.2: Example of a live range with virtual registers
original source code throughout the IR and then allocate one physical register for that virtual register when coloring. This may cause that virtual register’s live range to collide with many other registers and potentially make the graph uncolorable more often because there are less colors available to assign other virtual registers. To mitigate long live ranges, many compilers split the live range when a variable is redefined; this can be accomplished using static single assignment form (SSA). SSA uses a new virtual register each time a new value is computed and each variable definition is then updated within the compiler with that value. When that value is needed for computation again, the compiler will use the most recent virtual register as the representation for that value. This essentially splits the live range for each definition of a value used in the code and makes the resulting interference graph simpler. An example can been seen in Figure 2.3. v3 and v4 are split into new virtual sub-registers each time they are assigned a new value. Note that in this example, under non-SSA v3 conflicts with both v4 and v2. Under SSA, v30 and v2 conflict, but not with v4.
Figure 2.3: Example of Non-SSA form when compared to SSA form
a now has different pieces that intersect with only the other registers in its respective block. Note that the union of the sub-registers ofawill effectively go back to non-SSA form of using one virtual register fora. SSA is primarily beneficial because it encodes the use-def chains (the most recent virtual register that contains the value needed) of the virtual registers and makes analysis and optimizations on the code more efficient [3, 10], but the partitioning of live ranges also provides benefits.
2.3 Register Allocation
Figure 2.4: Example of why SSA may be beneficial
graph coloring algorithm.
2.3.1 Interference Graph
The interference graph contains information about which virtual registers are used concurrently with other virtual registers. In the interference graph, each virtual register is a node, and when the live ranges of two virtual registers intersect at any point in the IR, an edge connects the two corresponding nodes.
the number of edges found in the interference graph.
2.3.2 Graph Coloring
The problem of register allocation as encoded in an interference graph reduces to a graph coloring problem. We want to assign physical registers to the virtual registers and the interference graph denotes when two registers cannot be in the same physical registers. We can then use the physical registers as the colors available to color the interference graph, guaranteeing that adjacent nodes (conflicting virtual regs) are assigned different colors (physical registers).
Graph coloring is an NP-Hard problem [14]. Because of the complexity of coloring a graph, there are a variety of graph coloring algorithms that reduce the time it takes to find a coloring at the cost of not being able to find a coloring unless the graph is simplified. Some of these expand on the original work of Chaitin, such as the Chaitin-Briggs algorithm [4], that focuses on using heuristics for simplifying the graph. Another approach to graph coloring is semidefinite programming that builds on the concept of 3-colorable graphs and approximates how many colors are actually needed to color the graph of k-colors [13].
2.4 Related Works
Some research related to register pressure and allocation focuses on developing heuristics to choose which register to spill or modifying the way the graph coloring algorithm chooses registers to color.
2.4.1 Heuristics
A way to reduce the costs of spills is to use heuristics to choose which register to spill. One heuristic is to look at program structure as a whole to avoid spills from being inserted in a spot that can cause the overall code to slow down. One method, the Callahan-Koblenz algorithm [9], looks at the overall program structure (e.g. the CFG and code blocks) and chooses registers to spill given those properties. It can also choose where to put the spill code to potentially avoid continuous memory accesses from happening within a loop and to choose the more ideal registers to spill.
Other studies try splitting or combining live ranges to change the interference graph presented to the graph coloring algorithm [16]. Another heuristic is to use the properties of nodes in the interference graph as seen in [5, 20, 7]. They look specifically at the interference graph and use properties of the graph to choose which register to spill. Common methods include removing the node with the highest amount of edges to find a coloring faster or analyzing and creating a directed graph from the interference graph to figure out which node can potentially split the graph into smaller subgraphs.
2.4.2 Graph Coloring Algorithm
Chapter 3
SETUP & EXPERIMENTAL DESIGN
To examine the effects that compiler optimizations have on register pressure, we instrument the Clang/llvm compiler to report the number of collisions for each virtual register. Various optimizations are toggled to collect collision data under different configurations. This information is aggregated using Python to present a summary of the results.
3.1 Clang and LLVM
This study uses the llvm version 5.0 ecosystem that has Clang as the C compiler and targetsllvm. To explore the effects of optimizations on register collisions, various configurations of optimizations are explored. Clang has an optimization flag “-O3” that turns on all possible optimizations for the compiler. A complete list of the optimizations that are run with this flag can be found in Appendix A. The set of all possible configurations, however, is too expansive. Instead, this study focuses on configurations from a subset of optimizations deemed to potentially affect register pressure the most, but also considered to be potentially optional. This choice was made to limit the number of configurations with the hope of exposing edge case optimizations.
Below is a list of the optimizations included in this study, each with a short description. These were identified as likely to affect register pressure.
loop-distribute
to isolate the offending dependencies into a new loop for vectorization of remaining parts.
loop-rotate
Put loops into canonical form to expose opportunities for other optimiza-tions.
loop-unroll
Perform loop unrolling utility to duplicate the body of the loop.
loop-unswitch
Transform loops that contain branches on loop-invariant conditions to mul-tiple loops based on a threshold.
loop-vectorize
Combine consecutive loop iterations into a single wide iteration. Index is incremented by SIMD vector width.
argpromotion
Promote “reference” arguments to be “by value” arguments. dse
A trivial dead store elimination that deletes local redundant stores.
early-cse-memssa
An early simple dominator tree walk that eliminates trivially redundant instructions.
Global dead code elimination is designed to eliminate unreachable internal globals from the program.
indvars
Canonicalize induction variables to transform induction variables to sim-pler forms suitable for subsequent analysis and transformation.
jump-threading
Find distinct threads of control flow running through a basic block and if a predecessor of a block can prove to always jump to a successor, the edge is forwarded.
licm
Loop invariant code motion attempts to remove as much code from the body of a loop as possible by hoisting code to a preheader block or sinking code to an exit block if safe.
memoryssa
Provides an SSA based form for memory with def-use and use-def chains for users to find memory operations quickly.
sccp
Sparse conditional constant propagation rewrites provably constant vari-ables with immediate values and constant conditional branches with un-conditional jumps.
Scalar replacement of aggregates breaks up alloca instructions of aggregate types into individual alloca instructions for each member and transforms them into clean scalar SSA form.
tailcallelim
Tail Call Elimination transforms a call from the current function that does not access the stack frame before executing a return instruction into a branch to the entry of the function being called.
Data is collected for the following configurations based on the experiment’s sub-ject optimization. There are two starting baselines. For the first baseline, we have the set of -O3 optimizations turned on with the subject list turned off. We then turn on each of the subjects independently. For the second baseline, we start with the full -O3 optimizations and then turn each of the subjects independently off. Additional experiments were run by combining subjects based on analysis of these initial con-figurations and what we thought would greatly affect register collisions based on the nature of the subjects.
These experiments are conducted over multiple steps. First, a source file to ex-amine is compiled to llvm using clang. This step does not perform any compiler optimizations. The llvm files are then run through opt, with applicable compiler optimization flags, to produce another llvm file with the optimizations applied.
before the coloring algorithm takes place, to report register collisions. The instru-mentation code loops through all possible pairs of virtual registers and calls clang’s overlapsfunction, which returns true if a virtual register overlaps with another one. If it is true, the two registers are logged to a JSON file. Note that the modified llc outputs a JSON file per function and that this information is enough to rebuild the interference graph representation that is used for coloring.
3.2 Aggregation
Once the register information is in the JSON files, a Python script is run to count the number of register collisions and to aggregate the data. To get a sense of the register collisions per function, the maximum number of collisions and the average number of collisions are calculated. This data is analyzed at the function level and across all functions. To see the effects of register collisions at a register level, the number of collisions for each individual register is also calculated. Finally, to see the effects that register collisions may have on stack space, the stack size data is gathered from the generated assembly files. This is done by processing the assembly file for the comment “-byte spill”, which indicates that there is spill code inserted at that line in the code. This comment also includes a number before indicating how many bytes were allocated on the stack for the spill so we sum the bytes together.
3.3 Benchmarks
The benchmarks include programs from the SPEC CPU2000 Benchmarks [2] and programs downloaded from Github. This set represents a sampling of real-world programs. Below is a list of the programs along with a brief description of what they do:
164.gzip- GNU zip compression algorithm.
175.vpr- Versatile place and route algorithm for an integrated circuit computer-aided design program.
176.gcc- Gcc version 2.7.2.2 that generates code for a Motorola 88100 proces-sor.
181.mcf - Derived from a program used for single-depot vehicle scheduling in public mass transportation.
186.crafty - High-performance computer chess program made around a 64-bit word.
197.parser- Link grammar parser is a syntactic parser of English, based on a link grammar.
253.perlbmk- A cut-down version of perl v5.005 03, the once popular scripting language.
254.gap- A standard gap-speed benchmark exercising combinatorial functions, a big number library, and test functions for a finite field.
256.bzip2 - Compression and decompression algorithm extending bzip that performs no file I/O other than reading input.
300.twolf - Algorithm that determines placement and local connections for groups of transistors which constitute the microchip.
capnproto- A protocol for sharing data capabilities.
ccv - A portable modern computer vision library.
CHL - A hypertext library for writing web applications in C.
crypto-algorithms - Standard implementations of cryptographic algorithms such as AES and SHA1.
dht- A variant of Kademlia distributed hash table used in a bittorrent network.
hiredis - A minimalistic C client library for the Redis database.
http-parser- A Parser for HTTP messages in C that parses both requests and responses.
huffman - An implementation of the huffman lossless data compression algo-rithm.
Kore - A scalable and secure web application framework for writing web APIs in C.
lz4- A fast lossless compression algorithm.
SilverSearcher - A code searching tool similar to ack with a focus on speed.
SQLite - A lightweight portable database system written in C.
Chapter 4
RESULTS & ANALYSIS
This section covers the results of each configuration of optimizations. We start by covering the baseline configuration (i.e. average register collisions across functions, maximum register collisions across functions, register collisions across registers, and the stack space). We then move onto analyzing specific configurations that give interesting results and then discuss general trends. Analysis of the effects of two optimizations toggled on or off together follows. We conclude by comparing the x86 architecture to the Thumb (ARM) architecture to see if there are any interesting differences between them.
The graphs include a line at the 16 and 32 register collision points because these are common sizes for a processor’s register file. For example, on the x86-64 architecture, there are 32 registers available, but only about 16 are used for the current program running. Note that some of those 16 registers are reserved for the stack pointer, program counter, and passing variables to functions to run the program so the actual registers available may actually be less.
contribu-tors, among a couple of others, to cause larger numbers to appear in the graphs. For register collisions by register, we include every single register regardless of whether the function met the requirements.
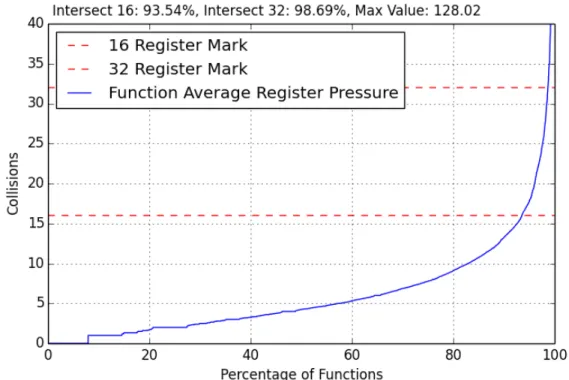
Figure 4.1: Average Reg Collisions by Function, Baseline All Subject Optimizations Off, No Minimum Register Collisions Threshold
4.1 Baseline Graph Anaylsis
4.1.1 Average Register Collisions Across Functions
Figure 4.2: Average Reg Collisions by Function, Baseline All Subject Optimizations On, No Minimum Register Collisions Threshold
number of collisions that occur in average register collisions however, increased from 128.02 to 137.62 collisions from optimizations off to on, respectively.
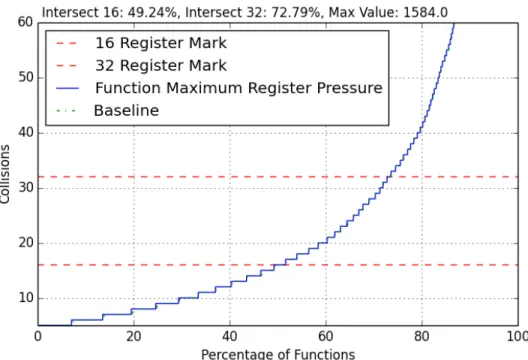
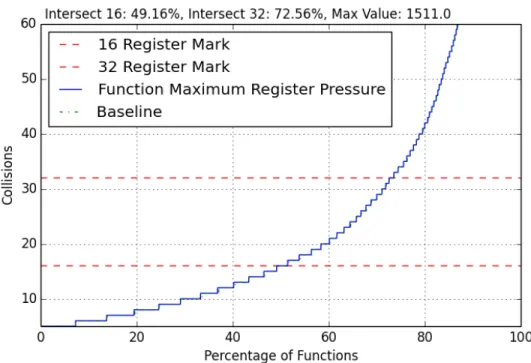
4.1.2 Maximum Register Collisions Across Functions
(a) Average Reg Collisions by Function, Baseline All Subject Optimizations Off
(b) Average Reg Collisions by Function, Baseline All Subject Optimizations On
optimizations actually caused an extra 0.11% of functions to now meet the 16 collisions mark. Overall on the graph, there are slight shifts of the line to the right signifying smaller maximum values for a few functions. Functions towards the 80-100% range do seem to increase slightly in maximum register collisions (line is slightly towards the left). Looking at the maximum value in the graph, there was an in increase from 1463 to 1577 collisions, so the optimizations did increase the maximum collisions for a function by a significant amount in that range.
4.1.3 Register Collisions Across Registers
The baseline for average register collisions on the register level has a slight differ-ence as seen in Figures 4.5b and 4.5a. All subject optimizations on when compared to all subject optimizations off increases the amount of collisions that happen. The data shows that 0.88% of registers are increased to above or at the 16-intersection line, 0.54% of registers are increased to above or at the 32-intersection line, and the maximum collisions has increased by 114.
(a) Maximum Reg Collisions by Function, Baseline All Subject Optimizations Off
(b) Maximum Reg Collisions by Function, Baseline All Subject Optimizations On
(a) Register Collisions by Register, Baseline Subject Optimizations Off
(b) Register Collisions by Register, Baseline Subject Optimizations On
(a) Stack Space Baseline All Subject Optimizations Off
(b) Stack Space Baseline All Subject Optimizations On
4.1.4 Stack Space
The stack space caused by spills differed by a significant amount when comparing the configurations for all subject optimizations on versus all subject optimizations off. By turning on optimizations, about 2.7% of functions have more spills and their stack space allocated increased. The maximum stack space increased from 1876 bytes for no optimizations to 3352 bytes for having all optimizations on.
The stack space data agrees with the rest of the baseline graphs. Generally, having subject optimizations on increased the amount of register collisions that occured at the function and register level. At the function level, it increased certain functions slightly. At the register level, it caused more registers to collide with each other. The maximum number of collisions also increases by 114 and thus it causes the stack space to increase. This shows that although compiler optimizations are meant to help clean up code and make it more efficient, it may actually hinder performance by introducing many spills.
4.2 All-Loops Configuration
For this configuration, any optimizations that have to deal with loops are grouped and toggled on or off together. The optimizations grouped together include: loop-distribute, loop-rotate, loop-unroll, loop-unswitch, and loop-vectorize.
4.2.1 All-Loops Optimization On
line and maximum value stayed the same.
Figure 4.7: Average Register Collisions by Function, All-Loops On
Looking at the maximum register collisions in Figure 4.8, the all-loops optimiza-tion also did not seem to change much from the baseline. It increased maximum register collisions by function overall by 0.01% at the 16-collisions line and by 0.02% at the 32-collisions line. All-loops very slightly increases register collisions by function for a few functions.
The results of all-loops increasing register collisions can be seen in Figure 4.9. At the register level, all-loops does not seem to affect register collisions at all. The line created by turning the subject optimization on does not seem to change the amount of register collisions or changes an insignificant amount of them to notice from the graph.
Figure 4.8: Maximum Register Collisions by Function, All-Loops On
Figure 4.10: Stack Space All-Loops On
these changes. In the assembly code, the number of registers stayed the same, but the placement of their live-ranges was shifted. To cause the spill, the live ranges were probably shifted in such a way that the coloring algorithm had to spill to be able to color the interference graph. Another reason why register collisions did not shift much is probably the lack of other optimizations. The loop optimizations may depend on other optimizations to open up opportunities for the optimization to be able to actually be useful to register collisions.
4.2.2 All-Loops Optimization Off
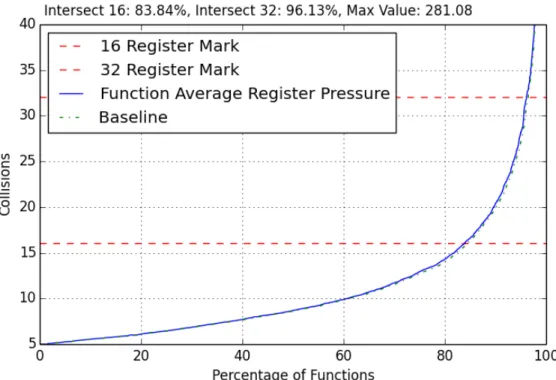
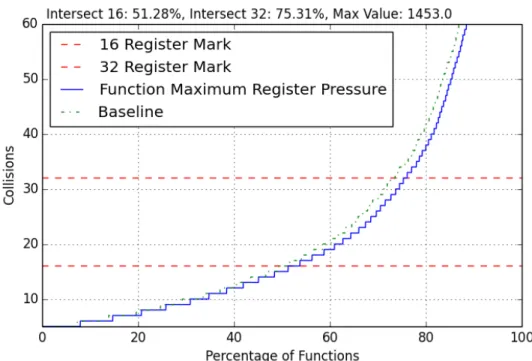
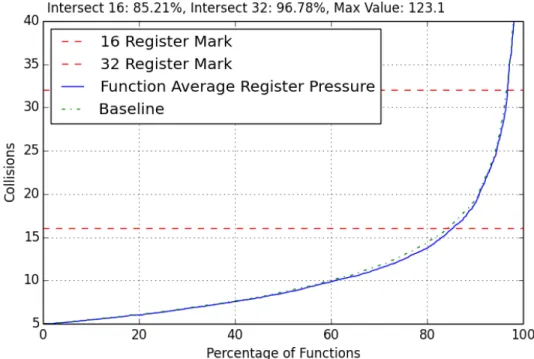
Togglingall-loops off helps functions reduce average register collisions by function from the 40-95% range as seen in Figure 4.11. This is seen by observing that the line moves to the right of the original baseline. This means that not having any loop opti-mizations actually helps reduce average register collisions for many functions. 1.03% of functions were now able to meet the 16-register collision mark when compared to having all subject optimizations on. The 32-collisions threshold changes slightly by 0.22% more functions that now meet that mark. The maximum register collisions was also reduced from 137.62 to 123.1 collisions between the baseline and all-loops configuration.
Figure 4.11: Average Register Collisions by Function, All-Loops Off
The register collisions at the by-register level behave as one would expect when following the pattern of what has been happening in the average and maximum reg-ister collisions by-function as seen in Figure 4.13. When all-loops is turned off, the register collisions are decreased by a small amount for a small percentage of regis-ters. About 1.29% of registers are shifted downward to meet the 16-collisions line and 0.51% of registers are also shifted downward to meet the 32-collisions line. Looking at the maximum value, the number of collisions is reduced by 3.
Figure 4.13: Register Collisions by Register, All-Loops Off
assembly code, the registers did not have their live ranges shifted around from the loop optimizations, so the spills that occur within the loops are not observed. The general difference of the structure of the code is that the spills occur outside of loops, in the header, or other blocks because of the other optimizations affecting the code.
Figure 4.14: Stack Space All-Loops Off
4.3 General Observations
vice versa for “On”. For baseline “Off”, nothing is turned off or they are all on and vice versa for “On”. Looking at the tables, many of the optimizations give about roughly the same results, with the exception of a few, when comparing the numbers between each single toggle optimization. In particular,argpromotion seemed to have the highest change in average register collisions by function and reduced it. Jump-threading seemed to change the maximum register collisions the most for the maximum column. It has 1577 collisions (the highest increase) when turning it on and 1514 collisions when turning it off. Licm is another interesting optimization that seemed to deviate from the pattern of the other optimizations in register collision by registers. Many of the other optimizations have around 72.6% of functions that hit the 16-collisions line when turning it off, but licm is at 73.24% of functions that hit the 16-collisions line (slightly below the value of all-loops).
Figure 4.15: x86 Average Register Collisions by Function, Collision Statistics (Percentage at or Below Threshold)
4.3.1 Stack Space On Optimization
Figure 4.16: x86 Maximum Register Collisions by Function, Collision Statistics (Percentage at or Below Threshold)
Figure 4.18: Stack On LICM
slightly, but most of the maximum values stayed the same. Jump-threading is an optimization that did reduce stack space for many of the functions and reduces the maximum stack space by 128 bytes. Turning this optimization on gave the best result in terms of stack space when compared to the stack spaces created by other optimizations.
The optimization that seemed to increase the stack space the most for many functions is licm followed by tailcallelim as seen in Figure 4.18 and 4.19. The full graphs for these can be found in Appendix C.1 - C.6 and C.7 - C.13.
it changes multiple recursive calls into one recursive call, with an extra branch that jumps back to the original block and creates a loop. In a particular example, found in huffman, tailcallelim actually caused an extra spill to occur because of the loop back into the block.
Generally, both of these optimizations move code from blocks to other blocks or create more blocks to increase performance, and they both end up increasing the amount of spills by the greatest amount according to the graphs. A possible cause could be the way that these optimizations move code around. They extend live ranges for certain registers and may affect the interference graph in such a way that it causes the graph coloring algorithm to spill more before it actually becomes colorable.
Figure 4.20: Stack Off LICM
4.3.2 Stack Space Off Optimization
4.4 Double Optimizations
After looking at the single optimization configuration, we take a closer look at the effects of turning two optimizations on or off concurrently. Again, the combinations of optimizations is numerous, so we choose the more interesting optimizations based on the results from the single optimization analysis and choose the second optimization based on what we think will help reduce collisions. All-loops is one of the more interesting optimizations and we thought that argpromotion would be beneficial to replace any memory references that may be happening within a loop and reduce the amount of extra allocas in the code. This would reduce the amount of extra registers needed within a loop and may reduce spills from happening. Memoryssa would also be another beneficial option to reduce any multiple memory access operations happening within a loop, so we also pair that withall-loops.
Licm is another interesting optimization because it causes many spills and reduces many spills when turned off. We pair it with all-loops to see if having loop optimiza-tions would help the purpose of licm, which is to take as much code out of the loop block. Having code out of the loop block and then applying the loop optimizations, can help reduce the amount of registers being used in a loop. For example, loop-unroll would duplicate less code found within the loop and can potentially reduce stack space used. Additionally, we also wanted to pair licm with argpromotion to see if it would reduce the number of register collisions, help simplify the interference graph, and reduce the stack space allocated similarly toall-loops.
test a pair of optimizations that does not include all-loops.
Figures 4.21, 4.22, and 4.23 show the data collected in general for having two op-timizations on. Note that some of the graphs in these sections are found in Appendix C.
Figure 4.21: x86 Double Optimization Average Collisions by Function, Collision Statistics (Percentage at or Below Threshold)
Figure 4.22: x86 Double Optimization Maximum Collisions by Function, Collision Statistics (Percentage at or Below Threshold)
4.4.1 All-Loops and Argpromotion Optimization
Figure 4.23: x86 Double Optimization Register Collisions by Registers, Collision Statistics (Percentage at or Below Threshold)
the average register collisions by function graph seen in Appendix C.15, the line stayed the same when compared to turning on only all-loops. Looking closely at the graph, there is a slight change in average register collisions by function, but the change is very little. In the maximum register collisions by function graph in Appendix C.17, there was very little change; 0.14% of functions were moved above or at the 16-collisions line, 0.04% of functions were moved above or at for the 32-collisions line, and it seems that a few functions have a small increase in maximum register collisions after the 32-collisions mark. The maximum register collisions by function maximum value also did increase from 1463 to 1511 collisions.
Figure 4.24: Register Level On All-Loops and Argpromotion
can be seen in register collisions by register where some of the registers are reduced in register collisions by having the optimizations off. 0.01% extra functions now meet the 16-collisions line (small decrease in collisions), but most of the other registers stay the same or move slightly down.
Figure 4.25: Register Collisions by Register Level Off All-Loops and Argpromotion
however, remains the same even though the maximum collisions increased. Turning off both optimizations, the stack sizes have slight portions where the stack size for the functions increase and other portions where the stack size for the functions decrease. The overall change is very insignificant and the graph looks very similar to the stack space of only turning all-loops off. Turning off these optimizations both increased and decreased register collisions in functions in our benchmarks.
4.4.2 Licm and All-loops Optimization
Figure 4.26: Stack On All-Loops and Argpromotion
function when turning the optimization off and comparing it to its respective baseline. The graphs forlicm can be found in Appendix C.1 - C.6. Whenlicm is turned on and compared to the baseline on, the average register collisions by function is reduced and 0.62% of functions meet the 16-collisions line or a decrease in collisions. The number of functions that decrease in register collisions is a smaller number as we look at the 32-collisions line, only 0.04% of additional functions now meet it. There is a slight increase in register collisions from the 95-98% range and the maximum value for the average is decreased by 3.22 collisions. For maximum register collisions by function, many functions experienced a decrease in register collisions. 1.87% of functions now meet the 16-collisions line and 2.53% of functions now meet the 32-collisions line. The maximum value was also decreased by 3 collisions. For register collisions by register, 0.7% of registers were reduced in register collisions at the 16-collisions line and 0.14% of registers were reduced in register collisions at the 32-collisions line. The stack space created, however, does not agree with the trend of the decrease in the amount of register collisions. Many of the stack spaces for functions were actually increased slightly. This is probably because of the change in live ranges that licm causes by shifting registers higher or lower than they are, meaning that in this case, register collisions may not be the best indicator of what the stack space is like.
Turning off licm individually did not significantly change the lines for register collisions, but the stack size decreased for functions overall. When compared to the baseline, the maximum stack space was reduced by 1356 bytes.
to right about where the baseline curve is, for all optimizations off. At the register collisions by register level, it pushes many register collisions to where the baseline is except for around the 65% range where the line goes above the baseline. The maximum register collision is also increased by 2 collisions.
Figure 4.28: Stack On Licm and All-Loops
The change in stack space as a result from spills in the code seems to follow the pattern of register collisions graph. This can be seen in Figure 4.28. Compared to licm in Figure 4.18, more functions around the 40-78% range were decreased and after the 78% mark, the number of collisions increases. The maximum value for stack space however is reduced from 2175 to 1987 bytes meaning for a few functions using all-loops with licm helps reduce spills.
The maximum register collisions by function decrease overall and the maximum value decreases by 3 registers. The register collisions by registers also decrease very slightly overall and the maximum value is decreased by also 3 registers.
Figure 4.29: Stack Off, Licm and All-Loops
4.4.3 Licm and Argpromotion Optimization
To see how an optimization performs without all-loops, we pair licm and arg-promotion. The graphs can be seen in Appendix C.24 - C.29. When turning both optimizations on over the baseline, the average register collisions by function seems to decrease slightly from the 20-90% range and it increases slightly after that. For maximum register collisions by function, the results stay mostly the same compared to just turning licm on, but the maximum register collisions shot up from 1460 to 1574. Having argpromotion seems to be deterimental to some functions seen at the 16-collisions line, 0.02% of functions do not make the line anymore, but at the 32-collisions line, 0.17% more functions make it so it helps other functions. For register collisions at the register level, the number of collisions slightly increased across all registers. Having argpromotion on actually causes more spills in the stack space as seen in Figure 4.30. In the 42-50% function range, the stack space decreases when compared to only having licm on, but the rest of the function after that percentage have an increased stack space and the maximum spill space increases from 2175 to 2840 bytes. This agrees with what we see in some of the register collisions trends. For some functions, the register collisions decreased when compared to just licm and the rest of the functions increased in register collisions increased and the maximum register collisions also increase.
Figure 4.30: Stack On, Licm and Argpromotion
left when compared to the stack space when just licm is off. This agrees with the slight increase in register collisions that we see in the graphs. Looking at the assembly code files, there was not much of a difference in the structure of the code that licm affected, which means that a small percentage of functions may have just shifted down to zero, pushing the rest of the functions to the right a little and keeping the same stack space.
4.5 Thumb Architecture
After looking at how register collisions affect spills in the x86 architecture, we wanted to see the effects on the ARM architecture. The main reason for this is because x86 contains add and subtract instructions that can directly access memory to get the values, so counting the occuring spills may not be accurate. We also wanted to see how the optimizations may affect the number of collisions and if the spills may differ due to different instruction set architectures.
We target the Thumb architecture, which is a subset of ARM, and apply the same process used in the x86 architecture. The general results can be seen in Figure 4.32, 4.33, and 4.34.
4.5.1 All-Loops Optimization
Figure 4.32: Thumb Average Register Collisions by Function Statistics
Figure 4.34: Thumb Register Collisions by Register Statistics
Figure 4.35: ARM Average Register Collisions by Function, All-loops Off
4.5.2 Jump-threading and Early-cse-memssa Optimization
Early-cse-memssa is an optimization that did not really affect register collisions on the x86-64 architecture, but deviates from the pattern of other optimizations in the ARM architecture. Whenearly-cse-memssa is turned off, for the average register collisions by function, it has the lowest maximum average value when compared to the other optimizations that are on. This can be seen in Figure 4.37. It also has the lowest functions that meet the 16-collisions line or the highest register collisions at 83.19%. This was slightly different in the x86 architecture where early-cse-memssa seemed to fit in more with the trend of the other optimizations.
Jump-threading is another interesting optimization that seemed to keep the trend across architectures. When turning off jump-threading, it seemed to have one of the higher maximum average register collisions by function (right under all-loops) as seen in Figure 4.38. This is similar to x86-64, where jump-threading also has one of the higher maximum average register collisions by function (right under indvars). When we turn onjump-threading individually in x86-64, it ended up with the highest maximum value for the maximum register collisions by function values (1577 register collisions). This is the same for the ARM architecture where it still ended up being the highest with 3544 collisions (right under the baseline of 3552 colisions).
Figure 4.37: ARM Average Register Collisions by Function, Off Early-CSE-Memssa
4.5.3 Spills Between Architectures
Because Thumb is a 32-bit architecture, the amount of stack space caused by spills will be very different when compared to x86-64. The amount of stack space caused by spills in the x86-64 architecture on average is 2028.12 bytes for turning subject optimizations on and is 2913.82 bytes for turning subject optimizations off. For Thumb’s stack space average, turning subject optimizations on is 858.59 bytes and turning subject optimizations off is 875.06 bytes. To get a better sense of how many spills occur between architectures, we count the number of spills instead of counting the stack sizes allocated as seen in Figure 4.41 and 4.42.
Figure 4.38: ARM Average Register Collisions by Function, Off Jump-Threading
Figure 4.39: ARM Stack Space Off Early-CSE-Memssa
Figure 4.41: Number of Spills in the x86 Architecture
Chapter 5
FUTURE WORKS & CONCLUSION
5.1 Future Works
5.1.1 Subject Optimizations
The entire optimization list can be found in the appendix of this paper. A pos-sible future work would be to consider toggling the more traditional, less optional optimizations to measure their effects on register collisions and spills. This paper only looks at what we think may affect pressure the most based on what they do, but there may be other optimizations that may prove to be interesting after analysis.
5.1.2 Optimization Combinations
Further optimization combinations should be explored. Because there are many different combinations for turning on and off optimizations and looking at turning on a number of optimizations and coupling them together, this is left as a possible future work. It would be interesting to see which optimizations help clean up inefficiencies that other optimizations expose to make the overall code more efficient.
5.1.3 Register Allocator
graph for each register allocator used.
5.1.4 Timings
Profiling execution time as correlated with different optimizations and register collisions would provide another metric to compare optimization efficacy. This would allow one to explore the tradeoffs between spills and transformations.
5.1.5 Architectures
Finally, it would be interesting to see the effects of optimizations across different architectures. This paper looks at register collisions and stack space between the Thumb and x86-64 architectures and we get different results for maximum register collisions per function and register level register collisions. It may be interesting to see which optimizations work better for different architectures.
5.2 Conclusion
BIBLIOGRAPHY
[1] Llvm’s analysis and transform passes. http://llvm.org/docs/Passes.html. Accessed: 2018-05-16.
[2] Standard performance evaluation corporation. https://www.spec.org/benchmarks.html, 2018.
[3] M. ”Braun, S. Buchwald, S. Hack, R. Leißa, C. Mallon, and A. Zwinkau. ”simple and efficient construction of static single assignment form”. In R. ”Jhala and K. De Bosschere, editors, ”Compiler Construction”, pages ”102–122”, ”Berlin, Heidelberg”, ”2013”. ”Springer Berlin Heidelberg”.
[4] P. Briggs. Register Allocation via Graph Coloring. PhD thesis, Houston, TX, USA, 1992. UMI Order No. GAX92-34388.
[5] P. Briggs, K. D. Cooper, K. Kennedy, and L. Torczon. Coloring heuristics for register allocation. In Proceedings of the ACM SIGPLAN 1989 Conference on Programming Language Design and Implementation, PLDI ’89, pages 275–284, New York, NY, USA, 1989. ACM.
[6] G. J. Chaitin. Register allocation & spilling via graph coloring. SIGPLAN Not., 17(6):98–101, June 1982.
[7] F. Chow and J. Hennessy. Register allocation by priority-based coloring. In Proceedings of the 1984 SIGPLAN Symposium on Compiler Construction, SIGPLAN ’84, pages 222–232, New York, NY, USA, 1984. ACM.
International Conference on Compilers, Architectures and Synthesis for
Embedded Systems (CASES), pages 45–54, Oct 2011.
[9] K. D. Cooper, A. Dasgupta, and J. Eckhardt. Revisiting graph coloring register allocation: A study of the chaitin-briggs and callahan-koblenz algorithms. In Proceedings of the 18th International Conference on Languages and Compilers
for Parallel Computing, LCPC’05, pages 1–16, Berlin, Heidelberg, 2006. Springer-Verlag.
[10] R. Cytron, J. Ferrante, B. K. Rosen, M. N. Wegman, and F. K. Zadeck.
Efficiently computing static single assignment form and the control dependence graph. ACM Trans. Program. Lang. Syst., 13(4):451–490, Oct. 1991.
[11] T. C. d. S. Xavier, G. S. Oliveira, E. D. d. Lima, and A. F. d. Silva. A detailed analysis of the llvm’s register allocators. In 2012 31st International Conference of the Chilean Computer Science Society, pages 190–198, Nov 2012.
[12] T. J. Harvey. Reducing the impact of spill code. PhD thesis, Rice University, 1998.
[13] D. Karger, R. Motwani, and M. Sudan. Approximate graph coloring by semidefinite programming. J. ACM, 45(2):246–265, Mar. 1998.
[14] R. M. ”Karp. ”Reducibility among Combinatorial Problems”, pages ”85–103”. ”Springer US”, ”Boston, MA”, ”1972”.
[15] llvm-admin team. Llvm compiler infrastructure. =http://llvm.org, 2018. [16] R. Odaira, T. Nakaike, T. Inagaki, H. Komatsu, and T. Nakatani.
Coloring-based coalescing for graph coloring register allocation. In Proceedings of the 8th Annual IEEE/ACM International Symposium on Code Generation
[17] K. Pingali. Control flow graphs. http:
//www.cs.utexas.edu/~pingali/CS380C/2016-fall/lectures/CFG.pdf. [18] M. Poletto and V. Sarkar. Linear scan register allocation. ACM Trans.
Program. Lang. Syst., 21(5):895–913, Sept. 1999.
[19] G. Shobaki, M. Shawabkeh, and N. Rmaileh. Preallocation instruction scheduling with register pressure minimization using a combinatorial optimization approach. 10, 09 2013.
[20] M. D. Smith, N. Ramsey, and G. Holloway. A generalized algorithm for graph-coloring register allocation. In Proceedings of the ACM SIGPLAN 2004 Conference on Programming Language Design and Implementation, PLDI ’04, pages 277–288, New York, NY, USA, 2004. ACM.
APPENDICES
Appendix A
-O3 OPTIMIZATION LIST
-assumption-cache-tracker -memoryssa -dse
-loop-distribute -ipsccp -demanded-bits
-lazy-block-freq -aa -lcssa
-profile-summary-info -loop-load-elim -instsimplify
-block-freq -verify -mem2reg
-basicaa -globalopt -scoped-noalias
-mldst-motion -gvn -jump-threading
-tti -basiccg -globaldce
-loop-unswitch -memdep -loop-vectorize
-argpromotion -targetlibinfo -loop-deletion -forceattrs -opt-remark-emitter -loop-unroll
-correlated-propagation -prune-eh -alignment-from-assumptions -lcssa-verification -lazy-value-info -branch-prob
-scalar-evolution -licm -memcpyopt
-deadargelim -globals-aa -rpo-functionattrs
-sroa -functionattrs -loop-idiom
-loop-accesses -tbaa -reassociate
-speculative-execution -slp-vectorizer -postdomtree -inline -elim-avail-extern -early-cse-memssa
-pgo-memop-opt -bdce -adce
-libcalls-shrinkwrap -sccp -loop-sink
-loops -latesimplifycfg -tailcallelim
-lazy-branch-prob -domtree -loop-rotate
-strip-dead-prototypes -float2int -barrier
Appendix B
ARM DOUBLE OPTIMIZATION NUMBERS
Figure B.1: THUMB Average Register Collisions by Function Statistics
Figure B.2: THUMB Maximum Register Collisions by Function Statistics
Appendix C
REGISTER COLLISION GRAPHS
Figure C.2: x86 Average Register Collisions by Function, On Licm
Figure C.4: x86 Maximum Register Collisions by Function, Off Licm
Figure C.6: x86 Register Collisions by Register, Off Licm
Figure C.8: x86 Average Register Collisions by Function, On Tail Call Elimination
Figure C.10: x86 Maximum Register Collisions by Function, On Tail Call Elimination
Figure C.12: x86 Register Collisions by Register, On Tail Call Elimination
Figure C.14: x86 Average Register Collisions by Function, Off All-Loops and Argpromotion
Figure C.16: x86 Maximum Register Collisions by Function, Off All-Loops and Argpromotion
Figure C.18: x86 Average Register Collisions by Function, On Licm and All-Loops
Figure C.20: x86 Maximum Register Collisions by Function, On Licm and All-Loops
Figure C.22: x86 Register Collisions by Register, On Licm and All-Loops
Figure C.24: x86 Average Register Collisions by Function, On Licm and Argpromotion
Figure C.26: x86 Maximum Register Collisions by Function, On Licm and Argpromotion
Figure C.28: x86 Register Collisions by Register, On Licm and Argpromotion
Figure C.30: ARM Average Register Collisions by Function, On All-Loops
Figure C.32: ARM Maximum Register Collisions by Function, Off All-Loops
Figure C.34: ARM Register Collisions by Register, Off All-Loops
Figure C.36: ARM Average Register Collisions by Function, On Early-CSE-Memssa
Figure C.38: ARM Maximum Register Collisions by Function, Off Early-CSE-Memssa
Figure C.40: ARM Register Collisions by Register, Off Early-CSE-Memssa
Figure C.42: ARM Average Register Collisions by Function, On Jump-Threading
Figure C.44: ARM Maximum Register Collisions by Function, Off Jump-Threading
Figure C.46: ARM Register Collisions by Register, Off Jump-Threading
Appendix D
DOUBLE OPTIMIZATIONS SPILL COUNT
Figure D.1: Number of Spills in the x86 Architecture (Double Optimizations)