FROM: David W. Smith, PhD.
DATE: January 15, 2006
SUBJECT: Cumulative Analysis of UGA Impacts on Water Quality and Aquatic Resources in Pleasant Grove Creek, Roseville, California
I
NTRODUCTIONB
ACKGROUND ANDN
EED FORA
SSESSMENTAs part of the South Placer Wastewater Authority’s (SPWA) Regional Wastewater and Recycled Water Systems Evaluation Project, the City of Roseville (City) has been reviewing information for planned developments seeking wastewater services for particular urban growth areas (UGAs) that are outside the geographical area currently covered by CEQA documents that were the basis of NDPES permits to discharge from the City’s two regional wastewater treatment plants, Pleasant Grove Wastewater Treatment Plant (PGWWTP) and Dry Creek Wastewater Treatment Plant (DCWWTP). The County of Placer (County), as the local land use authority, will serve as the Lead Agency for California Environmental Quality Act (CEQA) compliance for each UGA project located in the unincorporated area. SPWA will be a Responsible Agency under CEQA for purposes of financing regional wastewater/recycled water infrastructure. As a Responsible Agency, the SPWA will rely on the UGA CEQA documentation prepared by local lead agencies when taking discretionary actions related to funding or financing such infrastructure.
As agreed upon in Operations Agreement among the Regional Partners, the City owns and operates the regional wastewater treatment plants on behalf of the partners. In this capacity, the City approves plant expansion/upgrade designs, construction documents, and bid authorizations, awards construction contracts, and obtains the necessary National Pollutant Discharge Elimination System (NPDES) permits for the facilities. In this role, the City functions as a CEQA Lead Agency. When taking discretionary actions related to regional wastewater facilities to accommodate treatment and discharge of UGA flows, however, the City, serving as staff to SPWA which is a Responsible Agency, intends to rely on UGA project-specific CEQA documentation for all UGA-related environmental issues not addressed by the City’s own existing CEQA documents. To be in a position to do so, the City needs to assure the adequacy of each UGA CEQA document. Of particular interest to the City in this regard is the adequacy of the discussion, in EIRs for
UGA projects, of future cumulative impacts associated with treatment and discharge of all of the foreseeable wastewater flows from pending UGA projects.
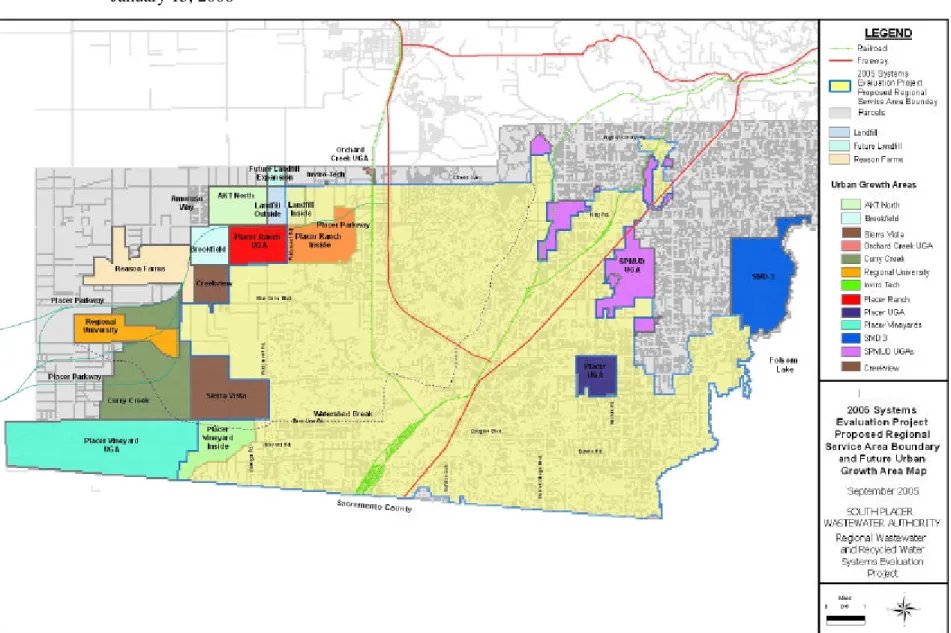
The scope and analytical requirements that the SPWA and the City require of future UGA CEQA documentation is outlined in the City’s letter to Mr. Durfee dated April 26, 2005.The City expects that the County, as Lead Agency for the UGA CEQA documents, will rely on the City’s 1996 Master Plan and Master Plan Environmental Impact Report (EIR) (Roseville, City of, 1996) and its West Roseville Specific Plan EIR (Roseville, City of, 2004) as baseline documents and examples of the appropriate level of analysis that is required for UGA CEQA documentation, particularly cumulative impact assessments. The 1996 Master Plan EIR addressed planned wastewater conveyance and treatment improvements to serve a regional service area through the year 2015. In looking at impacts that would result from actions to be taken over a 20 year planning horizon, its impacts assessments are “inherently cumulative” in nature. The service area for the regional system would cover approximately 95 square miles in southwestern Placer County, extending from the town of Newcastle westward to the City of Roseville, and from the City of Lincoln southward to the Placer County/Sacramento County line. The UGA CEQA documents will identify and adequately assess actions not addressed, or not sufficiently addressed, by the City’s previously certified CEQA documents. The City’s 1996 Master Plan EIR and its West Roseville Specific Plan EIR collectively evaluated, for CEQA purposes, impacts of future flows that will be generated from development within the “2005 service area.” The 2005 service area includes the 1996 service area and any subsequent formal modifications thereto. Impacts from portions of UGAs located outside the 2005 service area, and appropriate mitigation, would need to be identified in the CEQ A documents associated with each UGA. The 2005 service area and UGAs located outside this service area are shown in Figure 1.
P
URPOSE ANDU
SE OF THISM
EMORANDUMThe purpose of this technical memorandum (TM) is to evaluate future anticipated compliance with water quality regulations in Pleasant Grove Creek, and to assess future cumulative impacts to water quality and aquatic biological resources of Pleasant Grove Creek in light of the prospect of treating and discharging increasingly more wastewater from the PGWWTP, some of which is expected from particular UGAs planned for development located outside the geographical area currently covered by CEQA documents that were the basis of NDPES permits to discharge from PGWWTP. More specifically, this TM acknowledges the future cumulative assessments included in the City’s two certified EIR’s (cited above) and the environmental documentation for the other areas included in the “2005 Service Area” (Reference the “Proposed 2005 Regional Service Area Boundary Tech Memo dated January 13, 2005”), which address wastewater flows from within the 2005 service area, and determines whether discharge of the
additional treated UGA flows (that are outside the 2005 service area) will result in any new significant cumulative impacts, not previously identified, or more severe cumulative impacts relative to those previously identified by the City’s CEQA documents. Measures for mitigating future cumulative impacts are also discussed.
The assessment of water quality and aquatic biological resource impacts described in this TM is intended to contribute to a common basis for the cumulative impacts section of the project-specific CEQA documentation being prepared for each of the UGAs.
The future UGAs that are planned to be served by PGWWTP and considered in this assessment include: • Curry Creek • Regional University • Orchard Creek • Placer Ranch • Invirotech
• Sierra Vista and Creekview Specific Plan Areas (formerly called West Roseville remainder area).
In addition, flows from the following future UGAs that are planned to be served by DCWWTP are provided in this assessment:
• Placer Vineyards
• Placer County Sewer Maintenance District No. 3
• Areas in the South Placer Municipal Utility District not currently within the 2005 SPWA boundary (i.e., flows for which discharge impacts have not already been addressed in a CEQA document).
Analysis of potential cumulative Pleasant Grove Creek impacts resulting from the future treatment and discharge of flow from all the UGAs tributary to the PGWWTP respectively, and identification of appropriate mitigation measures for any significant or potentially significant cumulative impacts, has been requested by the City to help assure adequate CEQA basis for approving annexation of the UGAs to the WWTP service areas, and eventual permitting of the future PGWWTP flows. This TM addresses impacts of flow incremental to that from the 2005 service area (i.e., flow from the UGAs) to Pleasant Grove Creek. Impacts to Dry Creek are not addressed in this TM. They have been addressed in a separate memorandum dated October 27, 2005.
For any future cumulative condition deemed (from this assessment) to have significant effects, a determination will be made as to whether the incremental increase in flow from
the UGAs would contribute considerably to that significant cumulative condition. For all assessments that find the future cumulative condition to be less-than-significant and, thus, not requiring mitigation, determination of whether the UGA’s increment contributes considerably to the future cumulative condition becomes unnecessary under CEQA and, therefore, will not be addressed.
B
ASIS OFA
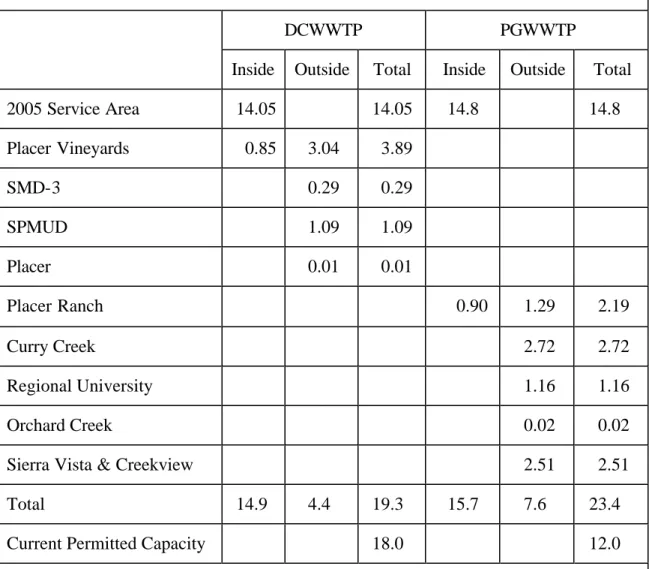
NALYSISTable 1 shows the allocation of estimated flows from each of the UGAs to the DC and PGWWTPs and the allocation of flows from within and outside of the 2005 service area. Land uses for most of these UGAs are currently undergoing revisions and further analysis. Projected flow from any UGA may change slightly in the future, but minor changes in flow would not change the analysis herein.
A
SSESSMENTA
PPROACHThis cumulative assessment builds upon the cumulative assessments included in the City’s 1996 Master Plan EIR (which are inherently “cumulative” in nature) and West Roseville Specific Plan EIR (Roseville, City of, 1996; Roseville, City of, 2004). The following sections discuss whether new or more significant impacts to Pleasant Gove Creek water quality or aquatic biological resources would occur with the annexation of the UGAs into the SPWA service area and the resulting discharge of treated effluent from the PGWWTP into Pleasant Grove Creek.
R
EGULATORYE
NVIRONMENTWater Quality
Discharges from wastewater treatment plants are regulated by National Pollutant Discharge Elimination System (NPDES) permits. The Central Valley Regional Water Quality Control Board (RWQCB) issued a NPDES permit regulating discharges from the PGWWTP in 2000 (NPDES No. CA0084573, Order No. 5-00-075). The permitted capacity of the PGWWTP is 12.0 mgd (ADWF). NPDES permits expire and must be renewed every five years. Through its development and adoption of NPDES permits every five years, the RWQCB stipulates effluent and receiving water limitations that must be met, thereby assuring compliance with receiving water quality criteria/objectives and protection of beneficial uses.
Table 1 indicates the total estimated future flow from the PGWWTP, plus flow from UGAs located outside the 2005 service area, is 23.4 mgd. This is 13.4 mgd greater than the current permitted capacity of the DCWWTP, but 6.1 mgd less than the 29.5 mgd
Table 1. Estimated Future Wastewater Flows
(All flows million gallons per day average dry weather flow. “Inside” refers to areas within the 2005 service area and “outside” refers to areas located outside the 2005 service area)
DCWWTP PGWWTP
Inside Outside Total Inside Outside Total
2005 Service Area 14.05 14.05 14.8 14.8 Placer Vineyards 0.85 3.04 3.89 SMD-3 0.29 0.29 SPMUD 1.09 1.09 Placer 0.01 0.01 Placer Ranch 0.90 1.29 2.19 Curry Creek 2.72 2.72 Regional University 1.16 1.16 Orchard Creek 0.02 0.02
Sierra Vista & Creekview 2.51 2.51
Total 14.9 4.4 19.3 15.7 7.6 23.4
Current Permitted Capacity 18.0 12.0
Data from Dry Weather Flow Projection for the Ultimate SPWA Service Area (including Urban Growth Areas) Tech Memo, RMC, November 4, 2005
future flow projected for PGWWTP under one of the alternatives in the 1996 Master Plan EIR (see Master Plan EIR Table 2-4). Impacts for the 29.5 mgd alternative were evaluated in the 1996 Master Plan EIR at an equivalent level of detail to that of PGWWTP flow alternatives with lower flow (including the selected alternative with a flow of 20.7 mgd). In this regard, the approach used to evaluate impacts in this TM is conservative.
Aquatic Biological Resources
Because aquatic biological resources are an identified beneficial use of Pleasant Grove Creek, certain limitations included in the NPDES permit act to assure compliance with receiving water criteria/objectives adopted for the protection of aquatic life. By complying with aquatic life water quality criteria/objectives in the receiving waters downstream of the PGWWTP discharge, these resources are protected and maintained. As part of the permit renewal process, State (i.e., California Department of Fish and Game) and federal (i.e., NOAA Fisheries and the U.S. Fish and Wildlife Service) agencies charged with management of fisheries and aquatic resources receive a copy of the Tentative NPDES permit for review and comment. This further assures that the limitations included in the NPDES permit, when met, will protect fish and aquatic resources in the receiving water, downstream of the discharge.
E
VALUATION OFI
MPACTSThe 1996 Master Plan EIR (Roseville, City of 1996) identified the following significant/potentially significant impacts to water quality and aquatic biological resources associated with treatment and discharge of anticipated future PGWWTP discharges in Pleasant Grove Creek (i.e., operational impacts, not temporary construction-related impacts):
• Degradation of water quality in Pleasant Grove Creek (Impact 7-3);
• Erosion and sedimentation (Impact 5-2); and
• Loss of oak trees along Pleasant Grove Creek resulting from effluent discharge (Impact 4-2).
The 1996 EIR introduced mitigation that would reduce each of these impacts to a less-than-significant level. The first impact listed above attempted to address overall degradation of water quality due to increased effluent discharge. The latter two impacts identified in the 1996 EIR derive wholly, or in part, from the hydraulic effects of greater discharge rates. Consistent with the organization of the 1996 EIR, the two main impact categories discussed below are: 1) water quality degradation due to increased discharge of treated effluent, and 2) flow-related effects on riparian habitat and aquatic life. With regard to the water quality degradation category of assessment, this TM evaluates not only constituents specifically discussed in the City’s 1996 EIR, but also evaluates additional cons tituents of potential concern under the future cumulative condition.
The West Roseville Specific Plan EIR (Roseville, City of 2004) found project-specific impacts to hydrology (with implementation of mitigation), water quality, groundwater, and biological resources to be less than significant. The West Roseville Specific Plan
EIR found cumulative impacts to hydrology, water quality, groundwater, and biological resources to be less than significant.
Several factors indicate the analysis of impacts in this TM is conservative:
• The total estimated future flow of 23.4 mgd from the PGWWTP is 6.1 mgd less than the 29.5 mgd future flow projected and evaluated in the 1996 Master Plan EIR.
• This analysis assumes all of the dry weather flow will be discharged. However, dry season discharge to Pleasant Grove Creek will be less than average dry weather flow generated because a portion of the flow will be returned to the UGAs as recycled water for irrigation instead of being discharged to Pleasant Grove Creek.
• The West Roseville Specific Plan EIR includes mitigation Measure 4.11-5, which conditions issuance of building permits on obtaining all the necessary permits to treat, discharge and reuse flows from the specific plan area. SPWA, as a Responsible CEQA agency, will require a similar mitigation measure for the UGAs that are the subject of this TM.
W
ATERQ
UALITYD
EGRADATIOND
UE TOI
NCREASEDD
ISCHARGEThe 1996 Master Plan EIR identified significant impacts to Pleasant Grove Creek water quality resulting from increase water temperature and elevated levels of trace metals and organic pollutants. The impact of the UGAs with respect to these constituents is discussed below. Other constituents of potential concern (i.e., toxicity, mercury, pH, biostimulatory substances, dissolved oxygen, and taste and odors) are also evaluated.
Temperature
The 1996 Master Plan EIR identified elevated temperature as an element of the significant impact to the water quality in Pleasant Grove Creek. The 1996 Master Plan EIR included the following to mitigate for this impact:
• Install cooling towers if necessary (Mitigation Measure 7-4)
Following mitigation, this element of the overall water quality impact would be reduced to a less-than-significant level.
Consistent with this mitigation measure, the City installed temperature cooling units at the DCWWTP, and began operating them in 2004. The City monitors receiving water temperature under the NPDES Permit Monitoring and Reporting Program. The City has not installed cooling units at PGWWTP because salmonid fish are not present there (due to lack of habitat), which is reflected in the less-stringent receiving water temperature limit in the PGWWTP NPDES permit relative to that in the DCWWTP NPDES permit.
During those periods when flow is present in Pleasant Grove Creek (Pleasant Grove Creek is naturally a seasonal stream), additional flows from the UGAs to the PGWWTP service area would cause additional temperature increases in Pleasant Grove Creek, downstream of the PGWWTP outfall. The amount of additional thermal load added to Pleasant Grove Creek would be directly related to the incremental increase in wastewater flow from the UGAs being treated and discharged at the PGWWTP. During those periods when flow (other than effluent from PGWWTP) is not present in Pleasant Grove Creek, incremental UGA flows will not affect water quality in Pleasant Grove Creek. Because the 2015 condition assessed in the City’s 1996 Master Plan EIR was determined to be significant, the future cumulative condition with the UGA flows added also would be significant, and the UGA contribution to the future cumulative condition would be considerable.
As the capacity of the PGWWTP is expanded to accommodate flows from the UGAs, cooling units would be added, if necessary, to address the increased wastewater flow needing cooling, thereby assuring continued compliance with the temperature objectives in the Water Quality Control Plan for the Sacramento River and San Joaquin River Basins (Basin Plan) and thermal protection of aquatic resources. The treatment and discharge of UGA flows from the PGWWTP into Pleasant Grove Creek would not result in any new thermal impacts not identified in the 1996 Master Plan EIR. Implementation of the already- identified mitigation will reduce the future cumulative Pleasant Grove Creek thermal impact to a less-than-significant level. No new mitigation measures are required in light of the additional UGA flows; rather, Mitigation Measure 7-4, already identified by the City, may simply need to be implemented sooner, or to a greater or expanded level as needed to address the UGA flows in addition to the flows evaluated in the 1996 Master Plan EIR. Implementation of Mitigation Measure 7-4, as in the case of flows considered in the 1996 Master Plan EIR, reduces this impact to a less-than-significant level.
Trace Metals and Organic Pollutants
The 1996 Master Plan EIR identified the introduction of elevated levels of trace metals and organic pollutants as an element of the significant impact to the water quality in Pleasant Grove Creek. The 1996 Master Plan EIR identified the following mitigation for this impact:
• install advanced treatment facilities (Mitigation Measure 7-2)
• institute metals source controls/pre-treatment (Mitigation Measure 7-3) Following mitigation, this element of the overall water quality impact would be reduced to a less-than-significant level.
During those periods with flow is present in Pleasant Grove Creek, additional flows from the UGAs to the PGWWTP service area would cause the percentage of water in the Pleasant Grove Creek channel composed of treated effluent, downstream of the PGWWTP outfall, to be higher, all other factors (e.g., creek hydrology) remaining the same. Consequently, instream concentrations of trace metals and organic pollutants downstream of the outfall would increase in proportion to the incremental increase in wastewater flow from the UGAs being treated and discharged at the PGWWTP. During those periods when flow (other than effluent from PGWWTP) is not present in Pleasant Grove Creek, incremental UGA flows will not affect water quality in Pleasant Grove Creek. Because the 2015 condition assessed in the City’s 1996 Master Plan EIR was determined to be significant, the future cumulative condition with the UGA flows added also would be significant, and the UGA contribution to the future cumulative condition would be considerable.
As the capacity of the PGWWTP is expanded to accommodate flows from the UGAs, any advanced treatment facilities that the City constructs and operates to comply with its NPDES permit would be expanded (or initially constructed for an expanded capacity) to address the increased wastewater flow from the UGAs, thereby assuring continued compliance with all Basin Plan pollutant objectives and California Toxic Rule criteria. The treatment and discharge of UGA flows from the PGWWTP into Pleasant Grove Creek would not result in any pollutant impacts that would not occur in the absence of the UGA flows. Implementation of the mitigation measures identified in the 1996 EIR, to the degree necessary, to comply with water quality standards under future cumulative flows will reduce the future cumulative Pleasant Grove Creek pollutant impact to a less-than-significant level. No new mitigation measures are required in light of the additional UGA flows; rather, Mitigation Measures 7-2 and 7-3, already identified by the City, may simply need to be implemented sooner, or to a greater or expanded level. Implementation of Mitigation Measures 7-2 and 7-3, as in the case of flows considered in the 1996 Master Plan EIR, reduces this impact to a less-than-significant level.
Aquatic Life Toxicity
The PGWWTP currently performs chronic three-species bioassay testing of its effluent quarterly. These bioassays determine a No Observable Effect Concentration (NOEC) and an Inhibition Concentration for a set percentage effect (IC25). For example, the IC25 is
the concentration of toxicant that would cause a 25 percent reduction in mean young per female in the Ceriodaphnia dubia reproduction test or a 25 percent reduction in growth for the test population. The IC25 is used because it is a very sensitive, non- lethal
endpoint, which attempts to be indicative of the “first signs” of an effect on the test population. LC50s, the lethal concentration to 50 percent of the test population, is a test
endpoint showing a much greater level of toxic effect. The NOEC is the lowest dilution ratio (i.e., the largest proportion of effluent) at which no toxic effect is observed. The IC25 is a point estimate that approximates the highest dilution ratio (i.e., the smallest
proportion of effluent) at which a specified level (25 percent) of effect is observed. These results are reported in toxicity units (TU), which are defined as:
NOEC TUc = 100
For example, 8 TUc represents a test result where the NOEC was observed at 12.5 percent effluent, or a dilution ratio of 1 part effluent to 7 parts dilution water. Similarly, 16 TUc represents a test result where the NOEC was observed at 6.25 percent effluent, or a dilution ratio of 1 part effluent to 15 parts dilution water. As TUc increases, more dilution water is required to have no effect on the test organisms. A TUc of <1 indicates that no effect was observed in undiluted (100 percent) effluent, relative to control tests. The three-species bioassay results for the PGWWTP for all four quarterly tests performed since discharge and bioassay testing began in 2004, have a result of <1 TUc for all tests. These results show that the undiluted effluent is non-toxic to aquatic life.
PGWWTP effluent quality under the future cumulative condition would be maintained at essentially equivalent or possibly higher quality levels (if additional or more restrictive NPDES limits are permitted by the RWQCB), relative to current effluent quality. Therefore, no aquatic life toxicity would be expected in the future, once the PGWWTP is adequately expanded/upgraded, as necessary, and permitted to treat the incremental flows, including UGA flows. This would be a less-than-significantcumulative impact.
Mercury
The current NPDES permit contains a mercury (Hg) mass- loading limit of 1.71 pounds per year for the combined discharge of the DCWWTP and the PGWWTP. Based on Finding 25f in the DCWWTP NPDES permit, this limit is performance-based and is based on a flow-weighted average mercury concentration plus 20 percent using effluent quality data from January 1996 through September 1999. The average Hg concentration (based on detectable values during this period and upon which the mass loading limit was based) is 0.058 µg/L (see Table 2). Finding 25f indicates the Hg concentration data are questionable because “clean technique” was not used. This means that the actual concentration would likely be less than 0.058 µg/L. Indeed, the average concentration in DCWWTP effluent (based on detectable values) in 2004 through 2005 was 0.012 µg/L, a period during which clean techniques were used (see Table 2). Thus, actual flow could be as much as 0.058/0.012 or 4.9 times greater than the flow upon which the mass loading limit is based without causing the limit to be exceeded. The current NPDES permits have a combined permitted flow of 30 mgd, and the total incremental UGA flow (from areas outside the 1996 EIR area) is 12 mgd, for a total flow of 42 mgd or a 1.4-fold increase. This flow increase factor is less than 4.9, indicating that the combined incremental flow of all UGAs will not cause the Hg mass loading limit to be exceeded. Therefore, the
cumulative impact of the discharge from DCWWTP and PGWWTP on mercury loading is considered to be less than significant.
pH
The NPDES permit for the PGWWTP has an effluent limitation that requires discharges to have a pH between 6.5 and 8.5 units. Based on the current science regarding pH requirements of freshwater aquatic life, the beneficial use most sensitive to creek pH, the Central Valley RWQCB is processing a Basin Plan amendment that will remove the 0.5-unit change requirement of the current pH objective, leaving the component that requires controllable factors affecting water quality to maintain receiving water pH between 6.5 and 8.5 units (RWQCB 2002). Because the permit requires effluent discharged to Pleasant Grove Creek to have a pH between 6.5 and 8.5 and incremental UGA flows will not affect the pH of effluent, future discharges, regardless of volume, would not cause Pleasant Grove Creek pH to fall outside this range. Once the PGWWTP is expanded to accommodate future cumulative flows, the higher rate of discharge will not cause Pleasant Grove Creek pH to fall below a pH of 6.5 or be raised above 8.5. Based on these facts, the future cumulative condition for pH in Pleasant Grove Creek will have a less-than-significant impact on the creek’s beneficial uses, including aquatic life uses, which are the uses most sensitive to creek pH.
Biostimulatory Substances (Nutrients)
The 1996 Master Plan EIR indicted that algal growth in Pleasant Grove Creek is limited by factors other than nutrient availability. This indicates that nutrients in effluent would not stimulate algal growth in the creek. In addition, PGWWTP bioassay data indicate that current undiluted PGWWTP effluent does not contain sufficient biostimulatory substances (i.e., nitrogen and phosphorus) to cause a significant increase in cell production in the S. capricornutum (algae) bioassay. Consequently, nuisance level plant or algae communities are not expected to develop in Pleasant Grove Creek, downstream of the PGWWTP outfall, under the future cumulative condition when higher rates of effluent discharge, including UGA flows, result in a greater proportion of creek water being constituted by treated effluent. Consequently, nutrient loading from the PGWWTP under the future cumulative condition constitutes a less-than-significant impact to nutrient water quality.
Dissolved Oxygen
The 1996 Master Plan EIR mitigation measures to address receiving water quality degradation impacts are as follows:
• Install advanced treatment facilities (Mitigation Measure 7-2, which is assumed to include mitigation for oxygen-related impacts since dissolved
oxygen impacts were not addressed in particular in the 1996 Master Plan EIR)
• Institute metals source controls/pre-treatment (Mitigation Measure 7-3) Following mitigation, this element of the overall water quality impact would be reduced to a less-than-significant level.
Table 2. Total Recoverable Mercury Concentrations in the City of Roseville’s Wastewater Treatment Plant Effluent
Analysis Period Sample Date Concentration (µg/L)
2/6/96 0.04 5/6/96 0.12 8/13/96 0.007 11/13/96 < 0.013 3/10/97 < 0.02 5/13/97 < 0.02 9/10/97 < 0.02 11/4/97 0.098 2/27/98 < 0.02 6/23/98 < 0.02 9/21/98 0.041 3/30/99 < 0.02 5/26/99 < 0.02 7/20/99 0.041 12/5/99 < 0.02
Basis for NPDES Permit Mass Limit
Period Average
(Detected Concentrations Only) 0.058
1/26/04 < 0.00024 5/18/04 0.0061 8/3/04 0.0051 11/9/04 0.0023 2/6/05 0.0028 4/19/05 0.043
Clean Sampling Techniques Implemented
Period Average
(Detected Concentrations Only) 0.012
The PGWWTP produces Title 22 quality, tertiary-treated effluent characterized by low BOD (typically less than 3 mg/L) and ammonia (typically less than 0.3 mg-N/L). As
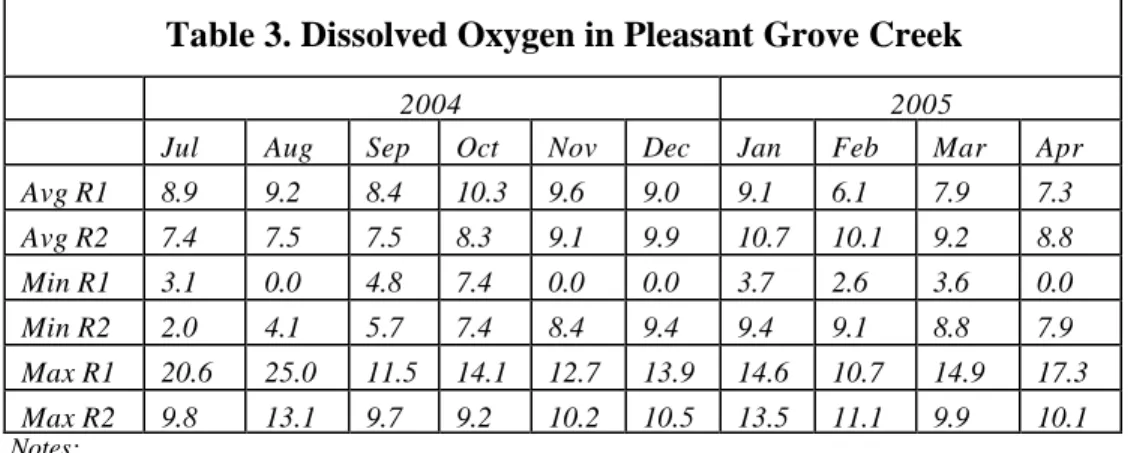
such, its biochemical oxygen demand is relatively low. Re-aeration of downstream waters due to physical processes and photosynthesis tends to largely offset the oxygen demand of the effluent as it flows downstream, thereby resulting in small, if any, downstream dissolved oxygen (DO) sags (i.e., reductions in instream DO levels relative to background levels). This is shown by the DO data summarized in Table 3 that reflects the period since discharge from PGWWTP began in July 2004. In particular, the minimum monthly DO concentration is typically greater below the discharge than above it.
Table 3. Dissolved Oxygen in Pleasant Grove Creek
2004 2005
Jul Aug Sep Oct Nov Dec Jan Feb Mar Apr
Avg R1 8.9 9.2 8.4 10.3 9.6 9.0 9.1 6.1 7.9 7.3 Avg R2 7.4 7.5 7.5 8.3 9.1 9.9 10.7 10.1 9.2 8.8 Min R1 3.1 0.0 4.8 7.4 0.0 0.0 3.7 2.6 3.6 0.0 Min R2 2.0 4.1 5.7 7.4 8.4 9.4 9.4 9.1 8.8 7.9 Max R1 20.6 25.0 11.5 14.1 12.7 13.9 14.6 10.7 14.9 17.3 Max R2 9.8 13.1 9.7 9.2 10.2 10.5 13.5 11.1 9.9 10.1 Notes:
R1 = 200 feet upstream of the PGWWTP discharge R2 = 200 feet downstream of the PGWWTP discharge
As discharge rates increase in the future, the proportion of creek water constituted by effluent also will increase, as will the total oxygen demand of the discharged effluent. As such, a possibility exists that receiving water DO limitations (which derive directly from Basin Plan DO objectives) would not be met even if NPDES effluent BOD and ammonia limits are met. Available data are insufficient to conclusively establish whether the future cumulative discharge rates from the PGWWTP will result in DO sags downstream that will cause Pleasant Grove Creek DO levels to fall below applicable Basin Plan DO objectives. Because future discharges could potentially cause Pleasant Grove Creek DO concentrations to fall below the applicable DO objective, the future cumulative DO condition in Pleasant Grove Creek is considered to be potentially significant. The contribution of the UGA flows would be cumulatively considerable.
Although DO levels in Pleasant Grove creek were not specifically addressed in the 1996 EIR, this EIR’s Mitigation Measure 7-2 (install advanced treatment facilities) is the same measure that would be implemented to address a DO issue. The type of advanced treatment facility would, of course, be tailored to the constituent of concern.
As the capacity of the PGWWTP is expanded to accommodate flows from the UGAs, any advanced treatment facilities that the City constructs and operates to comply with its NPDES DO limitations would be expanded (or initially constructed for an expanded
capacity) to address the increased wastewater flow from the UGAs, thereby assuring continued compliance with all Basin Plan DO objectives. Based on available information, the UGA flows are not expected to create a DO impact where, in the absence of the UGA flows, one would not exist. More likely, the UGA flows would simply further contribute to a cumulative DO impact, should one occur in the future. Consequently, no new mitigation measure(s) would be required in light of the additional UGA flows; rather, the advanced treatment facilities that the City would already have identified to address the potential DO impact may simply need to be implemented sooner, or to a greater or expanded level. Implementation of Mitigation Measure 7-2, as in the case of flows considered in the 1996 Master Plan EIR, reduces this impact to a less-than-significant level.
Tastes and Odors
The Basin Plan states that “Waters shall not contain taste or odor producing substances in concentrations that impart undesirable tastes or odors to domestic or municipal water supplies or to fish flesh or other edible products of aquatic origin, or that cause nuisance, or otherwise adversely affect beneficial uses.” No history of taste and odor problems exists in Pleasant Grove Creek at locations downstream of the PGWWTP discharge. Municipal water supply taste and odor problems are often associated with algae production in source waters. The biostimulatory substance assessment presented above concludes that problematic levels of bio-stimulation and associated increased algal production is not expected to occur in Pleasant Grove Creek under the future cumulative condition.
Effluent quality under the future cumulative condition will be maintained at essentially equivalent or possibly higher quality levels (if additional or more restrictive NPDES limits are permitted by the RWQCB), relative to current effluent quality. Therefore, no taste and odor problems would be expected in the future, once the PGWWTP is adequately expanded/upgraded, as necessary, and permitted to treat the incremental flows, including UGA flows. This would be a less-than-significantcumulative impact.
F
LOW-R
ELATEDE
FFECTSFlow can affect habitat and result in flooding. Each type of effect is addressed below.
Flooding Effects
Appendix A describes an analysis of the effects of discharge from PGWWTP on water surface elevation in Pleasant Grove Creek under 100-year flow conditions. The analysis indicates that water surface elevation would be increased 0.07 feet or less in the reach upstream of Reason Farm as a result of incremental UGA wastewater flows as a result of the incremental the PGWWTP discharge. Downstream of Reason Farms, the impact of
the incremental UGA discharge would be immeasurable, partially as a result of 207 acre-feet of storage that is being constructed at Reason Farms for the purpose of mitigating impacts of the PGWWTP discharge. The size of this storage was established to exceed that needed to mitigate the effect PGWWTP adwf of 24 mgd, and the analysis in Appendix A shows no more 165 acre- feet would be needed to mitigate for effects of PGWWTP adwf of 23.3 mgd (which includes the incremental UGA wastewater flows) downstream of Reason Farms. This impact is considered less than significant.
Effects on Aquatic Life
Increasing the flows in Pleasant Grove Creek through the discharge of additional treated effluent will result in channel conveyance of higher flow volumes with associated higher water velocities which could cause additional bed scour and bank erosion. Bed scour and bank erosion, if it occurs as a result of the incremental flows, would increase water column turbidity and alter substrate composition downstream of the PGWWTP outfall. Sedimentation/Turbidity
Due to the constraints of the NPDES permit’s effluent limits, the only mechanism for the discharge to cause sedimentation and higher turbidities within Pleasant Grove Creek under future cumulative conditions would be via the hydraulic effects of the higher flows re-suspending creek bed sediments and eroding creek banks near the out fall, and in downstream reaches. The effluent discharged from the PGWWTP under the future cumulative condition will have very low turbidity (i.e., average < 2 NTU) and suspended matter.
Appendix A describes the velocity (in the column entitled “vel chnl”) of water in Pleasant Grove Creek under high and low streamflow conditions with and without the incremental UGA flows. The velocity of water indicates the amount of energy available to scour sediment from the bed and bank of the stream. Under high flow conditions, which is the channel forming condition, Appendix A indicates water velocity is not affected to a measurable extent by the incremental UGA flows. Under low flow conditions, the overall stream velocity regime is much lower than at high flow conditions, indicating much less bed and bank erosion would generally be expected under low flow conditions relative to the high flow condition evaluated in the study described in Appendix A. Therefore, the impact of the incremental UGA flows on sedimentation and turbidity is considered to be less than significant.
Water Quality Degradation (Temperature)
The temperature impact has been discussed previously (see Water Quality Degradation due to Increased Discharge section above).
Water Quality Degradation (Contaminant Levels)
The contaminant impact has been discussed previously (see Water Quality Degradation due to Increased Discharge section above).
Riparian Habitat Effects
The 1996 Master Plan EIR identified loss of oak trees along Pleasant Grove Creek resulting from effluent discharge as a significant impact. The 1996 Master Plan EIR included the following to mitigate for this impact:
• Conduct monitoring for oak mortality along Pleasant Grove Creek (Mitigation Measure 4-13)
Following mitigation, this impact is considered significant in the 1996 Master Plan EIR. This impact results from conversion of Pleasant Grove Creek from a seasonal stream to a perennial stream.
Appendix A describes the effect of the proposed incremental UGA flows on Pleasant Grove Creek water surface elevation under typical dry season conditions. The impact of the incremental UGA flows is estimated to be 0.44 feet or less depending on location. Pleasant Grove Creek riparian vegetation was not adapted to saturated soils during the dry season in or near the root zone prior to 2004 when discharge from PGWWTP commenced. The incremental UGA flows could further contribute to the significant impact identified in the 1996 Master Plan EIR. Assuming all feasible and effective mitigation was included in the 1996 Master Plan EIR, no new mitigation measure(s) would be required under CEQA to mitigate for the impact of additional UGA flows. Thus, the incremental impact of UGA flows on riparian vegetation would be considered significant.
R
EFERENCESRoseville, City of. 1996. Roseville Regional Wastewater Treatment Service Area Master Plan Final Environmental Impact Report. Prepared for the City of Roseville by Montgomery Watson and ESA Associates. State Clearinghouse No. 93092079. October 25, 1996.
Roseville, City of. 2004. Final Environmental Impact Report for the West Roseville Specific Plan and Sphere of Influence Amendment, Volume I: Chapters 1, 2, 3, and 4 (sections 4.1 through 4.10). Prepared for the City of Roseville by EIP Associates, State Clearinghouse No. 2002082057, January 9, 2004.
Roseville, City of. 2004. Final Environmental Impact Report for the West Roseville Specific Plan and Sphere of Influence Amendment, Volume II: Chapter 4 (4.11
through 4.13 and Chapters 5-10. Prepared for the City of Roseville by EIP Associates, State Clearinghouse No. 2002082057, January 9, 2004.
RWQCB. 2002. Amendments to the Water Quality Control Plan for the Sacramento River and San Joaquin River Basins for pH and Turbidity at Deer Creek, El Dorado & Sacramento Counties, Staff Report And Functional Equivalent Document. Central Valley Regional Water Quality Control Board. February.
Sacramento Ca. 95825
916.563.7300
Fax: 916.563.7362
CIVIL
ENGINEERING
M
EMORANDUMTo: David Smith
Of: Merritt Smith Consulting From: Thomas S. Plummer Job Number: 2003.24
Re: Pleasant Grove Wastewater Treatment Plant (PGWWTP) impacts at Pleasant
Grove Creek
Date: January 12, 2006
Dear David :
Per your request, we have reviewed your Draft summary table entitled “Table 1. Estimated Future Wastewater Flows”. In quantifying the hydraulic impacts to Pleasant Grove Creek, the increased releases from the treatment plan would have the potential to increase peak discharges, above the existing estimated conditions, by an average flow rate of 7.6 MGD which is equivalent to 11.76 cubic feet per second (cfs). However, to determine the potential impact to peak flow rates you have advised that a peaking factor of 2.5 should be applied which results in a peak flow impact of 29.4 cfs. Secondly, Art O’Brien of the City of Roseville has advised that we also should review the impacts associated with the transfer of the storage from the PGWWTP site to the Reason Farms site. Hydraulic Modeling Basis:
There are two historical hydraulic models of significance to this study. We have used a composite model of the two studies for this analysis.
In 1999 Carollo Engineers prepared a study “:Hydrological Analysis of Pleasant Grove Creek – Pleasant Grove Wastewater Treatment Plan Project”. The study indicates that cross sections were surveyed for the included hydraulic analysis. The study includes analysis of Pleasant Grove Creek from the Pleasant Grove Canal at the downstream end, to reache s of Pleasant Grove creek well upstream of the PGWWTP. Research for the Carollo study did not find the original hydraulic analysis files. Civil Solutions used the cross sections, the river stations and section map included in the study to create a replica version of the analysis.
downstream reach which flows past the treatment plant. The study terminates at the downstream end, upstream of Brewer Road at a location which is similar to River Mile (RM) Section 4.5 of the Carollo Study. Hydraulic analysis HEC-RAS files were obtained for the WRSP hydraulic analysis directly from Wood Rodgers.
In order to use the best information available for this analysis, we assembled a composite study, which includes all of the information from the WRSP hydraulic analysis, and added to it our replicated section information from the Carollo stud y for the sections downstream of RM 4.5. We joined Section 0.0189 of the WRSP to RM 4.5 of the Carollo study.
The WRSP hydrology study is the most recent study of Pleasant Grove Creek that we are aware of. We have used the flow rate estimates from the WRSP hydrology as a basis for the 2-year, 10-year, 25-year and 100- year peak storm events. For this study, we will compare the “Existing Conditions” flowrates from the WRSP analysis to the impacted flowrates determined in this study. Downstream starting water surface elevations were read from the Carollo report and specified in the composite model.
An exhibit is provided at the end of this letter which shows the river stationing for the combined study.
Peak Flow Impacts:
We have run the above described hydraulic model for the WRSP peak estimated “existing” flow rates, and for those same rates with 29.4 cfs added. 29.4 cfs being the 7.6 MGD average increase in discharge rates with a 2.5 peaking factor applied for the peak flow event. Flow discharges from the PGWWTP would enter the creek at WRSP station 3.451.
From WRSP station 3.648 (+/- 0.2 miles upstream of the PGWWTP discharge) to WRSP station 2.398 (+/- 1 mile downstream of the PGWWTP discharge) a 0.01 feet increase in 100-year water surface ele vations is reported. From WRSP station 2.244 to WRSP station 1.879 (+/- 1.5 miles downstream of the PGWWTP discharge) a 0.02 feet increase in 100-year water surface elevations is reported. From WRSP station 1.825 to Carollo station 4.00 (roughly 1 mile upstream of the Sutter/Placer County line) a 0.01 feet increase in 100-year water surface elevations is reported. Downstream of this location to the Pleasant Grove Canal, no further increases in 100-year peak water surface elevations is reported. Overall, it is our opinion that the reported impacts would be less than measurable. We have attached the summary printout from the HEC-RAS model to this memo.
Low Flow Impacts:
Prior to the construction of the PGWWTP, Pleasant Grove Creek was documented in the PGWWTP EIR as an “intermittent stream”. We interpret this to mean that at some times during the dry season, no base flow would be observed. Table 1 “Estimated Future Wastewater Flows” identifies the buildout wastewater flows from inside the 2005 planning area as 15.7 MGD (24.3 cfs), which is the baseline flow for this analysis. The best available information indicates Pleasant Grove Creek has
We have performed a hydraulic evaluation using the composite model described above to determine the impacts to dry season water depths and velocities. We have included a comparison of the results of the current dry season flow rates (pre-project) to the proposed dry season flow rates (post-project )“Low Flow” analysis with this letter. The Maximum increase in water depths would be 0.55 feet between WRSP stations 1.116 (approximately 2.3 miles downstream of the discharge to Pleasant Grove Creek) and 0.829(approximately 2.6 miles downstream of the discharge to the creek). Increases in water surface elevations were computed between WRSP station 3.878 (upstream of Haden Parkway, and .4 miles upstream of the discharge point to the creek), and Carollo Station 1.40 (downstream of the railroad crossing). The average increase in water depth over that reach was 0.34 feet.
Surveys for the detailed geometry of the low flow channel for Pleasant Grove Creek are not available. The analysis included should be adequate to represent the relative changes in waters surface elevations due to the change in base flow rates. However, the results of this model should not be used to determine dry weather flood elevations at a point along the analysis reach.
Movement of Storage:
There are two potential issues which result from the movement of the peak flow storage component of the WWTP from the current WWTP site to the Reason Farms site.
First, “What should the revised storage requirement be?”:
Currently, the 1999 Carollo study predicted that when flow rates in Pleasant Grove Creek exceed 1000 cfs a flooding potential exists at Fifield Road, which could be worsened by adding additional flows. The hydrographs for the 24-hour precipitation event indicate that the potential for flow rates within the creek to exceed 1000 cfs in a 100- year event would extend for a period of up to 22 hours 10 minutes. The Carollo Study identified a storage requirement of 147 acre feet for the previous design flow rates of the treatment plant.
The WRSP Hydrologic analysis updated the Pleasant grove Creek Hydrology for Storm centering issues and other factors identified in the Placer County Stormwater Management Manual. The results of that analysis, for the ultimate developed project, indicate the potential for flow rates in the 100-year event to exceed 1000 cfs would be for a period of 18 hours 5 minutes.
The proposed average discharge rate for the PGWWTP would be 23.3 MGD or 36.05 cfs. Applying a peaking factor of 2.5, the peak discharge rate for the plant to a storage facility would be 90.1 cfs. The required storage based on the Carollo and WRSP hydrology basis studies would be 165.1 acre feet and 134.6 acre feet respectively.
Second, “What impact if any, would the release of the sustained peak discharge rates between the WWTP and the Reasons Farms site have on the 100-year peak flood elevations in the creek.”
cfs was added to the remainder of the downstream reaches.
The results of the hydraulic analysis indicate that a 0.01 feet increase in 100- year water surface elevations would occur as far upstream as WRSP station 4.853 (upstream of Haden Parkway). The largest increase in water surface reported in the analysis was 0.07 feet at WRSP station 3.457, just upstream of the PGWWTP discharge location. 100-year water surface elevation increases average 0.04 feet from this location to the Reasons Farms site. Increases in 100- year water surface elevations gradually decrease from this point measuring 0.03 feet to no increase at Carollo Station 1.37 (downstream of the Railroad crossing, and upstream of the transition to the Pleasant Grove Canal). A copy of the HEC-RAS summary comparison is included at the end of this letter.
If you have any questions or comments please contact me at (916) 563-7300.
Sincerely,