The Value and Benefits of Capacity Analytics:
An IBM VMware-based Cost Reduction Case Study
Summary:
Today, responsible IT management places a high premium on operations management to minimize costs and optimize infrastructure utilization. These are on-going activities, even as the advantages and benefits of virtualized infrastructure and cloud computing prove to be effective tools for achieving the agility and adaptability necessary in today’s highly competitive environment. Many firms find they need a management solution that delivers automated capacity planning and workload optimization but also allows balancing optimization with a consideration of business and IT
operational concerns. IBM offers a solution using capacity analytics included in IBM SmartCloud Capacity Monitoring that delivers the desired savings.
Table of Contents
List of Tables ... 3
Executive Summary ... 4
The Challenge in Managing Costs ... 4
Solution Requirements / Profile ... 6
The Heterogeneous Virtualized Environment ... 6
Choosing IBM SmartCloud Monitoring ... 7
Virtualization Optimization ... 8
VMware Capacity Optimization Case Study ... 8
The Customer and Their Environment: ... 9
Customer Objectives: ... 9
SmartCloud Monitoring Capacity Planning ...10
Overview ...10
Capacity Planning Model ...10
IBM Customer VMware Capacity Analysis Results ...12
Capacity Planning Recommendations ... 12
Capacity Planning Recommendations: Cost Savings Analysis ... 12
More Potential Savings for the IBM customer ... 13
Technical Analysis of vSphere Server Resources ...14
CPU Utilization ... 14
Storage Utilization ... 14
Network Utilization ... 14
Disk I/O ... 15
Memory Utilization ... 15
Top and Bottom Virtual Machines Analysis ... 16
Conclusion ...16
Appendix...18
Estimated Costs Used in Cost Savings Calculations: ...18
List of Figures Figure 1: Misallocation/ Preferred Operating Zones ... 5
Figure 2: Example of Capacity Planning Optimization Plan ...11
Figure 3: Capacity Planning Recommendations...12
Figure 4: Average CPU Utilization (%) for vSphere Servers ...14
Figure 5: Average Network Utilization I/O ...14
Figure 6: Disk I/O ...15
Figure 7: Memory Utilization ...15
List of Tables
Table 1: Capacity Planning Recommendation ... 4 Table 2: Cost Savings Results from Capacity Optimization ...13 Table 3: Cost Estimates Used in Cost Savings Calculations ...18
Executive Summary
The reality of today’s economic environment puts a premium on management and governance programs that reduce costs. Many enterprises are addressing systemic issues in operations and administrative processes by implementing virtualized infrastructure and cloud computing, two related approaches that have proven to be effective.
Many companies reducing operating costs through server virtualization find that fully realizing benefits requires automated capacity planning and optimization. Such an approach allows organizations to balance optimization with business and IT operational concerns around risk, efficiency and costs. This is a complex process; especially in VMware-based virtualized
environments as they attempt to balance shared server resources and minimize business risk with low cost implementation. Recently, an IBM customer did just that. Here is a sample of the results. Table 1 shows the recommendations from IBM’s planning and optimization tool, advising a reduction in physical and virtual servers, and resulting in a potential cost savings of $153,980 (14.3%). The benefits result from fine-tuning VMware server resources based on the capacity analysis for 3 clusters with 15 physical servers. Server usage data showed that the servers required to run existing workloads could be reduced from 15 vSphere servers to 11. Server utilization efficiency improved nearly 20%. VMware licensing, hardware, server administration management data center cooling, and power consumption costs were also reduced.
Table 1: Capacity Planning Recommendation
Whether a data center is operating with traditional physical assets, in transition from virtualization to cloud, or as a fully virtualized cloud environment, capacity planning and workload management benefits are achievable. The goals are assuring an optimal consumer service experience and realizing business operational benefits while increasing IT efficiency. The message is that such efforts pay off. The Challenge in Managing Costs
The ease of communications and reach of today’s economy means competing on a global scale for additional revenue. Competition is a ‘click’ away in the form of a virtual company with minimal overhead. The result is that the cost of doing business is under constant scrutiny to achieve the maximum return. Often, the ‘business’ is in service delivery itself, which requires near constant
Amou nt of Re source All o cated Operational Requirements/Demand Under allocation (Risk) Over allocation (Waste) (Waste)
adjustment to assure quality and relevance. Best practices mandate management that strives for continuous improvement in such cost control and reduction activities.
For IT, this means tighter budgets and making do with existing infrastructure in the face of
increasing demands for more, better and faster delivery of new and existing services. The traditional response to those pressures is increased automation, process improvement and a laser-like focus on proactive infrastructure management to assure optimal resource utilization and allocation.
In traditional IT operations, typical utilization levels are less than 30%. Cloud and virtualized infrastructure promise to double and triple these levels. The benefits are achieved by reconfiguring, re-provisioning and reassigning resources in response to changing operational and business realities. However, maintaining high levels of utilization, optimizing the allocation of infrastructure resources, meeting Service Level Agreements and controlling costs require management services beyond simply avoidance of virtual sprawl. It requires attention to the overall environment including pro-active software license management and juggling workloads to minimize licensing fees.
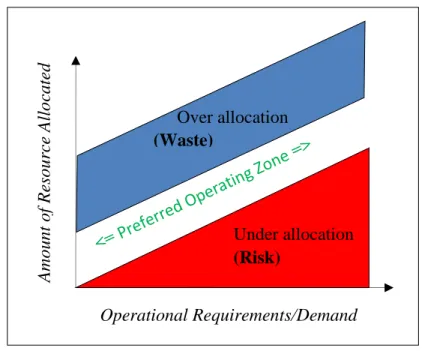
Let’s look at the basic problem. A risk/wasted resource tradeoff diagram (Figure 1) illustrates the challenge facing IT staff. It shows resource allocation versus operational requirements. There is the risk of allocating too little resource capacity (e.g. compute capacity, insufficient bandwidth). The organization risks failure to meet service delivery demand that matches expectations or meets SLA commitments. This can lead to lost sales, upset customers, tarnished reputation, etc.
To avoid these situations, operations will use less effective, often more expensive service delivery strategies to minimize or avoid poor performance. Such strategies carry their own penalties in the form of unplanned costs, disruption to other services, reduced delivery capacity, etc. (area bounded in red).
On the other side is resource over-allocation (i.e. purchasing and reserving more server, storage, network or license)
capacity than necessary), resulting in idle resources. Excess resources are held in reserve to add capacity during peak demand periods (area bounded in blue).
Figure 1: Misallocation/ Preferred Operating Zones
Companies may also choose to over-buy resource capacity to handle forecast growth in demand. However, it sometimes does makes sense to buy at today’s prices, or with one ‘install’ rather than
risk not being able to add capacity quickly enough or at considerably greater expense when required. Lacking formal analysis (and sometimes even with it) built-in excess capacity can exceed 30%. The challenge is managing infrastructure and resource capacities optimally, represented by the band between these two extremes. This is the space between the red and blue triangles. The problem is accurately determining the proper mix and, second, accurately allocating it on an on-going basis to remain in this operational “sweet spot”.
It is clear that well managed cloud and virtualized environments can dramatically improve server utilization. However, it requires a special solution to ensure performance and availability while improving ROI and keeping down the cost of operations. Let’s examine some of those requirements. Solution Requirements / Profile
Even today, many IT operations staff must work with little timely or substantive data to help them accurately determine what to do. Most shops end-up making do with a ‘seat of the pants’ intuitive approach or back of the envelope estimates. The availability of automated, analytics-based workload and capacity management solutions that minimize or eliminate guess-work can change this. The goals of an optimization solution include increasing resource utilization through automation,
improving service quality and cost control. An acceptable solution will also consider the impact and interactions within and across the complete virtual and physical environment of operations.
For example, consider the data and information needed to assure smooth and consistent delivery of a service running on a virtual system. The virtual server is one of many virtual systems sharing resources on a single physical server or a cluster of physical servers. To optimize operations, a solution must consider the interactions and resulting interdependencies that may affect the virtual server’s performance. It must be able to adjust for the demands of other virtual systems delivering services, as well as shifting, changing loads and demands on the physical infrastructure underneath it all. It must also identify and analyze key bottlenecks, as well as integrate and process data with an understanding of infrastructure and system capacities, dependencies and interactions.
When making choices or proposing proper actions, the solution must be able to include not just operational data, but integrate considerations and constraints related to achieving business goals and objectives. For example, a customer might want to provide more capacity for certain business applications or middleware components to ensure guaranteed performance objectives and customer commitments are met. A solution must also provide recommendations in ways that are meaningful to both IT and business staff. It must identify and calculate hidden capacities, as well as identify and estimate risks to make recommendations that reduce costs, maximize savings, and/or minimize risk. The Heterogeneous Virtualized Environment
The reality of today’s enterprise computing environments is that most include servers and
hypervisors from different vendors. An IT operations center will often include a mixture including VMware, XEN, Microsoft Hypervisor, KVM, PowerVM etc. Therefore, the tool must work with
multiple hypervisor platforms. If the tool lacks some support today but plans to extend detailed capacity analysis across all hypervisors, this is a definite plus1.
It must also work with existing management tools, whether they are sophisticated tools or native vendor tools providing basic management functions such as VMware’s vCloud Suite. The best solutions complement hypervisor vendor tools.
The balance of this paper focuses on optimizations that reduce costs for customers operating in a VMware environment with recommendations for policy-based capacity planning and workload management. The case study describes how an IBM customer benefited from the IBM SmartCloud Monitoring (SCM) capability that analyzes and makes specific recommendations for reducing environment costs.
Choosing IBM SmartCloud Monitoring
IBM® SmartCloud™ Monitoring tracks the health, relationships and performance of private cloud infrastructures with physical and virtualized resources. Monitoring capabilities provide detailed visibility into the performance of storage, network and server resources.
SCM performs business- and technical-policy driven analysis that enables more effective cost reducing capacity planning and workload placement. By applying embedded predictive and
historical analytics, IT staffs are better informed to make more accurate resource allocation decisions. They have access to data and information that allows proactive action to prevent cloud service
outages and reduce operational, administrative, licensing and capital costs. In-depth analysis generates detailed recommendations for infrastructure configuration, provisioning, allocation and workload placement to manage, control and reduce expenses. The case study below details how one customer reduced VMware licensing costs by 26.6% while lowering operational and capital costs. IBM SmartCloud Monitoring provides:
Visibility into the cloud infrastructure, including both physical and virtualized components. Monitoring of heterogeneous environments for visibility and control into all areas of the
infrastructure—physical, virtual and cloud.
What-if capacity analysis models changes, reduces risk, improves availability and lowers energy and server costs.
Policy-driven analytics for intelligent workload placement.
The result is greater visibility into cloud infrastructure operations and complex virtualized systems. This reduces the time needed to identify and resolve issues yielding productivity savings and minimize impact costs which, in turn, increase customer satisfaction, a core business objective. Additional ways that SCM benefits IT and business operations include:
1
For example, in February 2013, IBM added PowerVM support to its existing VMware support for its SmartCloud Monitoring product.
SCM’s multiplatform support provides IT staff with a single interface to an end-to-end view for monitoring heterogeneous environments, simplifying management and reducing costs. SCM’s Capacity and Performance Analytics help users properly size the virtual environment,
balance workloads, and optimize or increase virtual environment density. This improves availability by preventing resource contention, and adds to overall cost savings.
SCM maps detailing relationships and dependencies between physical network / storage devices and virtual devices speeds problem resolution, which result in improved operational efficiency, simplified management and an overall reduction in costs.
Virtualization Optimization
The majority of the IT (x86) server spend has shifted to virtualization software, service management and administration. Cost control efforts, along with the documented cost savings of earlier capacity planning, drives increasing interest in managing virtualized infrastructure to optimize cloud services. Today, with SCM and complementary products, IBM has a comprehensive solution for virtualization optimization. The following describes a workload optimized cloud environment and three additional and complementary products that provide its foundation.
There are four primary ways to optimize service delivery in the cloud. These are:
1. Optimizing cloud and image management 2. Automating data resilience and protection 3. Health and performance monitoring
4. Integrating security and patch management
IBM has existing products that provide all of these capabilities. In addition to IBM SmartCloud Monitoring, these include:
IBM SmartCloud Patch Management combines endpoint patch management with cloud computing to help configure and manage physical, virtual and cloud computing assets. Optimizes patching cycles, provides image management and analytics and visibility for system control.
IBMSmartCloud Provisioning has image management and includes a provisioning engine and system to dynamically create or provision virtual machines (VM). It creates hundreds of VMs in less than a minute and scales to over 4,000 VMs in less than an hour.
Tivoli Storage Manager Suite for Unified Recovery contains Tivoli Storage Manager for Virtual Environments, which protects virtual machines by offloading backup workloads to a centralized server and enabling near-instant recovery.
VMware Capacity Optimization Case Study
Allocating virtualization resources using an information-based approach enables IT organizations to balance risk and costs more deftly. IT and the companies they serve experience real financial
benefits and savings by right-sizing virtualization resources, instead of building-in cushions “just-in-case”. The difference between “right-sized” and “just-in-case” resource allocations are idle, wasted resources that could be used for other business critical applications, for future growth, or to meet
periodic demand spikes. More importantly, in pay-for-use cloud environments, resource optimization delivers direct cost savings.
This IBM customer case study provides a real-world example of the financial benefits that can be realized from analyzing and optimizing an existing VMware environment using capacity analysis. These cost savings are in addition to any savings realized when virtualization was implemented.
The Customer and Their Environment:
The customer is a large multinational pharmaceutical enterprise with an IT environment including ten geographically dispersed data centers in the U.S., Canada and Europe. The customer wanted to optimize their VMware environment, so the capacity analysis focused on three vSphere clusters in the main data center, which contain 15 vSphere servers with 3,088 GB memory.
The hardware models in the three VMware clusters are similar. All data stores are mapped to the three vSphere clusters, allowing the customer to use vMotion to move virtual machines between clusters without shutting down the virtual machines. Resource pools are not used in the environment. The customer uses VMware’s vSphere Distributed Resource Scheduler (DRS), which monitors utilization across servers and allocates resources.
The customer also uses IBM SmartCloud Monitoring (SCM) to monitor and collect data from the existing environment. The virtualization analysis leverages this resource usage data. The capacity planning tool used in this case study is a component of the IBM SCM solution, which the customer was already licensing.2
Customer Objectives:
The customer’s key objectives were to optimize their VMware environment and reduce risks in the environment. An important aspect in achieving these objectives depended on better visibility into their virtualization environment, enabling them to identify potential areas of risk as well as wasted resources. The specific areas of interest included:
Determine if any virtual machines have over allocated memory
What-if analyses both within and across clusters to understand the current usage and remaining capacity Identify virtual machines with too many virtual CPUs
assigned.
2 Authors’ note: Although Return on Investment (ROI) is the typical method for reporting on the financial aspects of IT investment and action, the authors chose to not use ROI for this case study, primarily for clarity. The cost savings benefits are valid and reasonable. However, since the customer was already using the IBM SCM solution, an ROI analysis without the SCM software and deployment costs could be confusing for customers considering the IBM SCM solution. So for clarity and accuracy’s sake, the results are presented as cost saving benefits from VMware virtualization optimization.
IBM Customer Case Study: VMware Capacity
Optimization Results Summary VMware Optimization Cost Savings $153,980 Savings Percentage 14.3%
Better reporting for memory usage in Linux machines, specifically because of Linux’s virtual machine memory management, which will use all available physical memory. Based on their growth trends, the customer used the excess capacity to add more workloads to the VMware environment, instead of shutting down ESX servers to save costs. The customer will expand their virtualization use by moving more physical servers into their virtual environment. SmartCloud Monitoring Capacity Planning
This virtualization capacity analysis was performed using the IBM SmartCloud Monitoring Capacity Planning (SCM-CP) tool. Leveraging current resource usage, configuration and performance data collected by SCM, the Capacity Planning tool enables users to see, analyze, optimize and plan their virtualization resources and environment.
Overview
The SCM-CP tool is designed for ease of use (not solely by capacity planning professionals); it also allows tailoring for more accurate characterizations of specific virtualization environment attributes. Ease of use is delivered in various ways, such as:
Using off-the shelf system performance benchmarks, instead of requiring users to enter extensive performance data for each type of hardware component.
Collecting usage, configuration and performance data from existing sources, minimizing the requirement for user defined data.
Out-of-the-box policy templates (described below)
Capacity planning model can be run using pre-set defaults or in expert mode. Flexibility in tailoring the capacity analysis in several ways:
Configuration profiles – for grouping similar VMs and hosts for optimizations
Usage profiles – for characterizing workloads running inside the VMs, which assists the optimizer with workload placement
Policies – for defining business and technical policies that inform the optimization with specific requirements or constraints for the customer’s environment. (For example, the case study customer keeps Oracle servers in the same cluster to minimize licensing costs. This is due to Oracle’s requirement that the entire cluster where Oracle VMs are running must be licensed.
What-if analysis – capacity planning for growth, change or the future
Capacity Planning Model
The capacity planning model can be run once the virtualization environment data is collected, and relevant profiles and policies are defined. Users can choose to run the SCM-CP tool in simple mode or expert mode. In simple mode, the complexity of capacity analysis is hidden from users by running the model using pre-set defaults. In expert/advanced mode, experts can do more customizing. In either case, it is a five step process, beginning with data import and ending with plan generation.
Step 1: Snapshot Configuration Data - Begins the process by loading a snapshot copy of the configuration data. (The copy allows manipulation of the local data for what-if analyses.)
Step 2: Set Analysis Time Period - Set the time range of the historical monitoring data that
will be analyzed by indicating the starting and ending dates and times.
Step 3: Define the Scope of the Infrastructure for Analysis – Select the servers to analyze.
Simple mode: The default scope includes all physical servers (using the data that was loaded in step 1.)
Expert mode: advanced users can select specific servers from a list of available servers that will be analyzed. For example, specific VMware clusters, servers in a selected location, etc.
Step 4: Size Virtual Machines – Determine VM sizings based on historical usage.
Simple mode: analyzes the monitoring data within the analysis time range specified and automatically sizes virtual machines using the average daily utilization.
Expert mode: advanced users can customize VM sizing and add other workload attributes.
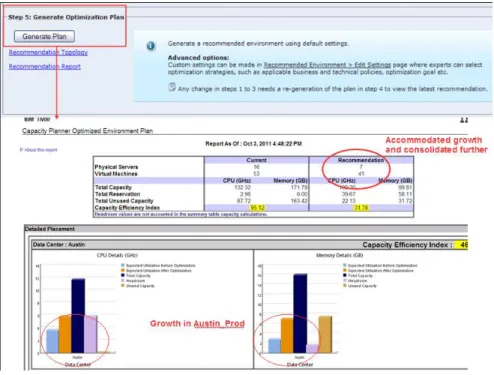
Step 5: Generate Optimization Plan – The optimization engine analyzes the data and
automatically generates an optimization plan with virtualization environment recommendations. (One component of an optimization plan is shown in Figure 2.)
Simple mode: Generates the optimization plan using default settings.
Expert mode: advanced users can customize the optimization plan by applying business or technical policies, or other optimization strategies.
IBM Customer VMware Capacity Analysis Results
The Optimization Plan contains the results from the capacity analysis, including overall recommendations, graphs depicting resource usage for the analyzed servers, and additional information to help understand what is happening in the VMware environment. Reviewing the capacity analysis optimization results can provide valuable insights into resource bottlenecks, wasted resources, potential risk from under-provisioned servers and more.
Capacity Planning Recommendations
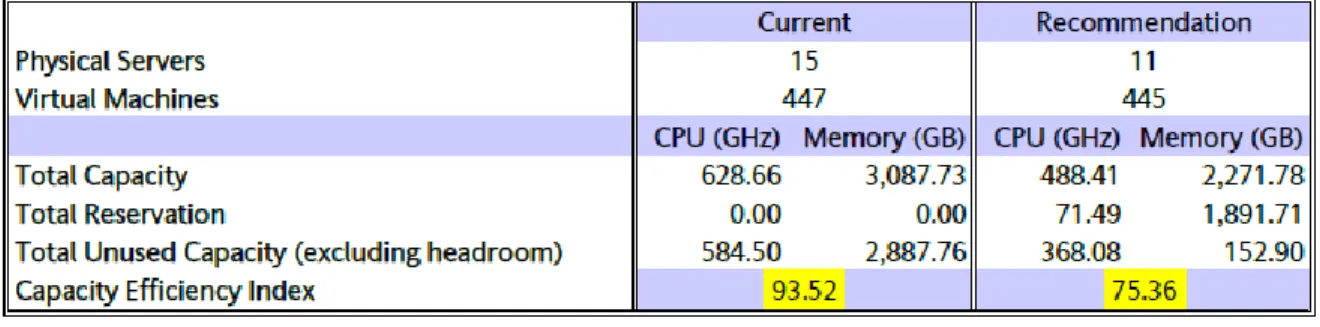
The customer’s capacity planning analysis overview recommendations are shown in Figure 3.3 It recommends that the customer’s existing workloads can be run on 11 physical servers instead of the 15 servers it is using, potentially freeing up 4 physical servers. It also recommends eliminating 2 virtual machines. From a resource perspective, memory can be reduced from 3,088 GB to 2,272 GB, and CPU can be reduced from 629 GHz to 488 GHz.
Figure 3: Capacity Planning Recommendations
Although these technical reduction numbers are important and interesting, the value of virtualization optimization becomes even more apparent when the recommendations are analyzed from a financial perspective, revealing the potential cost savings from streamlining vSphere server resources.
Capacity Planning Recommendations: Cost Savings Analysis
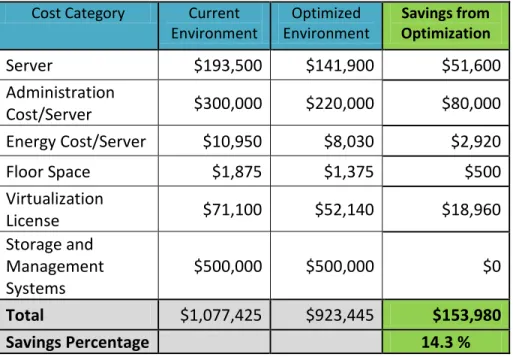
The SCM Capacity Planning tool also provides a cost savings analysis (Table 2) of the optimization recommendations based on user provided cost estimate data.4 This cost analysis includes
comparative costs for the current and optimized environments, reflecting the changes in costs for the server hardware, server administration, energy, floor space, VMware licenses, and storage
management systems. In this particular case, no storage changes were made.
The total estimated cost savings from the optimizations are $153,980, which equates to a 14.3% cost reduction to maintain the environment for one year. 5 Keep in mind that these cost savings only reflect the recommended optimizations for these three clusters.
3
This capacity analysis was run without advanced customizations. No policies were used for weighting business applications, or providing more capacity for mission critical virtual machines. All virtual machines were treated equally. Defaults configurations were used, which includes 10% CPU and 10% memory headroom.
4
Estimate data used for the cost analysis for this IBM customer is provided in the Appendix.
5 The capacity plan for the IBM customer used memory headroom defaults because of the customer’s growing
Since this customer is growing their virtualization environment, they will use the capacity and resources gained from optimization to add more workloads to the VMware environment. Instead of actual cost savings, they use the optimization savings to avoid additional investment in more hardware, software, and associated costs to accommodate additional workloads they plan to add to the virtualized environment.
Cost Category Current Environment Optimized Environment Savings from Optimization Server $193,500 $141,900 $51,600 Administration Cost/Server $300,000 $220,000 $80,000 Energy Cost/Server $10,950 $8,030 $2,920 Floor Space $1,875 $1,375 $500 Virtualization License $71,100 $52,140 $18,960 Storage and Management Systems $500,000 $500,000 $0 Total $1,077,425 $923,445 $153,980 Savings Percentage 14.3 %
Table 2: Cost Savings Results from Capacity Optimization More Potential Savings for the IBM Customer
As noted earlier, this capacity optimization analysis for the customer was limited to three vSphere clusters in their main data center. The customer has clusters in other data centers with far more capacity. So, this customer’s potential savings could be higher if capacity optimization is performed on the vSphere clusters in other data centers.
To simplify the capacity optimization analysis, as previously noted in Footnote 5, memory headroom of 10% was used instead of over-committing memory. On closer examination of the memory
analysis, many of the customer’s virtual machines were using only a small percentage of their allocated memory. The extra reserved memory for these virtual machines will be wasted if memory utilization is not over-committed. An additional recommendation is adjusting memory allocations closer to the actual memory being used by these servers. This fine-tuning of memory allocations could also increase the cost savings.
memory for capacity planning purposes. It is important to note that using memory headroom instead of memory over-commit, will likely result in more conservative optimization recommendations and cost saving estimates. This means that environment optimization and cost savings potential will probably be higher for customers using memory over-commit.
Technical Analysis of vSphere Server Resources
Besides recommending reducing the number of vSphere servers to run workloads, the results provided interesting insights into virtualization resource usage and allocations that the team could act upon. Additional insights into the environment result from looking at the status of resources used by virtual and physical servers, including CPU, memory, network I/O, disk space, and disk I/O. Here is a brief overview of those results and subsequent conclusions.
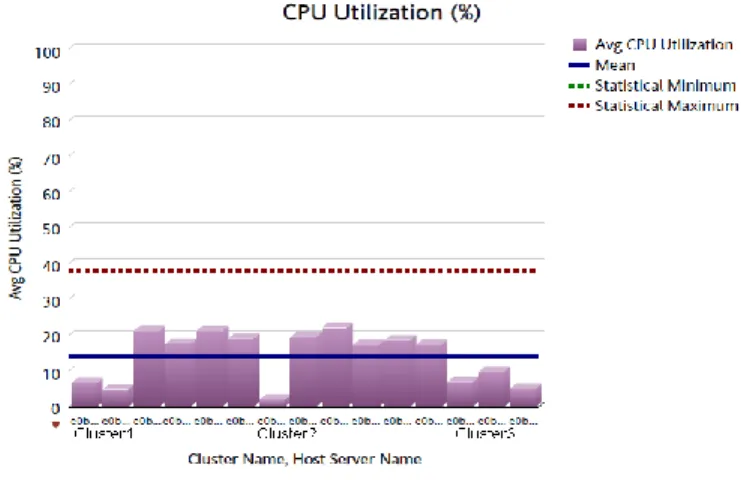
CPU Utilization
CPU utilization appears low across all clusters, as shown in scheduling of off-hours CPU intensive workloads could be spread out. Figure 4. There is some imbalance between vSphere servers, but given the low CPU utilization rates, this is not a major concern at this time.
In addition to looking at average CPU utilization, they looked at detailed metrics identifying peak utilization periods. They found that peak CPU utilization occurs between 11PM and 4 AM, likely due to batch processing, virus scanning and backups. This is not an immediate concern because of the low CPU utilization rates, but in the future,
scheduling of off-hours CPU intensive
workloads could be spread out.
Figure 4: Average CPU Utilization (%) for vSphere Servers
Storage Utilization
The data showed that storage capacity was adequate and identical across all clusters. There are no issues with storage utilization at this time.
Network Utilization
reveals
significant network utilization variations across vSphere servers and clusters. The team noted two vSphere servers with higher network I/O rates than the other servers. Since the customer uses 10 Gigabit
networking, it is not an immediate cause for concern but may require further investigation to understand the workloads driving the high
network I/O rates. Figure 5: Average Network Utilization I/O
Disk I/O
Figure 6 shows a significant imbalance of Disk I/O across the clusters. Ideally, it is better to have similar workload characteristics across the clusters.
This indicates the need for further investigation into the latency for the various data stores, in order to identify disk I/O performance issues.
Figure 6: Disk I/O
Memory Utilization
The graph in Figure 7 shows overall memory utilization is fairly high. Capacity is still available, but memory appears to be the biggest bottleneck in the vSphere environment.6
Memory utilization for Cluster 3 is lower than the other two clusters, which indicates a potential opportunity to balance the workload and memory utilization across the clusters. The customer’s memory utilization trend data shows that it has been growing or remaining constant over the past 60 days. Since the customer’s environment is growing, they have a choice: they can either rebalance memory utilization across the clusters now or they can add new workloads to Cluster 3, which has the lowest memory utilization.
6
The server showing almost no memory utilization was in maintenance mode during the analysis time period.
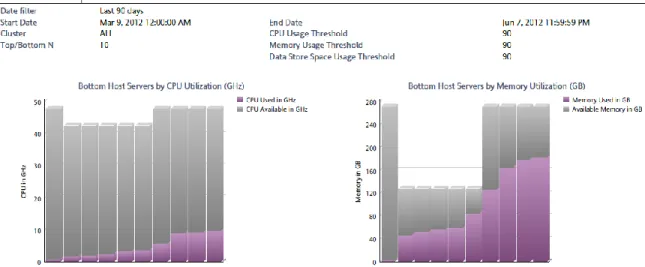
Top and Bottom Virtual Machines Analysis
The capacity analysis also provides valuable information about the top 20 and bottom 20 virtual machines consuming resources. In addition, the analysis also highlights other Top 10 lists, such as At Risk Virtual Machines, Top Recommended CPU Optimizations, and Top Recommended
Memory Optimizations. Closer scrutiny of these lists may reveal issues with virtual servers on both extremes of the spectrum, enabling customers to specifically target optimizations for these servers. For example, the customer’s top 20 virtual machines are near or exceeding 100% memory utilization. The customer may consider increasing the memory allocated to these virtual servers.
On the other end of the spectrum, the bottom 20 virtual machines are over-allocated for CPU and memory, as shown in Figure 8. The customer stands to gain additional resources by adjusting the resource allocations to reflect actual usage.
Figure 8: Bottom Workload Consumers - vSphere Servers Conclusion
The IBM customer profiled in this case study achieved their objectives of optimizing the VMware environment and reducing risks by using the capacity analysis provided by IBM SmartCloud Monitoring - Capacity Planning. The capacity optimization provided their team with optimization recommendations (both overview and detailed server recommendations) based on real resource usage information. It also provided clear visibility and insight into virtualization usage patterns and capacity, allowing the IT team to confidently sculpt and right-size their virtual machine resources to efficiently service workloads.
The IT team also achieved another bonus from this effort, which was financial perspective on the cost savings gained from virtualization optimization. Although the customer chose to use the
savings perspective helps IT teams to understand the associated costs linked with IT activities they view as primarily technical in nature. The value of this financial understanding cannot be
understated, with the constant cost pressures placed on IT.
The customer realizes real benefit from trusted optimization recommendations for reduction of hypervisor and related costs, especially when the recommendations are based on the customer’s business and operational needs. Optimized virtualized environments enable IT to optimize resource utilization, minimize risk, and minimize their costs – or alternatively, doing more with less.
Although virtualization capacity planning and optimization are typically viewed as a technical issue, in the end, both IT and the business benefit from it.
Appendix
Estimated Costs Used in Cost Savings Calculations:
The following table lists the estimated costs used in the cost savings calculations. These values are used for illustration purposes only and may not reflect actual costs. These costs may vary
significantly, depending on location.
Cost Category Cost/Year (USD)
Server $12,900 Average VM Cost $1,500 Administration Cost/Server $20,000 Administrative Cost/VM $228 Energy Cost/Server $730 Energy Cost/VM $9 Floor Space $125 Virtualization License $4740
Storage and Management Systems $500,000
Publication Date: January 24, 2013
This document is subject to copyright. No part of this publication may be reproduced by any method whatsoever without the prior written consent of Ptak Noel & Associates LLC.
To obtain reprint rights contact [email protected]
All trademarks are the property of their respective owners.
While every care has been taken during the preparation of this document to ensure accurate information, the publishers cannot accept responsibility for any errors or omissions. Hyperlinks included in this paper were available at publication time.
About Ptak, Noel & Associates LLC
We help IT organizations become “solution initiators” in using IT management technology to business problems. We do that by translating vendor strategy & deliverables into a business context that is communicable and actionable by the IT manager, and by helping our clients understand how other IT organizations are effectively implementing solutions with their business counterparts. Our customers recognize the meaningful breadth and objectively of our research in IT management technology and process.
www.ptaknoel.com
About the Authors
Rich Ptak has over 30 years experience in systems product management working closely with Fortune 50 companies in developing product direction and strategies at a global level. Previously Ptak held positions as senior vice president at Hurwitz Group and D.H. Brown Associates. Earlier in his career he held engineering and marketing management positions with Western Electric’s Electronic Switch Manufacturing Division and Digital Equipment Corporation. He has been frequently quoted in major business and trade press such as The Wall Street Journal, BusinessWeek, InformationWeek, and ComputerWorld and is author of “Manager’s Guide to Distributed Environments” (John Wiley & Sons, 1998). In addition, Ptak was technical editor of “Cisco Internet Architecture Essentials Study Guide: Cisco Internet Solutions Specialist” by Mathew Recore, Jeremy Laurenson, and Scott Herrmann (Cisco Press, 2002). Ptak holds a master’s in business administration from the University of Chicago and a master of science in engineering from Kansas State University.
Audrey Rasmussenleverages her experience of over 30 years in the information technology industry, to help her clients as they navigate through the accelerating changes in the information technology industry. Over the years, she has developed experiences in various contexts (expertise in systems and application management, working with very small companies to very large corporations, industry specializations, business focus, and technical focus), which combine into unique insights into the information technology industry. Audrey holds a Bachelor of Science in business administration/finance from the University of Southern California.