ISSN: 2347-7474
International Journal Advances in Social Science and Humanities
Available online at: www.ijassh.com
RESEARCH ARTICLE
Madanmohan M &Vijaya Kumar K|April 2016 | Vol.4 | Issue 04 |21-25 21
Utilization and Awareness of E-Resources by the Faculty Members
of Medical Colleges in Tamilnadu and Puducherry: A Study
Madanmohan M*
1, Vijaya Kumar K
21Department of Library and Information Science, Bharathiyar University.
2Department of Library and Information Science, Annamalai University.
Introduction
Information means the communication of knowledge about an event of a given condition or the spread of knowledge derived from observation, study, experience or instruction. Bhattacharyya1 (1978)
“Information is the message conveyed or intended to be conveyed by a systematized body of ideas, or its accepted or acceptable substitutes”. “Information has become an essential commodity for the man to perform his day-to-day duties”. Information is a resource of immense economic and social value. It is vital to the proper functioning of a democratic society, a crucial tool in a productive economy and an effective government, a central part of the growth and well-being of individuals.
Objectives
To study the information communication needs of the Medical Scientist.
Results and Discussion
A study of data in table 1 indicates Medical College wise respondents’ information communication sharing behaviour. It could be noted that out of the total 839 respondents, 21.75 percent of them freely share most of the information with their subordinates and juniors and 18.25 percent of them share only certain information. Of the total 839 respondents, 32.25 percent of them share not much of the information with their subordinates and juniors and the rest 27.75 percent of them share no
1. Bhattacharyya,G.: “Information science : A Unified view at through a system Approach ”, Calcutta, IASLIC, 1978, p.18.
information with their subordinates and juniors.
It is seen from the table that out of the total 839 respondents, 19.25 percent of them freely share most of the information with their peers and colleagues and 31.75 percent of them share only certain information. Of the total 839 respondents, 26.25 percent of them share not much of the information with their peers and colleagues and the rest 22.75 percent of them share no information with their peers and colleagues.
It is observed from the data in table that out of the total 839 respondents, 29.75 percent of them freely share most of the information with their superiors and 15.25 percent of them share only certain information. Of the total 839 respondents, 16.25 percent of them share not much of the information with their superiors and the rest 38.75 percent of them share no information with their superiors.
Available online at: www.ijassh.com
Madanmohan M &Vijaya Kumar K|April 2016 | Vol.4 | Issue 04 |21-25 22
Table 1: Medical College wise respondents’ information access behaviour
Colleges
Subordinate and juniors Peers and colleagues
No information is shared
Not much of information is shared
Certain information is shared
Most of information is freely shared
No information is shared
Not much of information is shared
Certain information is shared
Most of
information is freely shared MMMC & GH (27.27) 12 (45.45) 20 (9.09) 4 (18.18) 8 5(4.55) 29 (18.18) 8 (9.09) 4 (18.18) 8 Chengalpattu
Medical College (43.24) 32 (13.51) 26 (21.62) 24 (21.62) 16 (32.43) 36 (21.62) 22 (18.92) 14 27.03 20 Madruai Medical
College & Hospital
42 75 32 42 25 46 100 38
(24.71) (41.18) (18.82) (15.29) (11.76) (21.18) (49.41) (17.65)
Kilpauk Medical
College (8.62) 27 (25.86) 35 34.48 45 (31.03) 40 (25.86) 35 (39.66) 56 (25.86) 35 (8.62) 10 Stanley Medical
College (21.43) 18 (40.48) 34 (14.29) 12 (23.81) 20 (9.52) 8 (30.95) 26 (42.86) 41 (16.67) 18 Tanjore Medical
College (41.86) 46 (25.58) 22 (11.63) 10 (20.93) 18 (30.23) 26 (20.93) 18 (23.26) 20 (25.58) 27 Thirunelvelli
Medical College
12 14 8 10 12 10 8 14
(27.27) (31.82) (18.18) (22.73) (27.27) (22.73) (18.18) (31.82)
Coimbatore
Medical College 52.00 26 (12.00) 11 (20.00) 10 (16.00) 8 (28.00) 14 (36.00) 18 (12.00) 6 (24.00) 12 Jipmer (27.50) 22 (45.00) 36 (7.50) 6 (20.00) 16 (15.00) 12 (20.00) 16 (45.00) 36 (20.00) 16
Total (27.75) 237 (32.25) 273 (18.25) 151 (21.75) 178 (22.75) 192 (26.25) 220 (31.75) 264 (19.25) 163
Table 2 : Education wise respondents’ information Communication sharing behaviour
Education
Subordinate and juniors Peers and colleagues
No
information is shared
Not much of information is shared
Certain information is shared
Most of
information is freely shared
No
information is shared
Not much of information is shared
Certain information is shared
Most of
information is freely shared M.B.B.S. (21.11) 38 (26.67) 48 (23.33) 42 (28.89) 52 (18.89) 34 (26.67) 48 (24.44) 44 (30.00) 54 M.B.B.S with
Diploma (19.05) 13 (28.57) 17 (14.29) 6 (38.10) 15 (28.57) 12 (28.57) 12 (28.57) 12 (14.29) 6 M.D (34.58) 158 (37.85) 172 (11.68) 50 (15.89) 68 (25.23) 118 (21.03) 90 (37.85) 162 (15.89) 68
M.S (18.67) 28 (24.00) 36 (32.00) 53 (25.33) 43 (18.67) 28 (40.00) 70 (24.00) 46 (17.33) 35
Total (27.75) 237 (32.25) 273 (18.25) 151 (21.75) 178 (22.75) 192 (26.25) 220 (31.75) 264 (19.25) 163
Source computed
Figures in parentheses denote percentages
The Medical College wise analysis reveals the following facts. The respondents of Madurai Medical College constitute more number with respect to sharing freely most of the information with their superiors (60.30%), with their subordinates and juniors (31.06%) and with others (51.72%) than those of others. The respondents of Tanjore Medical College constitute more number with respect to sharing freely most of the information with their peers and colleagues (31.82%) than those of others.
The ANOVA two way model is applied for further discussion. At one point, the computed ANOVA value is 5.71, which is greater than its tabulated value at 5 percent level of significance. Hence, there is a significant variation with respect to chosen components of most of the free information sharing behaviour. From another point of view, the computed ANOVA value is 1.23, which is lesser than its tabulated value at 5 percent level of significance.
Education
Superior Others
Total No
information is shared
No information is shared
Not much of information is shared
Certain information is shared
Most of
information is freely shared
Not much of information is shared
Certain information is shared
Most of
information
is freely
shared
Madanmohan M &Vijaya Kumar K|April 2016 | Vol.4 | Issue 04 |21-25 23 Hence, variation among the chosen Medical
Colleges is statistically identified as insignificant with respect to respondents’ most of the free information sharing behaviour.
It could be seen clearly from the above discussion that sharing freely most of the information with superiors constitutes first order of information sharing behaviour among the respondents of selected Medical College followed by sharing information with others, sharing information with subordinates and sharing information with peers and colleagues.
A study of data in table 2 indicates education wise respondents’ information and communication sharing. The education wise analysis reveals the following facts. The M.B.B.S. with Diploma level educated respondents constitute more number with respect to sharing freely most of the information with their subordinates and juniors (38.10%) and with others (28.57%) than those of others. The MD level educated respondents constitute more number with respect to sharing freely most of the information with their superiors (40.65%) than those of others.
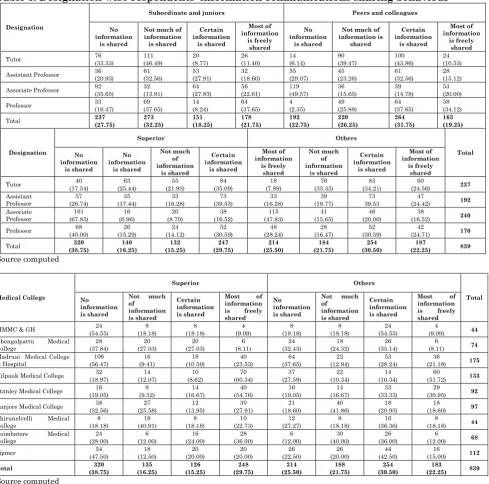
Table 3: Designation wise respondents’ information communications sharing behaviour
Designation
Subordinate and juniors Peers and colleagues
No information
is shared
Not much of information is shared
Certain information
is shared
Most of information
is freely shared
No information
is shared
Not much of information is
shared
Certain information
is shared
Most of information
is freely shared Tutor 76 (33.33) 111 (46.49) 20 (8.77) 26 (11.40) 14 (6.14) 90 (39.47) (43.86) 100 24 (10.53)
Assistant Professor 36 (20.93) 61 (32.56) 53 (27.91) 32 (18.60) 55 (29.07) 45 (23.26) (32.56) 61 28 (15.12)
Associate Professor 92 (35.65) 32 (13.91) 64 (27.83) 56 (22.61) 119 (49.57) 36 (15.65) (14.78) 39 53 (20.00)
Professor 33 (16.47) 69 (37.65) 14 (8.24) 64 (37.65) 4 (2.35) 49 (25.88) (37.65) 64 58 (34.12)
Total 237 (27.75) 273 (32.25) 151 (18.25) 178 (21.75) 192 (22.75) 220 (26.25) (31.75) 264 163 (19.25)
Designation
Superior Others
Total No
information is shared
No information
is shared
Not much of information
is shared
Certain information
is shared
Most of information
is freely shared
Not much of information
is shared
Certain information
is shared
Most of information
is freely shared
Tutor (17.54) 40 (25.44) 63 (21.93) 55 (35.09) 84 (7.89) 18 (33.33) 76 (34.21) 83 (24.56) 60 237 Assistant
Professor (26.74) 57 (17.44) 35 (16.28) 33 (39.53) 73 (16.28) 33 (19.77) 39 39.53 73 (24.42) 47 192 Associate
Professor
161 16 20 38 115 41 46 38 240
(67.83) (6.96) (8.70) (16.52) (47.83) (15.65) (20.00) (16.52)
Professor (40.00) 68 (15.29) 26 (14.12) 24 (30.59) 52 (28.24) 48 (16.47) 28 (30.59) 52 (24.71) 42 170 Total (38.75) 320 (16.25) 140 (15.25) 132 (29.75) 247 (25.50) 214 (21.75) 184 (30.50) 254 (22.25) 187 839
Source computed
Medical College
Superior Others
Total No
information is shared
Not much of information is shared
Certain information is shared
Most of
information is freely shared
No information is shared
Not much of information is shared
Certain information is shared
Most of
information is freely shared
MMMC & GH (54.55) 24 (18.18) 8 (18.18) 8 (9.09) 4 (18.18) 8 (18.18) 8 (54.55) 24 (9.09) 4 44 Chengalpattu Medical
College (37.84) 28 (27.03) 20 (27.03) 20 (8.11) 6 (32.43) 24 (24.32) 18 (35.14) 26 (8.11) 6 74 Madruai Medical College
& Hospital (56.47) 106 (9.41) 16 (10.59) 18 (23.53) 40 (37.65) 64 (12.94) 22 (28.24) 53 (21.18) 36 175 Kilpauk Medical College (18.97) 32 (12.07) 14 (8.62) 10 (60.34) 70 (27.59) 37 (10.34) 22 (10.34) 14 (51.72) 60 133 Stanley Medical College (19.05) 16 (9.52) 8 (16.67) 14 (54.76) 40 (19.05) 16 (16.67) 14 (33.33) 33 (30.95) 29 92 Tanjore Medical College (32.56) 38 (25.58) 27 (13.95) 12 (27.91) 30 (18.60) 21 (41.86) 40 (20.93) 18 (18.60) 18 97 Thirunelvelli Medical
College (18.18) 8 (40.91) 18 (18.18) 8 (22.73) 10 (27.27) 12 (18.18) 8 (36.36) 16 (18.18) 8 44 Coimbatore Medical
College (28.00) 24 (12.00) 6 (24.00) 16 (36.00) 28 (12.00) 6 (40.00) 30 (36.00) 26 (12.00) 6 68 Jipmer (47.50) 54 (12.50) 18 (20.00) 20 (20.00) 20 (22.50) 26 (20.00) 26 (42.50) 44 (15.00) 16 112 Total (38.75) 320 (16.25) 135 (15.25) 126 (29.75) 248 (25.50) 214 (21.75) 188 (30.50) 254 (22.25) 183 839
Source computed
Available online at: www.ijassh.com
Madanmohan M &Vijaya Kumar K|April 2016 | Vol.4 | Issue 04 |21-25 24 The M.B.B.S. level educated respondents
constitute more number with respect to sharing freely most of the information with their peers and colleagues (30%) than those of othersIt could be seen clearly from the above discussion that MD level educated respondents mainly freely share most of the information with their superiors.
A study of data in table 3 indicates designation wise respondents’ information and communication sharing. The designation wise analysis reveals the following facts. The Professor respondents constitute more number with respect to sharing freely most of the information with their subordinates and juniors (37.65%), peers and colleagues (34.12%) and with others (24.71%) than those of others.
The Assistant Professor respondents constitute more number with respect to sharing freely most of the information with their superiors (39.53%) than those of others. It could be seen clearly from the
above discussion that Assistant Professor respondents mainly freely share most of the information with their superiors.
Findings
The findings of respondents’ information and communication sharing indicate the following facts. Share freely most of the information with superiors constitutes first order of information and communication sharing among the respondents of selected Medical College followed by sharing information with others, sharing information with subordinates and sharing information with peers and colleagues. The result of education wise analysis reveals the following facts. The MD level educated respondents mainly freely share most of the information with their superiors. The result of designation wise analysis reveals the following facts. The Assistant Professor respondents mainly freely share most of the information with their superiors [1-40].
References
1.Ranganathan SR (1969) Library Science based Library
Service, Library Science with a Slant to Documentation, 6:103-105.
2.Ranganathan SR (1970)Annotation on user’s survey,
Annals of Library Science and Documentation, 17:1-22
3.Ranganathan SR (1996) Reference service through four
centuries, Library Herald, 9:87-88.
4.Reddy YN etc. (1993) Assessment of faculty satisfaction
with periodical collection: A case study, Lucknow Librarian, 25:25-31.
5.Rinkel GK (1983) Application of methodology analyzing
user frustration, College and Research Libraries, 44:29-37.
6.Robertson Andrew (1975) Behaviour patterns of scientists
and engineers in information seeking for problem solving,” ASLIB Proceedings, 27:308-313.
7.Rolinson J (1996) Information usage by biological
researchers, Journals of Information Science, 22:47-53.
8.Roth Dana L (1974) The needs of library users, UNESCO
Bulletin for Libraries, 28:92-95.
9.Rout RK (1982) Measuring users satisfaction: A
quantitative model,” IASLIC Bulletin, 27, (1982):1- 8.
10. Saha JC (1985) Resource sharing in libraries: A fresh
look,” Lucknow Librarian, 17:1-6.
11. Sahi SS (1987) Evaluation of reference service provided
by the Jammu University Library: A user survey, In Vashishth, C.P. Ed., Quality in Libraries, Delhi, Indian Library Association, 280-288.
12. Saibaba B (1984) Research methods in library and
information science, Lucknow Librarian, 16:59-64.
13. Salasin J, Cedar T (1985) Information seeking behaviour
in an applied research service delivery setting, Journal of the American Society for Information Science, 36:488-567.
14. Saracevic T etc. (1977) Causes and dynamics of user
frustration in an academic library, College and Research Libraries, 38:7-18.
15. Sardana, Sighal RL (1982) Statistical methods for
libraries, New Delhi, Ess Ess Publication.
16. Sarkodie Mensah K (1992) Dealing with international
students in a multicultural era, Journal of Academic Librarianship, 18:214-216.
17. Sasikala C (1994) Information seeking behaviour of
managers in industry, IASLIC Bulletin, 39:27-31. ANOVA
Source of Variation SS df MS F F crit
Rows 1367.9 9 151.9889 5.714664 2.250133
Columns 98.4 3 32.8 1.233254 2.960348
Error 718.1 27 26.5963
Madanmohan M &Vijaya Kumar K|April 2016 | Vol.4 | Issue 04 |21-25 25
18. Satyanarayanan M (1993) Utility of periodicals in the
Andhra University Library: A case study. Annals of Library Science and Documentation, 40:59-63.
19. Segal JS (1987) Identifying needs of solutions, College
and Research Libraries, 48:717-719.
20. Sengupta IN (1990) Information needs of scientists: An
overview, CLIS Observer, 7:73-78.
21. Seethai RM, Information sharing behavior of faculty
members in medical colleges. Journal of information services 45(2):196-201.
22. Sethi AR (1990) Information behaviour of social
scientists: An Indian perspective, Delhi, Hindustan Publishing Co..
23. Sewa Singh (1990) Information services in university
libraries in India, International Library Movement, 12:1-11.
24. Singh, SN (1979) Assessing information needs and users:
a state of art report, Herald of Library Science, 18:38-45.
25. Singh SP (1994) Evaluation of collection and Services
provided by III Libraries: User’s point of view, Journal Library and Information Science, 19:1-18.
26. Slater M (1989) Social Scientist Information Needs in
the 1980’s, Journal of Documentation, 43: 226-237.
27. Smith RH, Grande W (1978) User and library failures in
an undergraduate library, College and Research Libraries, 39:467-473.
28. Sobha Rani J (1996) Information seeking behaviour of
member of mahila mandali at Titupati, Sri Venkateswara University, 1996, M.L.I. Sc., Dissertation.
29. Soma Raju P (1991) Resource sharing among university
libraries, In Prasher, R.G. Ed., University Libraries in India, 1980s and beyond, New Delhi, Medallion Press.
30. Sridhar MS (1995) Information seeking behaviour of
scientists and engineers: A case study of Indian Space Technologies, New Delhi, Concept Publishing Co..
31. Srinivasalu K (1997) Information seeking behaviour of
faculty in social sciences of a S.V. University, Tirupati. Sri Venkateswara University, M.S.I.Sc.. (Unpublished).
32. Stevenson MB (1976) Education in the use of
information in university and academic environments,” ASLIB Proceedings, 28:17-21.
33. Stone Sue and Harris Colin, CRUS guide, 1984. British
Library Board, Sheffield.
34. Subrahmanyam T (1978) Information seeking behaviour
of doctoral candidates in social science, Bangalore.
Indian Statistical Institute. DRTC, ADISC,
Dissertation.
35. Sudhakara Rao V (1991) Information Use: A survey of
teachers and research scholars in the Department of Economics of S.V. University, Tirupati. Sri Venkateswara University, M.L.I.Sc.. (Unpublished).
36. Suriya M, Saavathi MS (1988) Measuring the
effectiveness of a university library in Tamilnadu”. Annals of Library Science and Documentation, 35:77-83.
37. Tagiacozzo Renata (1977) Estimating the satisfaction of
information users. Bulletin of the Medical Library Association, 65:243-249.
38. Tandon JC (1984) Measuring library effectiveness,
Lucknow Librarian, 16:65-75
39. Taylor Robert S (1968) Question-negotiation and
information seeking in libraries, College and Research Libraries, 29:178-194.
40. Tejomurthy A, Parulakar A (1987) Information service