JPRHC Volume 2 Issue 4
333-338
JPRHC
Research Article
ANALYTICAL METHOD DEVELOPMENT AND VALIDATION FOR DIPYRIDAMOLE
SURESH KUMAR S1.,LATIF D.JAMADAR*1, KRISHNAMURTHY BHAT1, JAGDISH P.C.1, SHRIRAM PATHAK1,
N.UDUPA1.
For author affiliations, see end of text
This paper is available online at www.jprhc.in
ABSTRACT:
A sensitive, specific, precise and cost effective High
Performance Liquid Chromatographic method of
analysis for dipyridamole in presence of its degradation
products is developed and validated.
The method employed Targa C8 column i.e., (250 X 4.6 mm
5 μm particle size) column as stationary phase. The mobile phase consists of acetonitrile and pH3.0 buffer in the ratio of
35:65 %. It is pumped through the chromatographic system at a flow rate of 1.2 ml/min. The UV detector is operated at
282 nm. This system was found to
give good resolution between dipyridamole and its
degradation products.
Method was validated as per ICH guidelines
KEYWORDS: HPLC, Dipyridamole, UV detector, Targa C8
column
INTRODUCTION:
Dipyridamole [1] {2, 2', 2'', 2'''- (4,8- di (piperidin- 1- yl) pyrimido [5, 4-d] pyrimidine-2,6-diyl) bis (azanetriyl) tetraethano)} is platelet inhibitor. It is believed that platelet reactivity and interaction with prosthetic cardiac valve surface resulting in abnormally shortened platelet survival time, is significant factor in thromboembolic complications occurring in connection with prosthetic heart valve
replacement.There are many methods reported for
determination of dipyridamole in individual and combined
dosage form, viz. Synchronous fluorescence spectrometry [2], Square wave voltametry [3], HPLC [4].Literature survey suggest that there are analytical method by HPLC for the estimation of dipyridamole, but the reported method for dipyridamole estimation have some disadvantages such as more retention time peak tailing.In present study, a HPLC method has been developed and validated with advantage of the retention time, cost reduction, sharp peaks and low solvent consumption.
EXPERIMENTAL
Experimental Data:
The Acetonitrile and Methanol used are of HPLC grade, supplied by Ranbaxy Fine chemicals Ltd. Mohali. Dipyridamole, Batch No.1401457 is supplied by Panchsheel organics Ltd.
Instrumentation:
Waters 2487 gradient HPLC system with auto sampler and column oven (Water Alliance) was used. Separation and quantitation was done on Targa C8 column i.e., (250 X 4.6
mm 5 μm particle size) column
Chromatographic Condition:
The mobile phase was prepared by mixing potassium dihydrogen phosphate, acetonitrile in the ratio of 65:35 %. The mobile phase was filtered using 0.45 µm Nylon filter and degassed in a sonicator for 10 minutes. The flow rate was 1.2 ml.min−1.Column was maintained at 25ºC. The injection
volume to carry out the chromatography was set at 20µl. Under these conditions dipyridamole eluted at 4.3 minute. The total run time was 30 minutes
Selection of wavelength:
Dipyridamole shows good absorbance at 282 nm so it was selected as wavelength of detection.
Method Development
JPRHC Volume 2 Issue 4
333-338
using Targa C8 column i.e., (250 X 4.6 mm 5 μm particle
size) stainless steel column. The mobile phase was prepared by mixing potassium dihydrogen phosphate buffer (pH 3.0), acetonitrile in the ratio of 65:35 %.
Standard and working solution:
Standard solution of dipyridamole was prepared at the concentration of 500µg ml-1 dissolving appropriated amount of standard in the mobile phase. This standard solution was used to quantify active and final product.
For the preparation of sample solution, 20 tablets were taken and weighed individually. Average weight was calculated and finely powdered. Appropriate portion of this powder equivalent to 50 mg of dipyridamole was weighed and transferred to a 100 ml volumetric flask. This was dissolved in 70 ml methanol by sonicating for 20 min and made up to the volume. 5 ml of above solution was pipetted into 50 ml volumetric flask and volume made by methanol. Filtered through a 0.45 µm membrane filter.
METHOD OPTIMIZATION:
Effect of pH:
The effect of pH on the chromatographic behavior of the drug was studied by varying pH of potassium dihydrogen phosphate buffer to 2.8, 3.0, and 3.2. 35% acetonitrile was used in respective buffer at flow rate of 1.2ml/min.
Effect of stationary phase:
The chromatogram was recorded using following column.
Hypersil C8 (250 x 4.6 mm) 5µm
Prontosil C8 (250 x 4.6 mm) 5µm
Targa C8 (250 x 4.6 mm) 5µm
Effect of solvent rate:
Different solvent namely methanol, tetrahydrofuran and mixture of tetrahydrofuran and methanol (1:1) in 60% of potassium dihydrogen phosphate buffer (pH 3.0) were used. Flow rate was 1.2 ml/min.
Effect of mobile phase ratio:
The chromatogram was recorded by using mobile phase containing 35%, 40%, and 55% of acetonitrile in potassium dihydrogen phosphate buffer (pH 3.0)
Effect of Flow rate:
The flow rate 1.0, 1.2, 1.4 ml/min were used and chromatogram was recorded.
Method Validation:
Method validation was done as per ICH guidelines [5-6]. And accordingly the parameter evaluated were
1. Linearity
2. Precision
3. Reproducibility
4. Specificity
5. Accuracy and
6. System suitability
Linearity:
The linearity of analytical procedure is its ability (within given range) to obtain test results which are directly proportional to concentration in sample. This was studies by analyzing ten concentrations within the range of 12.5 µg/ml to 75 µg/ml solution of dipyridamole corresponding to about 25% to 150% of target concentration. A graph was plotted in µg/ml on X axis versus response on Y axis
Precision:
The precision of analytical procedure express the closeness of agreement (Degree of scatter) between series of measurement obtained from multiple sampling of the same homogeneous sample under prescribed condition. The precision of the method was demonstrated by
1. System Precision: Standard solution of
dipyridamole was injected in 10 replicate injection and %RSD was calculated.
2. Method Precision: Analyzing six replicate injection of dipyridamole standards and sample solution. Percentage assay of sample to that of label claim was calculated by comparing the sample solution response to that of standard solution response. %RSD of assay result was calculated.
3. Intermediate Precision: Intermediate precision express within laboratory variation. Two analyst on different HPLC system conducted and analyst to analyst variability study by assaying six different test preparation of dipyridamole tablets blend of same batch was calculated.
JPRHC Volume 2 Issue 4
333-338
Placebo interface:
A study to establish the interface of tablet excipients (placebo) was conducted and assay was performed on placebo in triplicate equivalent to about the weights of the placebo in portion of the test method as per the method. Chromatogram shows no peaks at the retention time of dipyridamole this indicates that excipients used in the formulation do not interfere in the estimation of dipyridamole.
Interface from the degradation product
Interface from degradation product was carried to demonstrate the effective separation of degradants from dipyridamole. Separate portion of the drug product, drug substance (50µg/ml) and placebo were exposed to following stress condition,
1. Refluxed with 1 N Hydrochloric acid solution at 60ºC for about 30 min for drug substance.
2. Refluxed with 1 N Sodium Hydroxide solution at 60ºC solution for about 30 min for drug substance 3. Treated with 1% hydrogen per oxide for about 30
min on bench top
4. Refluxed with purified water for 30 min.
Stressed sample after appropriate dilution were injected into the HPLC system with diode array detector and degradant peaks were resolved from dipyridamole peak in the chromatogram of all samples.
Accuracy:
The accuracy of the analytical procedure express the closeness of the agreement between the value which accepted either as conventional true value or accepted reference value or the value found. A study recovery of dipyridamole from spiked placebo was conducted. Samples were prepared by mixing placebo, with dipyridamole raw materials equivalent to 50%, 75%, 100%, 125%, 150% of target concentration. Sample solution were prepared in triplicate for each spike level and assayed per method.
System Suitability:
System suitability is defined as, the checking of a system, before or during analysis of unknowns, to ensure system performance. A data from five injection of system precision (50µg/ml) were utilized for calculating system suitability parameter like %RSD, Tailing factor, and theoretical plates. Targa C8 column i.e., (250 X 4.6 mm 5 μm particle size)
column was used as stationary phase. The mobile phase was consist of potassium dihydrogen phosphate buffer (pH 3.0), acetonitrile in the ratio of 65:35 % respectively .282 nm was detection wavelength. Flow rate was 1.2ml/min. Column run for 10 min at temperature of 50ºC
Robustness:
The robustness of analytical procedure is a measure of its capacity to remain unaffected by small, but deliberate variation in method parameter and provides an indication of its reliability during normal usage and done by changing,
1. Influence of variation of pH in the mobile phase (±0.2)
2. Influence of variation of flow rates (±10%).
Ruggedness (System to system variation)
Ruggedness of analytical method is degree of reproducibility of test result obtained by the analysis of the same sample under verity of condition such as laboratory, analyst and instruments. System to system variation was conducted on two HPLC systems by using the same column by assaying six different test preparation of dipyridamole blend (50µg/ml) as per method
Filter Validation:
A study to establish the suitability of filter was conducted using two different filters namely 0.45µm PVDF filter and 0.45µm Nylon filter. Test preparation were prepared in triplicate were centrifuged and filtered through different filters, were assayed against unfiltered standards (50µg/ml).The difference in % assay values between centrifuged and filtered sample were calculated.
RESULT AND DISCUSSION:
HPLC method development and optimization of
dipyridamole:
Effect of pH:
The retention time of dipyridamole was decreased as the pH of mobile phase increased. This may be due to ionized state of dipyridamole at higher pH. For the pH 2.8, pH 3.0 and pH 3.2 retention time was 3.8, 4.2 and 4.2; hence pH 3.0 buffer was selected since it gave the retention time of around 4.2 min.
Effect of the stationary Phase:
On Targa C8 (25 cm x 4.6 mm) 5µm , dipyridamole eluted
with desirable retention and symmetrical peak. For the study Targa C8 (25 cm x 4.6 mm) 5µm was selected because of its
lower asymmetric factor (i.e 1.3) when compared to other column. Also with Hypersil C8 columns tailing factor was
more and peak shape was irregular and hence we have selected Targa C8 column.
JPRHC Volume 2 Issue 4
333-338
Different solvent like methanol acetonitrile, in potassium dihydrogen phosphate buffer (pH 3.0) were used at flow rate of 1.2 ml/min. When methanol was used, peak broadening was observed along with the high back pressure. With the methanol and water peak tailing was observed. For the present study, 35% acetonitrile in potassium dihydrogen phosphate buffer (pH 3.0) was selected because it gave good separation.
Effect of Ratio of mobile phase:
The proportion of acetonitrile and potassium dihydrogen phosphate buffer (pH 3.0) of 70:30, 45:55, 35:65 %v/v were used as mobile phase. At 35:65 %v/v ratio of acetonitrile and potassium dihydrogen phosphate buffer (pH 3.0), a symmetrical peak eluted at around 4.0 min with good capacity factor and it was selected as for further studies.
Effect of Flow rate:
The entire selected flow rate (i.e. 1.0 ml/min, 1.2 ml/min, and 1.4 ml/min) gave symmetrical peak with acceptable capacity factor. For the present study 1.2 ml/min was selected on the basis of less retention time (5.1), good peak shape, Acceptable back pressure and better separation of impurities from drug.
HPLC assay method validation dipyridamole:
Specificity:
Assay was performed on placebo in triplicate equivalent to about the weights of placebo in portion of test preparation as per test methods. Chromatograms of placebo solution showed no peaks at the retention time of dipyridamole and its degradation product. This indicates the excipients used in formulation do not interfere in the estimation of dipyridamole.
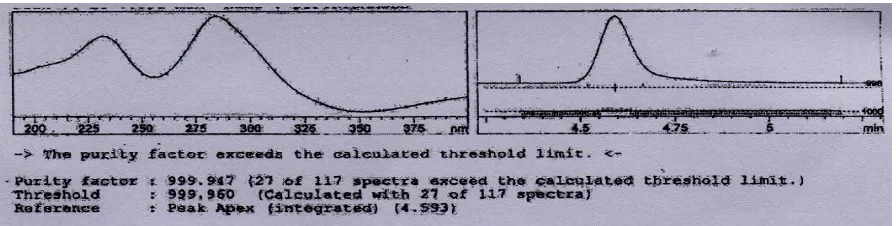
2. Interference with the degradation products
The Dipyridamole peak was well resolved from the degraded impurities. The peak purity test of dipyridamole at the stress condition had revealed that the method was stability indicating and specific. The result was summarized in the figure 2.
Solution stability:
A solution of dipyridamole (50µg/ml) was prepared and stored at room temperature for 24 hrs. The sample solution withdrawn at intervals of 0, 2, 4, 6, 8, 12 and 24 hrs and analyzed. No additional peak was observed in the solution that was kept for 24 Hrs.
Precision:
System Precision:
The % RSD of repeated injection was found to 0.4 % it was found to be within the acceptable value of 1.0% hence proposed method was precise. Results are given in table 1.
Method Precision:
The precision of test method was evaluated by assaying six
sample of dipyridamole tablet blend
(50µg/ml).The mean % assay was found to be 100.2% and %RSD of assay was found to be 1.3%. Results are given in the table 1.
Intermediate Precision
Two analyst on different HPLC system conducted analyst to analyst variability study by assaying six different test preparation of dipyridamole tablet blend. The average %assay obtained by both analysts was found to be 98.7 and 98.7 with RSD of 1.4% and 1.3% respectively .The system suitability parameter were evaluated as per method by both analyst and found to be within limits. The limits are summarized in the table 1.
Linearity:
The data obtained in linearity experiments was subject to linear regression analysis. The coefficient of regression (r2) was found to be 0.9998.Linearity data and plot are reported in the table 1.
Accuracy
The results from recovery study for accuracy determination are depicted in the Table 1. Recovery of dipyridamole from spiked placebo was conducted. Sample solution was analyzed in triplicate for each concentration level and assayed as per method. The percentage recovery was found to be within the limits (97.5-100.4%). The mean recovery of dipyridamole tablet should not be less than 97% and not more than 103%.
Robustness:
No significant change in the chromatographic parameters were observed when change in the optimized condition like change in the pH and flow rates. The results are summarized in the table 1.
Ruggedness:
System to System variability:
JPRHC Volume 2 Issue 4
333-338
RSD of 1.4% and 1.3% respectively. Comparison of the result obtained on two system shows that the assay method is rugged for system to system variability. System suitability parameters, assay results are summarized in the table 1.
Filter Validation:
A study to establish the suitability of filter was conducted using two different filters namely 0.45µm PVDF filter and 0.45 µm nylon 66 filters. Test preparation in triplicate were centrifuged and filtered through either filters, were assayed against unfiltered standards. The difference in the %assay
values between centrifuged and filtered samples within to be within limits. This study indicates that both filters are suitable for filtration.
System Suitability:
All the values of parameter i.e. USP plate count (4002), USP tailing (1.3) and %RSD of six replicate injections (0.1%) of system suitability were found to be within in the acceptable limits. It concluded that the method and systems are adequate
for the analysis to be performed.
Table1: validation Parameter:
Parameter Obtained Results
r2 0.9998
Accuracy (% RSD) Recovery levels
50% 97.7 ± 0.21 %
75% 98.3 ±1.51 %
100% 99.6 ± 0.70 %
125% 98.2 ± 0.82 %
150% 100.3 ± 0.07%
Assay 101.1 % w/w
Precision (% RSD) System Precision 0.42 %
Intermediate Precision
Analyst 1 1.6 %
Analyst 2 1.5 %
Method Precision 1.3 %
Robustness (% RSD) Effect of variation in pH
pH 2.8 0.16 %
pH 3.0 0.10 %
pH 3.2 0.20 %
Effect of
variation in flow rate
1.0 ml/min 0.07 %
1.2 ml/min 0.09 %
1.4 ml/min 0.07 %
Ruggedness System to system variability
System 1 1.4 %
JPRHC Volume 2 Issue 4
333-338
Fig 1: representative chromatogram of the dipyridamole under optimized condition
Fig 2: Interference of degradation Product
CONCLUSION:
The ultimate Goal of the validation process is to challenge the method and determine limits of allowed variability for the condition needed to run the method.The proposed analytical
method has been proved to be simple, specific and accurate which fulfill all the parameters of the validation (table 4). Therefore this method has been successfully applied to raw
materials and dosage form like tablets.
REFERENCES:
[1] Bayer DIPYRID. Dipyridamole, Rx list
monographs. Available from; URL: http : //
www . rxlist. com / cgi /
generic2/dipyrid.htm. Accessed on 2006 Mar 20.
[2] Jose A.Murillo pulgarin, Aurelia Alanon
Moline and P bablo Fernandez Lopez, Simultaneous determination of atenolol, propanlol, amiloride and dipyramole by
non-linear variable-angle synchronous
fluorescence spectrometry. Analytical
Chimica Acta 1998,Aug31;370(1)9-18
[3] Renata Alves de Tolodo,Marilza Castilho
and Luli Henrique Mazo, Determination of dipyidamole in pharmaceutical preparation
using square wave voltametry. J
Pharma.Bio.Anal 2005 Jan 4;36(5):1113-7.
[4] Barberi M,M erlin JL,Weber B. Sensitive
determination of free and plasma protein bound dipyridamole by high performance liquid chromatography. J Chromatogr.1991 Apr 19;565(1-2):511-5.
[5] ICH Harmonized Tripartite Guidelines.
Validation of analytical methodology
Q2B.1996 Nov6.
[6] ICH Harmonized Tripartite Guidance. Text
on validation of analytical procedure Q2A.1994 Oct.
[7] Indian Pharmacopoeia. New Delhi:
Ministry of health and Family welfare; 1996.vol II appendix 5-A 76.
[8] Practical HPLC methods developments
ACS short course attendees onl. Available
from: URL:
http:www.bioanalytical.com/NWL/pdfs/acs. pdf. Accessed on 2006 Jan.
[9] Notes for guidance on guidance on
validation of analytical procedures:
Methodoly (CPMP/ICH/281/95).
AUTHORS AFFILIATION AND ADDRESS FOR CORRESPONDENSE:
Manipal College of Pharmaceutical sciences, Manipal University,