ISSN: 2501 - 1235 ISSN-L: 2501 - 1235 Available on-line at: www.oapub.org/edu
doi: 10.5281/zenodo.3246913 Volume 5 │ Issue 10 │ 2019
STUDY OF BODY COMPOSITION
AMONG MALE AND FEMALE SOFTBALL PLAYERS
Mandeep Singh1i, Sahil Preet Bedi2
1PhD, Assistant Professor & Head,
Department of Physical Education, Doaba College, Jalandhar, Punjab, India Research Scholar,
2Department of Physical Education (T),
Guru Nanak Dev University, Amritsar, Punjab, India
Abstract:
The purpose of this study was to examine body composition components among softball players and to compare body composition components among male and female
softball players. Total 150 male and 150 female softball players from the various states
and universities of India were selected to participate in the study. Height of the players was measured with the anthropometric rod. Portable weighing machine was used to measure the weight of the players. Harpenden skinfold caliper was used to assess the skinfold thicknesses. The results revealed that the female softball players had significantly higher percent body fat (p < 0.05) total body fat (p < 0.05) as compared to male softball players whereas the male softball players had significantly greater lean body mass (p < 0.05) than the female softball players. In conclusion, female softball players possess higher amount of body fat as compared to their male counterparts.
Keywords: body composition, performance, percent body fat, lean body mass, softball
1. Introduction
Softball is a baseball descendant game that requires speed, strength, and endurance. To develop in these areas, many factors play a significant role like skill, practice, level of physical activity, techniques, psychological traits, nutrition and other environmental factors. However, a particular body size and shape and certain genetically conditioned abilities and features are required in order to achieve top level performance in softball.
│ │
Players require the basic physical structural composition of the players which suits best to the demands of the sport and a particular playing position for higher performance.
Body composition refers to the distribution of muscle mass and fat mass in the body. Assessment of anthropometric parameters and body composition, therefore, has an important role in sports and health. Excess body fat besides leading to obesity and disease causation, may also hinder performance (Vipene and Victor, 2013). The association of body composition with physical performance changes is also of great interest to strength and conditioning specialists (Silvestre et al., 2006). Body composition, a component of health related fitness is the relative amount of fat and tissues that is devoid of fat or fat free mass (muscle, bone and water). Human body comprises body fat mass and fat free mass (Siahkouhian et al., 2006; Baumgartner et al., 2003; Wang et al., 2001). These two parameters are primarily used in the study of the relationship between body composition and physical performance (Houtkooper and Going, 1994; Wang et al., 1995; Kim et al., 2005). Body composition is an important aspect of fitness (Reilly et al., 1990) and can be predicted from anthropometric measures (Maud and Foster, 1995). Body composition of athletes is an essential tool to evaluate the health of the athletes, observe the effects of a training program, and to find out most favorable competitive body weight and body composition (Prior et al., 2001). It is generally accepted that a lower relative body fat is required to succeed in competition in most of the sports. This is due to the fact that excess body fat acts as a dead weight in activities where the body mass must be repeatedly raised against gravity during locomotion (Reilly, 1996). It hinders the performance and increases the energy requirements of the activity. On the other hand, lean body mass contributes to power generation during high-intensity activity and provides a greater absolute size and strength for resistance with high dynamic and static loads. Studies of body composition in certain sports such as football, weight lifting and shot put indicated that athletes who were lean but heavy because of a well-developed musculature were superior in performance in competitive sports activities (Bullen, 1971).
Body composition components are an essential part of the evaluation and selection of players for different sports, standard data on such factors are still scant in the Indian context on softball players. The present study, therefore, aimed at evaluating the body composition among softball players from India.
2. Methodology
The subjects of the present study were purposively selected from the university level and national level male softball players. 150 male softball players (mean age: 21.35±2.57 years) of different universities and states of India were selected to participate in the
study. The data for the study was collected during the 33rd Senior National Softball
2.1 Anthropometry
The mean age of male and female softball players was 21.35±2.57 years and 20.50±2.10 years respectively. The height of male and female softball players was observed to be 173.49±6.12 cm and 159.41±5.65 cm respectively. The weight of male and female softball players was observed to be 65.62±8.35 kg and 52.24±6.93 kg respectively. The height of the players was measured with anthropometric rod to the nearest 0.5 cm (HG- 72, Nexgen ergonomics, Canada). Portable weighing machine was used to measure the weight of the softball players to the nearest 0.5 kg. Harpenden skinfold caliper was used to assess the skinfold thicknesses of the players.
2.2 Body Composition
Percentage body fat as estimated from the sum of skinfolds was calculated using equations of Siri (1956) and Durnin and Womersley (1974). The regression equations for the prediction of body density from the log of the sum of skinfold thickness at four sites in mm are as follows
For Males For Females
17 to 19 years age group
Body Density (gm/cc) = 1.1620-0.0630 (X)
17 to 19 years age group
Body Density (gm/cc) = 1.1549-0.0678 (X) 20 to 29 years age group:
Body Density (gm/cc) = 1.1631-0.0632 (X)
20 to 29 years age group:
Body Density (gm/cc) = 1.1599-0.0717 (X) Where:
X = log (biceps + triceps + subscapular + suprailliac).
Percent Body Fat = [4.95 / body density - 4.5] 100 (Siri, 1956) Total Body Fat (kg) = (%body fat / 100) body mass (kg)
Lean Body Mass (kg) = body mass (kg) – total body fat (kg)
2.3 Statistical Analyses
Statistical analyses were performed using SPSS version 16.0 for windows (SPSS Inc, Chicago, IL, USA). The data was presented as descriptive statistics such as mean, standard deviation, standard error of mean, minimum value and maximum value. Independent samples t-test was used to compare the male and female softball players on body composition components. Significance levels were set at p<0.05.
3. Results
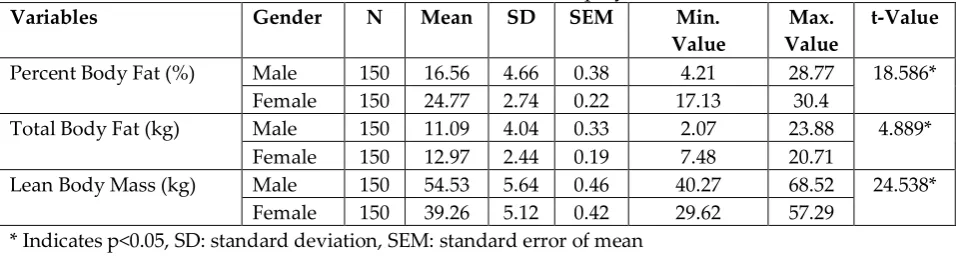
Table 1: Descriptive statistics of components of the body composition of
the male and female softball players
Variables Gender N Mean SD SEM Min.
Value
Max. Value
t-Value
Percent Body Fat (%) Male 150 16.56 4.66 0.38 4.21 28.77 18.586* Female 150 24.77 2.74 0.22 17.13 30.4
Total Body Fat (kg) Male 150 11.09 4.04 0.33 2.07 23.88 4.889* Female 150 12.97 2.44 0.19 7.48 20.71
│ │
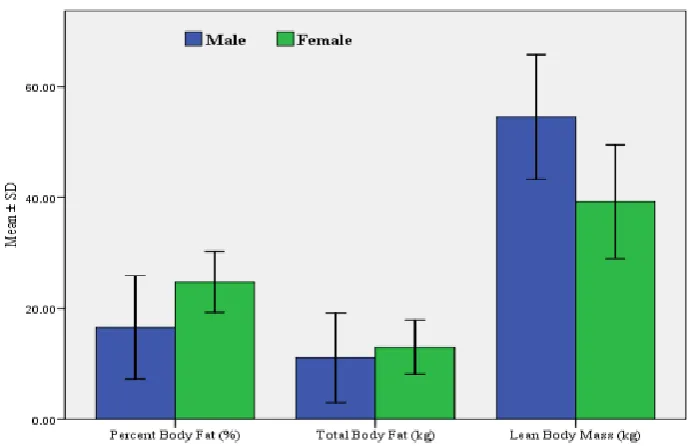
The descriptive statistics of different components of the body composition of the softball players are presented in Table 1 and Figure 1. The average percent body fat of the male softball players was 16.55 % with a standard deviation of 4.66. The female softball players had 24.77 % average percent body fat with standard deviation 2.74. The average total body fat of the male softball players was observed to be 11.09 kg with a standard deviation of 4.03. Whereas, the female softball players had 12.97 kg average total body fat with standard deviation 2.44. The mean lean body mass of the male softball players was observed to be 54.52 kg with a standard deviation of 5.63. However, the female softball players had 39.26 kg average lean body mass with standard deviation 5.12. The independent samples t-test revealed that the female softball players were found to have significantly greater percent body fat (t = 18.586, p = 0.000) total body fat (t = 4.899, p = 0.000) as compared to male softball players. On the other hand, male softball players had significantly greater lean body mass (t = 24.538, p = 0.000) than the female softball players.
Figure 1: Different components of the body composition
of the male and female softball players
4. Discussion
higher than the under-15 Indian softball players studied by Rao and Kumar (2015), minor and major baseball league players reported by Hoffman et al. (2009), high school and professional baseball players from USA (Szymanski et al., 2010; Mangine et al., 2013), NCAA Division II baseball players (Myers, 2012), Japanese high school baseball players (Tajika et al., 2015) and elite Korean baseball players (Ko and Kim, 2005). On the other hand, the male softball players in the present study had lesser fat percentage than the Cuban baseball players (Carvajal et al., 2009) and collegiate softball players from Thailand (Sintara and Sonchan, 2015).
The female softball players in the present study were found to have much higher fat percentage which is comparable to the Indian elite softball players reported by Singh et al. (2013). However, the female softball players had higher fat percentage than their international counterparts such as Czech Republic’s national softball team players (Mala et al., 2015) and NCAA Division II and III softball players studied by Dickson et al. (2009). The female softball players in the present study were observed to have lower fat percentage than the Indian non-elite female softball players (Singh et al., 2013), NCAA Division I and II softball players (Thompson and Barkley, 2013; Szymanski et al., 2012), collegiate softball players from Thailand (Sintara and Sonchan, 2015) and South Australian softball players (Withers and Roberts, 1981). In case of lean body mass, the male and female softball players were observed to have mean values 54.53±5.64 kg and 39.26±5.12 kg respectively. The male softball players had lesser lean body mass in comparison to the minor and major baseball league players (Hoffman et al., 2009), Cuban baseball players (Carvajal et al., 2009), high school and professional baseball players from USA (Szymanski et al., 2010; Mangine et al., 2013), NCAA Division II baseball players (Myers, 2012) and Japanese high school baseball players (Tajika et al., 2015). The lean body mass of the female softball players in the present study was comparable to that of Indian elite and non-elite female softball players reported by Singh et al. (2013). However, the female softball players had lower lean body mass than the Czech Republic’s national softball team players (Mala et al., 2015) and NCAA Division I, II and III softball players (Dickson et al., 2009; Thompson and Barkley, 2013; Szymanski et al., 2012). It is revealed from the above discussion that the findings regarding body composition of female softball players were consistent with those previously reported on Indian female softball players. However the female softball players had lower body fat percentage than the female softball players of some other countries but they also had lower muscle mass which has major role in energy production and force generation during play.
5. Conclusion
│ │
Bibliography
Baumgartner T. A., Jackson A. S., Mahar M. T., Rowe D. A., 2003. Measurement for evaluation in physical education and exercise science, 7th Ed. Boston: WCB McGraw-Hill. pp 32-45.
Bullen B. A., 1971. Overweight: In Encyclopaedia of sports Sciences and Medicine. The Macmillan Company New York.
Carvajal W., Rios A., Echevarria I., Martinez M., Minoso J., Rodriguez D., 2009. Body type and performance of elite Cuban baseball players. MEDICC Review, 11(2):15-20.
Dickson N. L., Ruot C., Madeson M., Lindsay Edwards L., 2009. A descriptive and comparative study of physical and performance characteristics of NCAA Division II and Division III softball players. International Journal of Exercise Science, 2(1):S30-31.
Durnin J. V. G. A., Womersley J. 1974. Body fat assessed from total body density and its estimation from skinfold thickness measurements of 481 men and women aged from 16-72 years. British Journal of Nutrition, 32:77-97.
Hoffman J. R., Vazquez J., Pichardo N., Tenenbaum G., 2009. Anthropometric and performance comparisons in professional baseball players. Journal of Strength and Conditioning Research, 23(8):2173-2178.
Houtkooper L. B., Going S. B., 1994. Body composition: How should it be measured? Does it affect sport performance? Sports Science Exchange 7:supplement 52. Kim J. H., Gallagher D., Song M. Y., 2005. Comparison of body composition methods
during weight loss in obese women using herbal formula. American Journal of Chinese Medicine, 33(6):851-8.
Ko B. G., Kim J. H., 2005. Physical fitness profiles of elite ball game athletes. International Journal of Applied Sports Sciences, 17(1):71-87.
Mala L., Maly T., Zahalka F., Bunc V., Kaplan A., Jebavy R., Tuma M., 2015. Body composition of elite female players in five different sports. Journal of Human Kinetics, 45:207–215.
Mangine G. T., Hoffman J. R., Fragala M. S., Vazquez J., Krause M. C., Gillett J., Pichardo N., 2013. Effect of age on anthropometric and physical performance measures in professional baseball players. Journal of Strength and Conditioning Research, 27(2):375–381.
Maud P. J., Foster C., 1995. Physiological assessment of human fitness. Champaign, Illinois. Human Kinetics.
Myers D., 2012. Relationship of anthropometric measurements and body composition to upper-body power in baseball players. Missouri Journal of Health, Physical Education, Recreation, and Dance, 22:5-11.
Rao S. K., Kumar P. P. S., 2015. The relationship between selected physiological parameters variables with playing ability of softball players. International Journal of Engineering Research and Sports Science, 2(4):1-4.
Reilly T., 1996. Science and soccer. London: E. & FN Spon.
Reilly T., Sechei N., Snell P., Williams C., 1990. Physiology of sports. London: E & FN Spon.
Siahkouhian M., Rahmaninia F., Barahmand U., 2006. Effects of body composition measures on dimension of Vo2max. International Journal of Fitness, 2:1-6.
Silvestre R., Kraemer W. J., West C., Judelson D. A., Spiering B. A., Vingren J. L., Hatfield D. L., Anderson J. M., Maresh C. M., 2006. Body composition and physical performance during a National Collegiate Athletic Association Division I men's soccer season. Journal of Strength and Conditioning Research, 20(4):962-970.
Singh S., Singh M., Rathi B., 2013. Kinanthropometric and performance characteristics of elite and non-elite female softball players. Journal of Sports Medicine and Physical Fitness, 53(6):628-634.
Sintara K., Sonchan N., 2015. Physical fitness of collegiate softball players, Burapha University, Thailand. Proceedings of the Burapha University International Conference, 10-12 July 2015, Bangsaen, Chonburi, Thailand.
Siri W. E., 1956. The gross composition of the body. Advances in Biological and Medical Physics, 4:256–280.
Szymanski D. J., Szymanski J. M., Schade R. L., Bradford T. J., McIntyre J. S., DeRenne C., Madsen N. H., 2010. The relation between anthropometric and physiological variables and bat velocity of high-school baseball players before and after 12 Weeks of training. Journal of strength and conditioning research, 24(11):2933-2943.
Szymanski D. J., Bassett K. E., Beiser E. J., Till M. E., Medlin G. L., Beam J. R., Derenne
C.,2012. Effect of various warm-up devices on bat velocity of intercollegiate
softball players. Journal of Strength and Conditioning Research, 26(1):199-205. Tajika T., Kobayashi T., Yamamoto A., Shitara H., Ichinose T., Shimoyama D., Okura C.,
Kanazawa S., Nagai A., Takagishi K., 2015. Relationship between grip, pinch strengths and anthropometric variables, types of pitch throwing among Japanese high school baseball pitchers. Asian Journal of Sports Medicine, 6(1): e25330. Thompson K. J., Barkley S. A., 2013. Evaluation of strength and conditioning changes
during a Division II collegiate softball session. Journal of Fitness Research, 2:55-63.
Vipene J. B., Victor O. A., 2013. Anthropometric study of body composition variables in selected male and female athletes in rivers state, Nigeria. Asian Journal of Social Sciences and Humanities, 2(4):281-287.
│ │
Wang Z., Heshka S., Pierson R. N., Heymsfield S. B., 1995. Systematic organization of body composition methodology: An overview with emphasis on component-based. American Journal of Clinical Nutrition, 61:457-65.
Creative Commons licensing terms