297
STUDIES ON THE IMPLEMENTATION OF THE CLASIFICATION SYSTEM
’’SEUROP’’TO AWARD QUAITY CLASSES OF CARCASSES OF PIG
Marius Vladu1, Cristina-Emanuela Vladu2 1University of Craiova, Faculty of Agronomy , 2
Ministry of Agriculture and Rural Development, General Directorate Fraud Control and Inspection Directorate Monitoring Inspection, Verification and Control, Verification and Inspection Department County Control, Dolj Corresponding author: [email protected]
Keywords: Carcasses, Pig, Classification, Payment, Price, Quality, Consumption
ABSTRACT
Eating foods of animal origin is different, but in most countries, including Romania, the total consumption of animal protein, about 50% is to come from products made from pork, which is an economic boon for the activity of pig .
Pig owned, places Romania among the top 10 countries in the European Union after Germany, Spain, Italy, France, Holland, Hungary, Ireland.
The main objectives of carcasses classification are correct payment to producers of meat, standardization required in trade of meat, ensure fair competition between slaughter units, transparency meat market, ensure appropriate monitoring of the situation meat market, helping producers to improve carcass quality and and support for slaughterhouses and meat processors for sorting raw materials.
INTRODUCTION
Pig breeding is a traditional activity of great importance for human consumption, with direct implications on food security and welfare.
Global pig population growth is faster than human population growth, reflecting increased demand for pork consumption and human demographic growth; this is evident at the national level.
Pig carcass is slaughtered pigs body eviscerated, whole or cut lengthwise (half shell), drained of blood, without tongue, bristles, hooves, genitalia, flare fat, kidneys and diaphragm. Housing weigh no more than 45 minutes after the stabbing (hot carcass).
Establishing quality class carcass is the operation of quality assessment, according to the report of the 3 major components of its meat, fat and bones.
Carcass classification is different, depending on the species. For pigs is the percentage estimate meat content in carcass, which is the only accepted method to trade in meat for consumption or for preserving or industrial processing, such estimate being closer to the truth.
The main objectives of carcass classification are correct payment to producers of meat, standardization required in trade of meat, ensure fair competition between slaughter plants, transparency meat market, ensure appropriate monitoring of the situation meat market, helping producers to improve carcass quality and and support for slaughterhouses and meat processors for sorting raw materials
298
MATERIALS AND METHODS
The work was performed in a licensed abattoir in Dolj County.
The present work was carried out during the period included the December 2015 - February 2016. The plots on which conducted the research were 80 pigs each consisting of the first batch and the second batch of 60 pigs. Both the first and the second batch was made up exclusively of animals from farms in the industrial system, these animals being fed and maintained respecting the standards in terms of technology fattening pigs for meat.
Animals in both groups were subjected to the same processing operations, complying with general technology slaughter. The carcasses obtained from the slaughter of animals in the two groups were weighed and graded individually.
Classification of carcasses, the company classifier used method OPTIGRADE PRO (OGP), according to Order no. 839 of May 22, 2014 of MARD. This is a semi-automatic classification method based on measurements made with the device values OPTIGRADE-PRO (OGP)
The classification system SEUROP establishes a set of unique rules across the EU as main goals: fair payment to producers of meat, standardization required in international trade in meat, to ensure fair competition targets slaughter plants, transparency meat market, ensuring proper monitoring of the situation meat market, helping producers to improve carcass quality and support slaughterhouses and meat processors for sorting raw materials.
Table1 Grading system for pig carcases SEUROP applied in Romania
No.Ctr The percentage of carcass weight muscle
tissue
Class
1 60% or more S
2 55% or more, but less than 60% E
3 50% or more, but less than 55% U
4 45% or more, but less than 50% R
5 40 or more, but less than 45% O
6 Less than 40% P
Method uses optical light beams being different based on their coverage by fat and muscle respectively (lean meat). The values are processed in the computer unit and directly expressed in percentage of meat in the carcase. It is one of the methods currently used throughout Europe to specialized units.
Carcass classification was done on the body warm, 15-30 minutes from slaughter. The percentage of the housing muscle tissue was calculated using next formula: Y = 61,21920-0,77665 x X1+ 0,15239 x X2
Y = the estimated percentage of lean meat (muscle tissue) in the housing;
X1 = thickness of fat (including rind) in millimeters, measured at a distance of 7 cm from the midline between the third and fourth last rib;
X2 = Longissimus dorsi muscle thickness in millimeters, measured at 7 cm from the midline, between the third and fourth last rib.
The formula was applied to all carcases, which is valid for carcasses weighing between 50 and 120 kg.
299
RESEARCH RESULTS
Following the killing of two batches of pigs to slaughter under continuous technology applied in the slaughterhouse were obtained two batches first batch 80 carcasses and second batch of 60 carcasses.
In batch I, carcasses are classified as follows: 39 in class S (60% or more, percentage of muscle tissue in the housing), representing 48.75% of the total classified carcasses, class E (55% or more, but less than 60%) with a total of 35 carcasses (43,75%) and class U (50% or more, but less than 55%) with 6 carcasses, representing 7.5%.
In the second batch, the 60 carcasses are classified in: 41 carcasses in class S(60% or more, percentage of muscle tissue in the housing), representing 68.33% of the total classified, 15 in class E(55% or more, but less than 60%) representing 25%, in class U(50% or more, but less than 55%), were classified 4 carcasses representing 6.6% of total classified carcasses in the second batch.
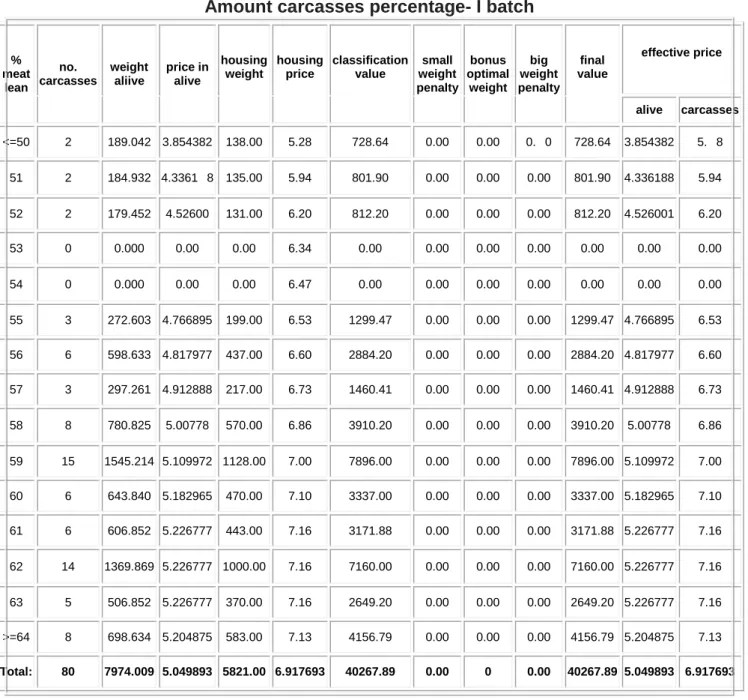
Table 2 Amount carcasses percentage- I batch
% meat
lean no. carcasses
weight aliive
price in alive
housing weight
housing price
classification value
small weight penalty
bonus optimal
weight big weight penalty
final value
effective price
alive carcasses
<=50 2 189.042 3.854382 138.00 5.28 728.64 0.00 0.00 0. 0 728.64 3.854382 5. 8
51 2 184.932 4.3361 8 135.00 5.94 801.90 0.00 0.00 0.00 801.90 4.336188 5.94
52 2 179.452 4.52600 131.00 6.20 812.20 0.00 0.00 0.00 812.20 4.526001 6.20
53 0 0.000 0.00 0.00 6.34 0.00 0.00 0.00 0.00 0.00 0.00 0.00
54 0 0.000 0.00 0.00 6.47 0.00 0.00 0.00 0.00 0.00 0.00 0.00
55 3 272.603 4.766895 199.00 6.53 1299.47 0.00 0.00 0.00 1299.47 4.766895 6.53
56 6 598.633 4.817977 437.00 6.60 2884.20 0.00 0.00 0.00 2884.20 4.817977 6.60
57 3 297.261 4.912888 217.00 6.73 1460.41 0.00 0.00 0.00 1460.41 4.912888 6.73
58 8 780.825 5.00778 570.00 6.86 3910.20 0.00 0.00 0.00 3910.20 5.00778 6.86
59 15 1545.214 5.109972 1128.00 7.00 7896.00 0.00 0.00 0.00 7896.00 5.109972 7.00
60 6 643.840 5.182965 470.00 7.10 3337.00 0.00 0.00 0.00 3337.00 5.182965 7.10
61 6 606.852 5.226777 443.00 7.16 3171.88 0.00 0.00 0.00 3171.88 5.226777 7.16
62 14 1369.869 5.226777 1000.00 7.16 7160.00 0.00 0.00 0.00 7160.00 5.226777 7.16
63 5 506.852 5.226777 370.00 7.16 2649.20 0.00 0.00 0.00 2649.20 5.226777 7.16
>=64 8 698.634 5.204875 583.00 7.13 4156.79 0.00 0.00 0.00 4156.79 5.204875 7.13
300
From Table 2 shows that the percentage represents aggregation carcasses, we find the following: The average live weight of 80 slaughtered animals in group I was 88.68 kg, totally weighing 7974 kg batch, the average carcasses weight was 72, 76 kg, the entire group of carcasses weighing 5821 kg and average carcass yield is 73% resulting from the calculation.
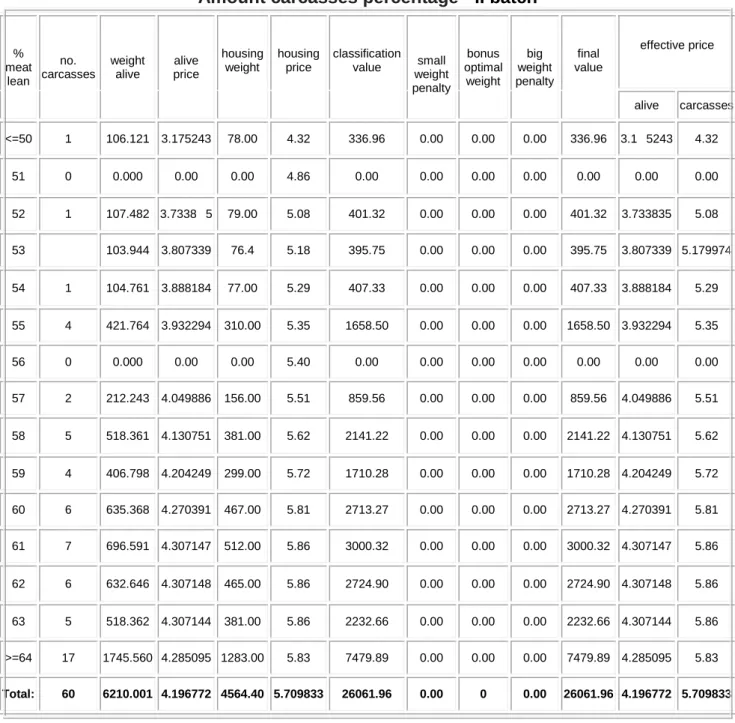
Table 3 Amount carcasses percentage - II batch
% meat
lean no. carcasses
weight alive
alive price
housing weight
housing price
classification value small
weight penalty
bonus optimal
weight big weight penalty
final value
effective price
alive carcasses <=50 1 106.121 3.175243 78.00 4.32 336.96 0.00 0.00 0.00 336.96 3.1 5243 4.32
51 0 0.000 0.00 0.00 4.86 0.00 0.00 0.00 0.00 0.00 0.00 0.00
52 1 107.482 3.7338 5 79.00 5.08 401.32 0.00 0.00 0.00 401.32 3.733835 5.08
53 103.944 3.807339 76.4 5.18 395.75 0.00 0.00 0.00 395.75 3.807339 5.179974
54 1 104.761 3.888184 77.00 5.29 407.33 0.00 0.00 0.00 407.33 3.888184 5.29
55 4 421.764 3.932294 310.00 5.35 1658.50 0.00 0.00 0.00 1658.50 3.932294 5.35
56 0 0.000 0.00 0.00 5.40 0.00 0.00 0.00 0.00 0.00 0.00 0.00
57 2 212.243 4.049886 156.00 5.51 859.56 0.00 0.00 0.00 859.56 4.049886 5.51
58 5 518.361 4.130751 381.00 5.62 2141.22 0.00 0.00 0.00 2141.22 4.130751 5.62
59 4 406.798 4.204249 299.00 5.72 1710.28 0.00 0.00 0.00 1710.28 4.204249 5.72
60 6 635.368 4.270391 467.00 5.81 2713.27 0.00 0.00 0.00 2713.27 4.270391 5.81
61 7 696.591 4.307147 512.00 5.86 3000.32 0.00 0.00 0.00 3000.32 4.307147 5.86
62 6 632.646 4.307148 465.00 5.86 2724.90 0.00 0.00 0.00 2724.90 4.307148 5.86
63 5 518.362 4.307144 381.00 5.86 2232.66 0.00 0.00 0.00 2232.66 4.307144 5.86
>=64 17 1745.560 4.285095 1283.00 5.83 7479.89 0.00 0.00 0.00 7479.89 4.285095 5.83
Total: 60 6210.001 4.196772 4564.40 5.709833 26061.96 0.00 0 0.00 26061.96 4.196772 5.709833
301
Table 4 Distribution of quality classes of the two lots
No.Crt
Class Quality
LOT 1 LOT 2
No. carcasses
% No.
carcasses
%
1 S 39 48.75 41 68.33
2 E 35 43.75 15 25
3 U 6 7.5 4 6.6
4 R 0 0 0 0
5 O 0 0 0 0
6 P 0 0 0 0
TOTAL 80 100 60 100
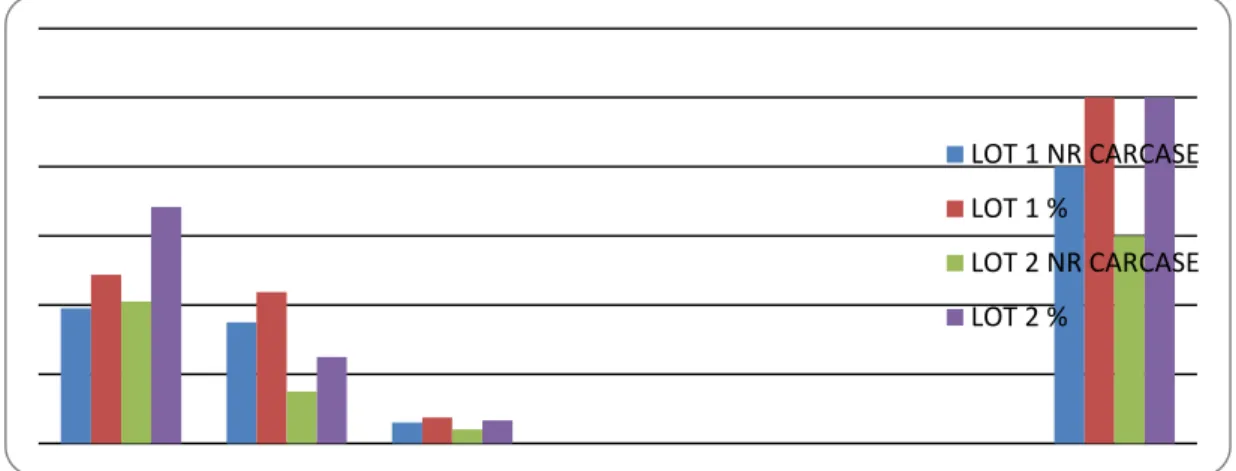
Analyzing Table 4 it can be seen that the S grade (percentage of muscle tissue in the carcass 60% or more), group II is superior recording 41 carcasses with a share of 68.33% to a total of 39 carcasses a share of 48.75%.
The situation is reversed in quality class E (percentage of muscle tissue in the carcass 55% or more, but less than 60%), where the group I recorded a total of 35 carcasses with a share of 43.75% girl a total of 15 carcasses and a 25% share.
Within the quality class U (percentage of muscle tissue in the carcass 50% or more, but less than 55%) in group I have a number of 6 carcasses with a share of 7.5% in group II and a number of 4 carcasses with a share of 6.6%.
Regarding grade R (percentage of muscle tissue in the carcass 45% or more, but less than 50%), grade A (percentage of muscle tissue in the carcass 40% or more but less than 45% ) and P grade (below 40%), missing both in group I and group II.
Figure 1 - Distribution of the two batches graded
LOT 1 NR CARCASE
LOT 1 %
LOT 2 NR CARCASE
302
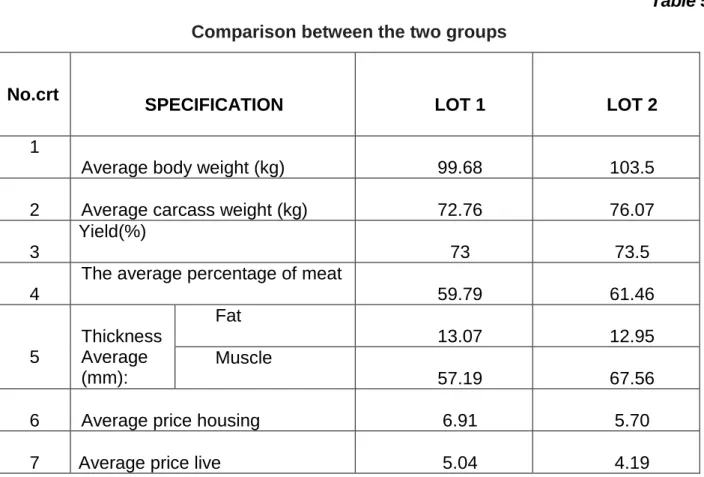
Table 5 Comparison between the two groups
No.crt
SPECIFICATION LOT 1 LOT 2
1
Average body weight (kg) 99.68 103.5
2 Average carcass weight (kg) 72.76 76.07
3
Yield(%)
73 73.5
4
The average percentage of meat
59.79 61.46
5
Thickness Average (mm):
Fat
13.07 12.95
Muscle
57.19 67.56
6 Average price housing 6.91 5.70
7 Average price live 5.04 4.19
We find that the average carcass price is higher in group I (6.91 lei / kg) compared to group II (5.70 euro / kg).
The report is also maintained in live pig price 5.04 of group I versus 4.19 sample II Although the group I was slaughtered in December 2015 and group II was slaughtered in February 2016 and as usual trend is for prices to rise, the difference upper price in group I can be explained by the fact that traditional interest to pork is raised in December along with preparing for the traditional winter holidays, pork and processed pork underpinning the culinary holidays, compared to February.
CONCLUSIONS
SEUROP is a classification system that seeks to achieve objectives such as: fair payment for producers of meat, standardization required in international trade in meat, to ensure fair competition targets slaughter plants, transparency meat market, ensure appropriate monitoring of the market situation meat, helping producers to improve carcass quality and support slaughterhouses for sorting raw materials.
In this system, the weight of the animals and carcasses are no longer key financial indicators since the pricing of carcasses emphasis is on quality.
System-intensive industrial growth are obtained homogeneous groups of animals (age, race, weight), after slaughter have complied with the quality to be in class S at a rate of between 48.75% and 68.33% and quality requirements in class E in a ratio of between 43.75% and 25%.
303
It notes that the S grade (percentage of muscle tissue in the carcass 60% or more), group II is superior recording 41 carcass with a share of 68.33% to a total of 39 carcass and a share of 48.75%.
We find that the average carcass price is higher in group I (6.91 lei / kg) compared to group II (5.70 euro / kg).
Regarding grade R (percentage of muscle tissue in the carcass 45% or more, but less than 50%), grade A (percentage of muscle tissue in the carcass 40% or more but less than 45% ) and P grade (below 40%), missing both in group I and group II.
Regarding the group I animals were slaughtered in December 2015 and the animals in group II were slaughtered in February 2016 and as usual trend is for prices to rise, the difference upper price in group I can be explained by the fact that traditional interest to pork it is increased in December along with preparing for the traditional winter holidays, pork and processed pork underpinning the culinary holidays, compared to February.
BIBLIOGRAPHY
1. Banu C., Alexe P., Camelia Vizireanu – Industrial processing of meat, Tehnică Publisher, Bucharest, 2003.
2. Banu Constantin – Treated food industry - Food Technologies, ASAB Publisher, Bucharest, 2008-2009.
3. Dinu I., et all –Treaty swine breeding, Coral Sanivet Publisher, Bucharest, 2003. 4. Racoviţa E. - General technologies in the food industry, Risoprint Publisher,
Cluj-Napoca, 2007.
5. Vladu Marius -Special Animal Husbandry, Volume II - Horses, Pigs, rabbits, birds, Sitech Publisher, Craiova, 2007.
6. Vladu Marius -Processing of animal products, Beladi Publisher, Craiova, 2008. 7. Vladu Marius, Băcilă Vasile, Călin Ion, Băcilă Annamaria – Studies concerning
the influenceof pigs carcasses quality over technological processes at the filet obtain - Scientific papers, seria D, Vol . L II, Animal science, Total publishing, Bucharest, 2009.
8. Vladu Mrius , Băcilă V., Boroșteanu M.V – Studies concerning relation between slaughtering weight and grading carcasses classified in „EUROP„ system at pigs with different provenance,Annales of the University of Craiova, Agricultura Montanologie Cadastru, vol. XXXVII/A, Universitaria Publisher, Craiova, 2008
9. ***** DECISION 267 / 26.02.2004 concerning the establishment of classification of carcasses of pigs, cattle and sheep, Official Gazette no. 228/16 March. 2004
10. ***** Order 457 / 23.06.2004 MAPDR the Minister of Agriculture, Forests and Rural Development approving the technical norms for grading pig carcases Official Gazette no. 564/25 June. 2004
11. ***** ORDER 683 / 26.07.2005 of the Minister of Agriculture and Rural Development amending the Order of the Minister of Agriculture and Rural Development no. 457/2004 approving the technical norms for grading pig carcases Official Gazette no. 719/9 August. 2005