warwick.ac.uk/lib-publications
A Thesis Submitted for the Degree of PhD at the University of Warwick
Permanent WRAP URL:
http://wrap.warwick.ac.uk/108898
Copyright and reuse:
This thesis is made available online and is protected by original copyright.
Please scroll down to view the document itself.
Please refer to the repository record for this item for information to help you to cite it.
Our policy information is available from the repository home page.
T H E B R I T I S H L IB R A R Y
BRITISH THESIS SERVICE
Visual Inspection:
Image Sampling, Algorithms and Architectures.
R ichard C. Staunton
A U T H O R ....
...
D E G R E E ...
A W A R D IN G B O D Y
T h e U n i» e r .ily o f W .n * ic lcD A T E ... .’....
THESIS
N U M B E R ...
T H I S T H E S I S H A S B E E N M I C R O F I L M E D E X A C T L Y A S R E C E I V E D
The quality of this reproduction is dependent upon the quality of the original thesis submitted for microfilming. Every effort has been made to ensure the highest quality of reproduction.
Some pages may have indistinct print, especially if the original papers were poorly produced o r if the awarding body sent an inferior copy.
If pages are missing, please contact the awarding body which granted the degree.
Previously copyrighted materials (journal articles, published texts, etc.) are not filmed.
T h i s c o p y o f th e t h e sis h a s b e e n s u p p lie d o n c o n d it io n t h a t a n y o n e w h o c o n s u lt s it is u n d e r st o o d t o r e c o g n is e t h a t its c o p y r ig h t r e s t s w it h its a u t h o r a n d t h a t n o in fo r m a t io n d e r iv e d f r o m it m a y b e p u b lish e d w it h o u t th e a u t h o r 's p r io r w ritte n c o n s e n t.
Reproduction of this thesis, other than as permitted under the United Kingdom Copyright Designs and Patents Act 1988, or under specific agreement with the copyright holder, is prohibited.
|Cn!s* | ‘ 2 | ' 3 | ' 4 | ' 5 | ' 6 R E D U C T IO N X < 3 . 1 C A M E R A ^
Visual Inspection:
Image Sampling, Algorithms and Architectures.
by
R ichard C. Staunton
subm itted fo r the degree o f
D octor o f Philosophy
to
The University o f W arwick
Departm ent o f Engineering
Contents
Title page.
Contents. i
List of figures. x
List of tables. xviii
Acknowledgements. xix
Declaration. xx
Abstract. xxi
Abbreviations. xxii
1 Introduction. 1
1.1 Vision and Hexagonal Sampling Systems... 1
1.2 Computer Architectures for Industrial Image Processing... 4
1.3 The Structure o f the Thesis... 7
2 Hum an Vision, Com puter Vision, and Industrial Inspection. 11 2.1 Introduction... 11
2.2 Human Vision... 12
2.2.1 The Historical Background of the Study of Human Vision... 12
2.2.2 The Hexagonal Packing of Sensory Elements in the Eye... 12
2.2.3.1 The Mapping of Visual processes onto the Biological Visual system. 16
2.3 Computer and Machine Vision... 19
2.3.1 General Purpose Systems... 19
2.3.2 Machine Vision... 22
2.3.2.1 Robot Vision... 22
2.3.2.2 Visual Inspection... 23
2.3.2.3 Other A p p lic a tio n s ... . ... 27
2.4 Industrial Inspection. Engineering Considerations... 27
2.4.1 Reliability, Processing Rate, and Cost Effectiveness... 27
2.4.2 Automated Surface Inspection... 29
2.4.2.1 Surface Defects and Finish Quality... 30
2.4.2.2 Handwritten and Printed Character Reading... 31
2.5 Conclusions... 33
3 Im age Sam pling. 35 3.1 Sampling Theory... 35
3.2 Sampling Schemes... 37
3.2.1 The Square Scheme... 37
3.2.2 The Rectangular Scheme... 39
3.2.3 The Hexagonal Scheme... 40
3.2.4 Other Schemes... 43
3.3 Image Sensors... 44
3.3.1 TV Cameras... 44
3.3.1.1 Raster Scanned Devices and Image Sampling... 44
3.4 Image Storage and Display... 47
3.4.1 Memory Size... 47
3.4.2 Addressing of Memory in the Rectangular and Hexagonal Systems... 47
3.4.3 Computer Graphics... 50
3.5 Conclusions... 51
4 Image Processing. 54 4.1 Introduction... 54
4.2 High, Mid and Low Level Processes... 55
4.3 Global Low Level Processes... 55
4.3.1 General... 55
4.3.2 FFT of Square and Hexagonally Sampled Data... 57
4.3.3 A Comparison of Filters Operating in Each System... 57
4.4 Local Processes... 58
4.4.1 Processes Implemented on Square and Hexagonal Systems... 58
4.4.1.1 Connectivity... 58
4.4.1.2 Filters... 59
4.4.1.3 Edge Detectors... 65
4.4.1.4 Line Thinning and the Skeleton of an Object... 69
4.4.1.5 Morphological Operators... 71
4.4.1.6 Distance Functions... 74
4.4.2 Processes Only Implemented on the Square System... 74
4.4.2.1 Advanced Edge Detectors... 74
4.5 Mid Level Processes... 77
4.5.1 The Hough Transform... 77
5 A C om parison Between laical Edge Detection Operators in Square and H exagonal
Data Structures. 83
5.1 System Implementation... 83
5.1.1 Overall Computational Processing Time... 85
5.1.2 Calculation of the Edge Operator Mask Weights... 86
5.1.2.1 Square Grid System... 86
5.1.2.2 Hexagonal Grid System... 89
5.1.2.3 Summary of Edge Detector Mask Weights... 91
5.1.3 Edge Accuracy... 91
5.1.4 Circular Band-Limiting of the Modelled Edge Data... 94
5.1.5 Edge Position Within a Pixel... '01
5.2 Conclusions... 105
6 Case Studies: C om parison of Square and Hexagonal System Algorithms. 106 6.1 The Simulation of Hcxagonally Sampled Images... 107
6.2 Surface Defect Detection in Sand Cores used for Automobile Engine Castings. . . 107
6.2.1 Defect Modeling... 113
6.2.1.1 Circular Defects... 117
6.2.1.2 Rectangular Defects... 123
6.2.1.3 Long Thin Defects... 126
6.2.2 Alternative Methods... 128
6.2.3 Sand Core Study Conclusions... 129
6.3 Printed Character Recognition... 131
6.3.1 Printed Character Study Conclusions... 142
7 C om puter Architectures for Machine Vision. 143
7.1 Introduction... 143
7.2 The Parallel Processing of Images... 144
7.3 The Gassification of Processors... 145
7.4 Two and Multi-Dimensional Processor Arrays... 147
7.4.1 Introduction... 147
7.4.2 Fine Grain Arrays... 149
7.4.3 Coarse Grain Arrays... 152
7.4.4 Pyramid Processors... 153
7.5 One Dimensional Arrays... 155
7.5.1 Vector Arrays... 156
7.5.2 Pipelined Processors... 158
7.5.2.1 Real-Time Pipelines... 160
1.52.2 Re-Circulating Pipelines... 163
7.6 The Choice of Architecture for an Industrial Vision System... 165
7.6.1 Introduction... 165
7.6.2 Real-Time Processing... 168
7.6.3 The Reliability of the Image Processes... 169
7.7 Conclusions... 171
8 A Pipeline Processor Element. 173 8.1 Introduction... 173
8.2 A Basic PE Design... 174
8.2.1 The PE External Interconnections... 174
8.2.2 Processor Features... 176
8.2.2.1 Real-Time Processing... 176
8.2.2.2 Image Processes to be Implemented... 177
8.2.3 A Functional Description of the PE Hardware... 180
8.2.3.1 System Overview... 180
8.2.3.2 The Local Area, Line Delays, and Associated Modules... 181
8.2.3.3 The M ultiplier Arrays... 184
8.2.3.4 The Selectable Operator. ... 185
5.2.3.5 The Output Post Processes... 198
8.2.3.6 The Control Unit... 199
8.3 Possible Options and Modifications That Enhance the Basic PE... 203
8.3.1 The Processing o f Hexagonally Sampled Images... 203
8.3.1.1 Pipeline System Modification... 203
8.3.1.2 PE Modification... 204
8.3.1.3 Comment... 206
8.3.2 Alternative Circuits to Reduce the Number of Multipliers in the Multiplier Arrays... 207
8.3.2.1 Separable Operators... 207
8.3.2.2 Simplified Multiplier Array (B)... 209
8.3.3 5x5 Pixel Local Image Areas... 209
8.3.3.1 In G eneral... 209
8.3.3.2 A 5x5 Local Image Area for Parallel Binary Operations Within a Normal 3x3 PE...210
8.4 Image Processing Pipeline Systems Using the Basic PE... 210
8.4.2 Topological Interconnection Possibilities... 211
8.4.3 Towards Adaptive Control... 212
8.5 Conclusions... 214
9 The Sim ulation o f the Pipeline Processor Element. 216 9.1 Introduction... 216
9.2 The Simulation o f Complete Pipelines... 217
9.3 The Processor Element Simulation... 218
9.3.1 Data Input... 219
9.3.2 The Main Processes... 220
9.3.2.1 The Scaling Routines... 222
9.3.3 The Post Processes... 223
9.3.4 Data Output... 224
9.4 The Simulation Results... 225
9.4.1 Convolution Operators... 225
9.4.1.1 Square Sampled Images... 226
9.4.1.2 Hcxagonally Sampled Images... 232
9.4.2 Edge Detection Operators... 233
9.4.2.1 Square Sampled Images... 234
9.4.2.2 Hcxagonally Sampled Images... 237
9.4.2.3 An Alternative Thresholding Strategy... 240
9.4.2.4 Discussion... 241
9.4.3 Sort and Select Operators... 242
9.4.3.1 Median Filters... 243
9.4.3.3 Discussion... 245
9.4.4 Parallel Logical Operators... 246
9.4.4.1 Binary Morphological Operations... 246
9.4.4.2 Thinning Operations... 247
9.5 Conclusions... 250
10 Conclusions and F u rth er W ork. 254 10.1 Conclusions... 254
10.1.1 The Hexagonal Sampling o f Images and Their Processing... 254
10.1.1.1 Sampling... 254
10.1.1.2 Processing... 256
10.1.2 Image Processing in Industrial or Controlled Lighting Environments. . . . 257
10.1.2.1 Image Processing Operators... 258
10.1.2.2 Surface Defect Detection in Sand Cores... 258
10.1.2.3 Printed Character Processing... 259
10.1.3 Computer Architecture... 260
10.1.3.1 Pipeline Architectures... 260
10.1.3.2 The Design o f the PE... 262
10.2 Further Work... 264
10.2.1 Computer Vision and Hexagonal Sampling Grids... 264
10.2.1.1 Operators Requiring Large Areas o f Support... 264
10.2.1.2 The Design and Response o f Sensor Elements... 265
10.2.1.3 Additional Case Studies... 265
10.2.1.4 The Adoption o f Hexagonal Image Sampling... 266
10.2.2 Pipeline Processors... 266
10.2.2.1 The Completion of the PE Design and Fabrication... 266
10.2.2.2 The Host C om puter... 267
10.2.2.3 Adaptive Pipeline Control... 268
10.3 In Summary... 269
List of Figures
1.1 A Simple Pipeline Processor. ... 6
2.1 The Retina... 13
2.2 The Wavelike Appearance of Parallel lines when Viewed Close to the Eyes Reso
lution Limit and the Hexagonal Sensor Pattern that Produces this Effect... 14
2.3 Tiling with Hcxagonally Shaped Local Areas, a Seven Element Local Area That
Produces one Value in the Reduced Resolution Image is Shaded... 17
2.4 The Hexagonal Pyramid Structure... 18
3.1 A Square Grid o f Sampling Points The Area is Tiled with Square Shaped Pixels. 38
3.2 A Tiling of the Frequency Plane with Square Band Limit Regions... 39
3.3 A Rectangular Grid of Sampling Points The Area is Tiled with Rectangular
Shaped Pixels... 40
3.4 Square and Rectangular Band Regions Containing Maximal Circular Band Regions. 41
3.5 A Hexagonal Grid of Sampling Points The Area is Tiled with Rectangular
Shaped Pixels... 41
3.6 A Hexagonal Grid of Sampling Points The Area is Tiled with Hexagon Shaped
Pixels... 42
3.7 A Hexagonal Band Region Containing A Maximal Circular Band Region... 43
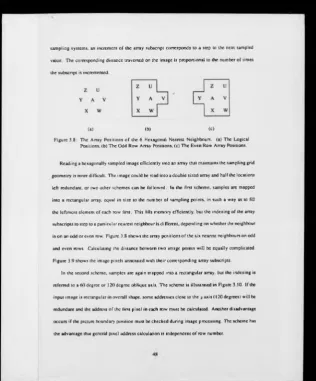
3.8 The Array Positions of the 6 Hexagonal Nearest Neighbours, (a) The Logical
Positions, (b) The Odd Row Array Positions, (c) The Even Row Array Positions. 48
3.9 Hexagonal Pixel and Array Subscript Mapping, Scheme 1... 49
3.10 Hexagonal Pixel and Array Subscript Mapping. Scheme 2... 49
4.2 3x3 Sobel Differential Operators... 66
4.3 Hexagonal Differential Edge Detection Operators... 68
5.1 Circular Neighbourhoods of Radius 1.500 and 1.581 Imposed on 3x3 Square Pixel
Areas... 87
5.2 A Circular Neighbourhood Imposed on a Seven Element Hexagonal Grid Pixel Area. 89
5.3 Variation in the Magnitude o f the Maximum Angular Error as a Function o f the
Radius o f the Circular Neighbourhood... 90
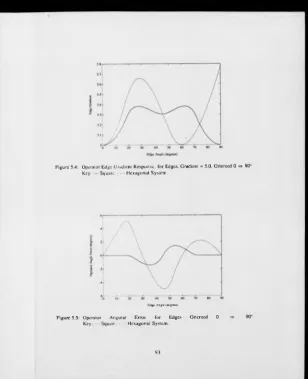
5.4 Operator Edge Gradient Response, for Edges, Gradient = 5.0, Oriented 0 => 90°. 93
5.5 Operator Angular Error for Edges Oriented 0 =>■ 90°... 93
5.6 A Step Edge of Height 10 Units. (A) Profile. (B) The 2-D Image Data Resulting
from Such an Edge, Oriented at 135°. Passing Through a 3x3 Pixel A rea... 95
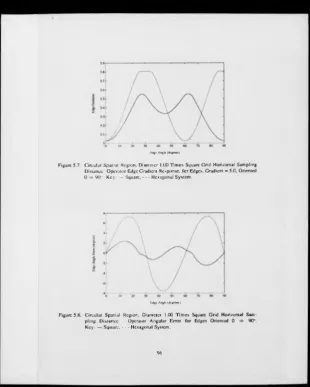
5.7 Circular Spatial Region, Diameter 1.00 Times Square Grid Horizontal Sampling
Distance. Operator Edge Gradient Response, for Edges, Gradient = 5.0, Oriented
0 => 90"... 96
5.8 Circular Spatial Region, Diameter 1.00 Times Square Grid Horizontal Sampling
Distance. Operator Angular Error for Edges Oriented 0 => 90°... 96
5.9 Circular Spatial Region. Diameter 1.50 Times Square Grid Horizontal Sampling
Distance. Operator Edge Gradient Response, for Edges, Gradient = 5.0, Oriented
0 => 90"... 98
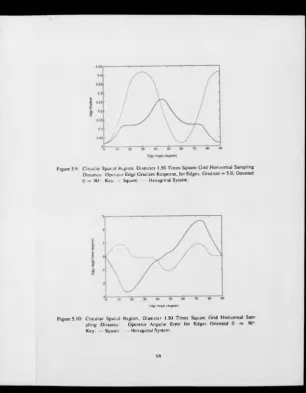
5.10 Circular Spatial Region. Diameter 1.50 Times Square Grid Horizontal Sampling
Distance. Operator Angular Error for Edges Oriented 0 => 90°... 98
5.11 Circular Spatial Region, Diameter 2.00 Times Square Grid Horizontal Sampling
Distance. Operator Edge Gradient Response, for Edges, Gradient = 5.0. Oriented
0 => 90"... 99
5.12 Circular Spatial Region. Diameter 2.00 Times Square Grid Horizontal Sampling
Distance. Operator Angular Error for Edges Oriented 0 90°... 99
5.13 Sobel Operator Edge Gradient Responses, for Families o f Edges, Through Various Common Points Within The Central Pixel. Gradient = 5.0, Oriented 0 => 90°, Square Sampling Point Support Region... 102
5.14 Sobel Operator Edge Orientation Errors, for Families o f Edges, Through Various Common Points Within The Central Pixel. Gradient = 5.0, Oriented 0 => 90°. Square Sampling Point Support Region... 102
5.15 Hexagonal Operator Edge Gradient Responses, for Families o f Edges. Through Various Common Points Within The Central Pixel. Gradient = 5.0, Oriented 0 => 90°, Rectangular Sampling Point Support Region... 103
5.16 Hexagonal Operator Edge Orientation Errors, for Families o f Edges, Through Var ious Common Points Within The Central Pixel. Gradient = 5.0, Oriented 0 => 90°, Rectangular Sampling Point Support Region... 103
5.17 Hexagonal Operator Edge Gradient Responses, for Families of Edges, Through Various Common Points Within The Central Pixel. Gradient = 5.0, Oriented 0 =s* 90“, Circular Sampling Point Support Region, Diameter 1.5 units... 104
5.18 Hexagonal Operator Edge Orientation Errors, for Families o f Edges. Through Var ious Common Points Within The Central Pixel. Gradient = 5.0, Oriented 0 => 90°. Circular Sampling Point Support Region, Diameter 1.5 units... 104
6.1 Rectangular Sampled Sand Core Image, 512x512 Resolution... 108
6.2 Rectangular Sampled Sand Core Image Zoomed, 64x64 Resolution... 109
6.3 Hexagonal Sampled Sand Core Image Zoomed, 64x64 Resolution... 109
6.4 Rectangular Sampled Sand Cote Image Edge Detected, 64x64 Resolution... I l l
6.5 Hexagonal Sampled Sand Core Image Edge Detected. 64x64 Resolution... I l l
6.6 Rectangular Sampled Sand Core Image, Thinned. 64x64 Resolution... 112
6.7 Hexagonal Sampled Sand Core Image, Thinned, 64x64 Resolution...112
6.8 A Simple Circular Defect Model... 115
6.9 A Simple Circular Defect Model with Noise Added and Edge Smoothing...116
6.10 A 3D Plot o f the Sand Core Large Circular Defect Image... 118
6.11 The Threshold Values for Circles, Diameter 6.0 Units. Centred at Various Positions. 119 6.12 The Threshold Values for Circles of Various Diameter. Centred at 7 .2 ,8 .0 ... 119
6.13 The Threshold Values for Smoothed Circles. Diameter 6.0 Units, Centred at Various Positions... 121
6.14 The Threshold Values for Smoothed Circles o f Various Diameter. Centred at 7.2.8.O. 121 6.15 The Threshold Values for 5x5 Unsmoothcd Rectangles with no Added Noise. . . 123
6.16 The Threshold Values for 5x5 Smoothed Rectangles with no Added Noise. . . . 125
6.17 Modelled Rectangular Defect, Square Sampled. Size: 8x2 Pixels, Major Axis at 60 Degrees to the Horizontal, and Noise Added with a Variance o f 400. (a) Grey-level Image, (b ) Edge Detected Image... 127
6.18 Modelled Rectangular Defect. Hexagonal Sampled. Size: Equal to the Correspond ing Square Sampled Defect, and Noise Added with a Variance o f400. (a) Grey-level Image,
(b)
Edge Detected Image... 1276.19 Isolation o f Object Edges Using a Hough Transform Technique... 129
6.20 Thresholdcd Rectangular System Text... 132
6.21 Thresholdcd Hexagonal System Text... 132
6.22 (a) Chin's Thinning Templates, (b) Chin's Restoring Templates... 133
6.23 Rectangular System Text Thinned Without Morphological Smoothing... 133
6.25 Rectangular System Text, Morphologically Smoothed... 134
6.26 Rectangular System Text, Morphologically Smoothed and Thinned... 134
6.27 The Hexagonal Structuring Element... 135
6.28 Hexagonal Thinning and Restoring Templates... 136
6.29 Hexagonal System Text Thinned Without Morphological Smoothing... 136
6.30 Hexagonal System Text Thinned Without Morphological Smoothing, but Utilising Simplified Restoring Templates... 137
6.31 The Letter "E" with Superimposed Skeletons, (a) Square Sampled, (b) Hexagonally Sampled... 139
7.1 A MISD Pipeline... 146
7.2 2-D Processor Array Interconnection Topology, (a) Rectangular, (b) Hexagonal. . 148
7.3 A Fine Grain Array System... 149
7.4 A Pyramid Architecture... 153
7.5 Hartman and Tanimoto’s Pyramid Structure... 155
7.6 A Typical 1-D Systolic Array... 156
7.7 A Typical Pipeline Processor. ... 156
7.8 A Clip7A Linear Array Operating on Two Sub-images... 157
7.9 A Pipeline Processor Element... 159
7.10 A Real-Time Pipelined Image Processor. ... 160
7.11 A Re-Circulating Pipeline System... 163
8.1 A Simple Pipeline Processor Consisting o f two PEs... 174
8.2 PE Input and Output Signals... 175
8.3 A Block Diagram o f the Pipeline Processor Element... 181
8.4 The PE Input Section, Line Delays and Local Area... 182
8.5 The Multiplier Arrays... 185
8.6 The Selectable Operators... 186
8.7 The Convolution Operator Module... 187
8.8 The Edge Detection Selectable Operator. ... 189
8.9 Daniclsson's Circuit to Perform the Rank Ordering Algorithm... 194
8.10 Daniclsson’s Logic Cell... 195
8.11 The Corrected Logic Cell... 195
8.12 A Corrected Stage o f the Circuit to Perform the Rank Order Algorithm...196
8.13 The Parallel Binary Operator. ... 197
8.14 The Output Post Processes... 199
8.15 The Control Unit... 200
8.16 A to D Convener Sample and Data Read Timing... 204
8.17 The Relationship Between the 9 Input Pixels and the 6 Hexagonal Nearest Neigh bours on Alternate Scan Lines... 205
8.18 The Alternative Convolution Module Circuit... 208
8.19 A Programmable Video Rate Pipeline... 211
8.20 A Programmable Re-circulating Pipeline... 211
8.21 A Multi-pipeline Re-circulating System... 212
8.22 A Multi-pipeline Arrangement to Produce an Edge Overlay on an Im age... 213
9.1 64 x 64 image. Unsmoothcd and Smoothed by G\ with Distributed Scaling. . . . 227
9.2 The Low Contrast Test Image and the Brightness Values in the Vicinity of one of the Comers... 228
9.3 The Application of ( !\ and (¡2 to the Image Without Distributed Scaling... 228
9.4 The Application of ( !\ and G j to the Image With Distributed Scaling... 229
9.5 Edge Dclccicd Rectangular Image, (St) High Threshold, (b) Low Threshold. . . . 229
9.6 (a) The Low Contrast Test Image (b) After High Pass Filtering (c) Numerical
Representation. No Scaling (d) Numerical Representation After Distributed Scaling
and a Word Width Limit of 8 Bits... 231
9.7 Hexagonally Sampled Sand Core Image, Unsmoothcd and Smoothed by G'4 with
Distributed Scaling... 233
9.8 The Application of 6 4 to the Hexagonally Sampled Low Contrast Rectangle Image,
Without and With Distributed Scaling... 233
9.9 (a) The Low Contrast Rectangle Image, (b) Edge Image with High Threshold
Level (c) Edge Image with High Threshold Level and Distributed Scaling (d) Edge
Image with Low Threshold Level (c) Edge Image with Low Threshold Level and
Distributed Scaling... 235
9.10 Square Operator Edge Gradient Response for Edges, Gradient = 5.0, Oriented
0 => 90"... 236
9.11 High Pass Edge Filtered Version of the Low Contrast Rectangle...237
9.12 (a) The Low Contrast Rectangle Image, (b) Edge Image with High Threshold
Level (c) Edge Image with High Threshold Level and Distributed Scaling (d) Edge
Image with Low Threshold Level (c) Edge Image with Low Threshold Level and
Distributed Scaling... 238
9.13 Hexagonal Operator Edge Gradient Response for Edges, Gradient = 5.0, Oriented
0 => 90"... 240
9.14 A Typical Gradient Magnitude Squared to Threshold Transformation...241
9.15 An Edge Detected Low Contrast Rectangle Image, Alternative Threshold Procedure. 241
9.16 Square Sampled 64 x 64 image, Unsmoothcd and Smoothed by a Square 3x3 Median
Filler. ... 243
9.17 Hcxagonally Sampled 64 x 64 image. Unsmoothed and Smoothed by a 7 Element
Median Filter. ... 244
9.18 Square Sam pled Five Item Input Image Together With Grey Level Moiphologically
Closed Version... 244
9.19 (a) Hcxagonally Sampled Five Item Input Image, (b) Grey Level Morphologically
Dilated Version, (c) Grey Level Morphologically Closed Version...245
9.20 (a) Binary Image, (b) Morphologically Dilated, (c) Morphologically Closed, (d)
M orphologically Eroded, (e) Morphologically Opened. - ... 247
9.21 Edge Detected Sand Core Image Together With Thin-OPTA Image... 248
9.22 Original Text Image Together With Thin-OPTA Image... 248
9.23 Hexagonally Sampled Edge Detected Sand Core Image Together With Thinned
Image... 249
9.24 Original Hcxagonally Sampled Text Image Together With Thinned Image...250
List o f Tables
5.1 Edge Magnitude Computation Time for Each Pixel. PC Computer: Olivetti M28
with Intel 80286 Processor. Clock rate 8 MHz... 86
5.2 Edge Detector Mask Weights for a 3x3 Operator, radius r = 1.500... 88
5.3 Edge Detector Mask Weights for a 3x3 Operator, radius r = 1.460... 88
5.4 Edge Detector Mask Weights for a Seven Element Operator as Indicated by theCir-cularity Principle... 90
5.5 Edge Detector Mask Weights for a Seven Element Operator as Indicated by a Numerical Method... 91
5.6 Final Edge Detector Mask Weights for Both Systems... 91
6.1 Threshold Value Statistics for 50 Random Circular Defects... 122
6.2 Threshold Value Statistics for 50 Random Rectangular Defects... 126
6.3 Threshold Value Statistics for 25 Random Long Thin Defects... 128
6.4 A Comparison of 150 Small Characters... 138
6.5 A Comparison of 150 Large Characters... 139
6.6 Analysis of the Skeletal Lines of Character Strokes... 140
6.7 Analysis of Skeletal Junctions... 140
6.8 Analysis o f Tight Skeletal Curves... 141
8.1 The Arguments to be Sorted, .4,, and the Corresponding Bit Vectors, D ,... 191
8.2 The Rank Ordering Process... 191
Acknowledgements
I would especially like to thank my supervisor. Dr. N. Storey for his help and advice throughout
the course o f this work. I would also like to thank Professor W. C. Cullyer for reading the thesis
and his many valuable comments on its presentation.
Thanks are also due to the many other members of the Department of Engineering who have
added their encouragement, and provided much valuable advice. Particular thanks go to Professor
D. K. Bowen. Dr S. S. Lawson. Dr H. V. Shurmcr, Dr S. Summerficld, Dr T. Tjahjadi, and M r W.
Wong.
Last but not least. I am grateful to my wife. Julie, for h er encouragement, understanding and
Declaration
None o f the original work in this thesis was started before the 1st January 1986, when the author
registered for this degree. The following is a list of publications that have been made on work
contained within this thesis together with the numbers of the sections to which they relate.
1. Staunton, R C. "The Design o f Hexagonal Sampling Structures for Image Digitisation and Their
use With Local Operators", ¡mane and Vision Computing, Vol. 7, No. 3, Pages 162-166, 1989.
Relevant Thesis sections:- 3.2, 3.3,4.3,4.4, 5.1, 12.1.1.
2. Staunton, R C. "Hexagonal Image Sampling a Practical Proposition", Proc. SPIE, Vol. 1008,
Pages 23-27.1989.
Relevant Thesis sections:- 4.3, 4.4, 5.1, 12.1.1.
3. Storey, N and Staunton, R C. "A Pipeline Processor Employing Hexagonal Sampling for Surface
Inspection", 3rd Int Conf. On Image Processing and its Applications. IEE Conference Publication
307. Pages 156-160, 1989.
Relevant Thesis sections:- 6.2, 8.3, 10.2, 12.1.2,12.1.3.
4. Storey, N and Staunton, R C. "An Adaptive Pipeline Processor for Real-time Image Processing",
Proc. SPIE. Vol. 1197, Pages 238-246, 1990.
Relevant Thesis sections:-8.2, 8.3, 10.2, 12.1.3.
5. Staunton. R C and Storey, N. "A Comparison Between Square and Hexagonal Sampling Methods
for Pipeline Image Processing", Proc. SPIE, Vol. 1194, Pages 142-151, 1990.
Abstract
The thesis concerns the hexagonal sampling of images, the processing of industrially derived
images, and th e design of a novel processor element that can be assembled into pipelines to effect
fast, economic and reliable processing.
A hcxagonally sampled two dimensional image can require 13.4% fewer sampling points than
a square sampled equivalent. The grid symmetry results in simpler processing operators that
compute more efficiently than square grid operators. Computation savings approaching 44% arc
demonstrated. New hexagonal operators arc reported including a Gaussian smoothing filter, a binary
thinner, and an edge detector with comparable accuracy to that o f the Sobcl detector. The design of
hexagonal arrays of sensors is considered.
Operators requiring small local areas of support are shown to be sufficient for processing
controlled lighting and industrial images. Case studies show that small features in hcxagonally
processed im ages maintain their shape better, and that processes can tolerate a lower signal to noise
ratio, than that for equivalent square processed images. The modelling of small defects in surfaces
has been studied in depth.
The flexible programmable processor element can perform the low level local operators required
for industrial image processing on both square and hexagonal grids. The element has been specified
and simulated by a high level computer program. A fast communication channel allows for dynamic
reprogramming by a control computer, and the video rate element can be assembled into various
Abbreviations
1D.2D.2.5D . 3D ... ... One, two. two and a half, three dimensional
A-D ... ... Analogue to digital converter
ALU ... ... Arithmetic and logic unit
A S C I ... ... American standard code for information interchange
ASIC ... ... Application specific integrated circuit
CAD - CAM ...
CCD ... ... Charge coupled device
CMOS ... ... Complementary metal oxide silicon
DDFOM ... ... Defect detection figure o f merit
FFT ... ... Fast Fourier transform
FIR ...
HFFT ...
MIMD ... ... Multiple instruction stream, multiple data stream
MISD ...
PCB ...
PE ...
Pixel ...
SIMD ... ... Single instruction stream, multiple data stream
SISD ... ... Single instruction stream, single data stream
C h ap ter 1
Introduction.
This thesis is concerned with vision. Vision involves the acquisition and processing of information
about an environment by sensing electromagnetic or other radiation, emitted or reflected by the
features within the environment. Some aspects of human vision and the more general principles
o f computer vision arc discussed, with a special emphasis on hexagonal image sampling. The
main thrust o f the thesis is, however, in the areas o f machine and industrial vision. Algorithms are
developed which compute hcxagonally sampled images efficiently. They compare favourably to
their square system counterparts. A pipeline processor is designed to process hexagonal and square
sampled images, of the kind often encountered in industry, at high speed.
1.1 Vision and Hexagonal Sampling Systems.
The first task of a vision system is to sense the image of the scene about which information is to be
gathered. Sensors can be designed to respond to various frequency bands. Often they convert the
light intensity received into an electrical brightness signal. Two dimensional (2D) arrays o f such
sensor elements, or a single clement or 1D array scanned throughout a sensing area, can be used
to build up a picture of the scene. Such a picture is referred to as a 2D monochrome or grey level
image. A human observer can distinguish the boundaries between the objects within the image by
the discontinuities in the brightness field that occur at them. Then, by using other clues such as
the position of shadows, o r prior knowledge, the observer can recognise and categorise the various
objects depicted in the image. Computers can also be programmed to provide image processing and
object recognition, but at present humans can cope with a far wider range of scene types, objects,
and lighting conditions than any single computer vision system.
Further information can be obtained to case the task of object recognition, but more information
can mean that more processing is required. The 2D array of sensors can include sensors that
respond maximally to differing frequencies in the visible spectrum, thus adding colour information.
A sequence of images can be obtained over a time period, and from the relative positions of the
edges o f moving and stationary features, the objects recognised. The sensors can be moved to a
new position, and a second image acquired. This can, with further processing, add depth or 2.SD
information. A 2.5D image differs from a 3D image in that only the distances to the visible surfaces
are known.
A 2D array of sensors samples the image. Each sensor, at an individual position in the array,
provides information on that pan of the image. The distance between two excited sensors within the
array provides relative distance information. Sampling is achieved with single sensor systems and
ID arrays by moving them to a new position and then taking a new set o f intensity measurements.
In real life images, it is only on rare occasions that only two sensors in the array will be excited
coincidentally, and that all the required information on the scene can then be obtained. Various
processes have to be performed on the grey level images to extract relevant information about, for
example:- brightness differentials, brightness constancy, or texture patterns. From this low level
information, higher levels of knowledge on, for instance, object structure can be obtained. One of
the topics explored in this thesis concerns the hexagonal arrangement, or packing, o f sensors. With
such an arrangement six neighbouring sensors are situated cquidistanily from a central sensor, and
this pattern is then repeated throughout the sensing area. Previous researchers (124] have proved
these hexagonal sampling grids to be the most efficient, in that fewer sensors are required to provide
equal spatial resolution than with alternative grid patterns. An alternative, and more commonly used,
grid pattern is the square sampling grid. Here horizontal rows and vertical columns of samples are
assembled. Each sensor has four nearest neighbours, tw o horizontally and two vertically. Generally
the square grid requires more sensors than an equivalent hexagonal grid to cover a given area if the
resolution o f the image is equal in all directions.
Previously a gap existed in the techniques available for image processing on the hexagonal grid
in that processes were available only for images containing two brightness levels (binary images),
and for general 2D signal processing. These general signal processing techniques included Fourier
transforms, fast Fourier transforms, and filters, but the filters available were not necessarily optimum
for image processing. A set of grey level image processing operators have been developed and
are reported in the thesis. The set is not comprehensive as it was not the intention to produce a
hexagonal grid operator equivalent to every existing square grid operator. The set is limited to the
low level operators that perform the preliminary operations on the image data, as these are more
dependent on the sampling grid geometry. It is also limited to grey level images and only operates
within the plane o f one image, as opposed to a sequence of images. A third restriction of the set
is that it contains only small local area operators. The local area contains a region of samples
surrounding a point of interest.
The use of small local area operators with the square grid system is well established. They
have been found to be adequate for many image processing requirements where the image has been
captured under controlled, or near perfect lighting conditions. It is often less expensive to create
these conditions in an industrial situation than to provide more powerful computers to process the
larger and more complicated operators required for poorly lit images. Industrial image processing
has been reviewed and a set of widely differing operators chosen for implementation on both square
and hexagonal sampling grids. It w ill be shown that due to the higher symmetry o f the hexagonal
grid, a computational advantage can exist in addition to that gained because o f the reduction in the
number of sampling points required to cover the image.
For some operator types it was simply necessary to modify the existing square grid operators
for the hexagonal grid, but for others a new design was required. A new design was required for
a hexagonal edge (boundary) detector. The test results and comparison of this detector, with the
square system equivalent, occupy th e whole of Chapter 5 o f the thesis.
In addition to comparisons between the individual operators for the two grid systems, some
comparisons between processes operating on images captured in an industrial environment, and
requiring the use of several operators have been undenaken. With these processes, not only is the
efficiency compared, but also the overall quality of the process. It was found that for some processes
fewer operators are required with the hexagonal system. The industrial examples compared include
the detection of small surface defects and the processing of printed characters. Comments are made
on the suitability of hexagonally sam pled images for human viewing, and it is shown in Chapter 6,
that in some circumstances it is easier to interpret them than an equivalent square sampled image.
Hcxagonally sampled images have advantages for low level image processing in that fewer
samples arc required, the operators are simpler, and sometimes fewer operators are required. For
industrial image processing, a system must be cost effective, as fast as the production line on which
it is to be used, and reliable in that it must produce few incorrect decisions or measurements. It is
in this area that the processing o f hexagonally sampled images is likely to have m ost impact.
1.2 Computer Architectures for Industrial Image Processing.
Once a list o f local image processing operators for use on hexagonal and square grids o f sampling
implemented. The operators arc so simple that almost any modem digital computer can be used.
It is th e rate at which the images need to be processed for a particular application that primarily
determines the choice of computer. Two application areas have been identified. In the first, images
are processed at the rate at which they are captured, usually the video rate, and displayed for use
by a human observer. In the second, applicable to machine vision, images are processed at a rate
determined by the rate at which the scene changes. An industrial production line is an example
o f th e second application area. If a machine vision system has to inspect parts as they pass along
the line, then the processing on one pan must be completed before the next comes into view. The
processing rate is determined by the pan rate.
T h e video rate is determined by the video standard in use. In Europe the usual image rate
is 25 frames a second. With production lines, pan rates can be several pans a second, but other
applications may require an even faster update rate. However, the highest rate is likely to be the
video rate, and the computer for a combined video and pan rate processing system, must therefore
be capable of processing 25 pictures in one second. Video rate processing is advantageous as it
can be arranged that no frame store buffer memory is required between the TV camera and the
computer.
The data rate at which the computer must operate is set by the number o f picture elements
(pixels) in the image and the frame rate. For a 2D sensor array the number o f pixels is usually
equal to the number of sensors. Images typically contain up to 512x512 pixels, although for some
applications, considerably more. For a video rate application described in Chapter 8 of the thesis,
the image data rate is 13.0 M Bytes.s~1. Several operations arc often required on each datum, and
so processing rates can be multiples of the data rate. Other factors that determine the choice of
com puter arc the cost and its flexibility of use.
For industrial applications the cost of the computer and its ability to process 512x512 images at
the video rate are important. These two considerations can result in the use o f parallel computers,
in which the task is divided up and shared by several processor elements (PEs). Parallel computer
architectures are reviewed, and a pipeline architecture, in which the image data is streamed serially
through a string of processors, has been chosen for further investigation. The pipeline processes
local area operators efficiently, is fast enough for video rate calculations, and the individual PEs can
be readily mass produced and assembled into inexpensive flexible computers.
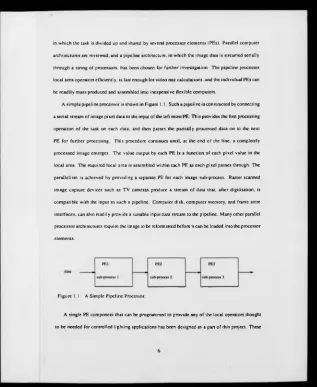
A simple pipeline processor is shown in Figure 1.1. Such a pipeline is constructed by connecting
a serial stream of image pixel data to the input o f the left most PE. This provides the first processing
operation o f the task on each data, and then passes the partially processed data on to the next
PE for further processing. This procedure continues until, at the end of the line, a completely
processed image emerges. The value output by each PE is a function o f each pixel value in the
local area. The required local area is assembled within each PE as each pixel passes through. The
parallelism is achieved by providing a separate PE for each image sub-process. Raster scanned
image capture devices such as TV cameras produce a stream o f data that, after digitisation, is
compatible with the input to such a pipeline. Computer disk, computer memory, and frame store
interfaces, can also readily provide a suitable input data stream to the pipeline. Many other parallel
processor architectures require the image to be reformatted before it can be loaded into the processor
elements.
Figure 1.1: A Simple Pipeline Processor.
A single PE component that can be programmed to provide any o f the local operators thought
[image:32.378.22.339.13.400.2]PEs can be assembled into pipelines constructed on single circuit boards, and configured by a host
computer to provide many low level image processing tasks. The host computer can either accept
data from the pipeline and continue with high level processing tasks, in which case the pipeline acts
as a pre-processor, or it can direct the output to a TV monitor for observation.
A fast control communication channel between the PEs and the host computer enables the PEs
to be reprogrammed during the inter-image period, and allows control information to be fed back
from the PEs to the host computer. As discussed in Section 8.4.3, this will enable the adaptive
control o f pipelines in future developments. By making the delay to the passage of data through
each PE independent of the image process, the branching and merging of pipelines, or the use of
parallel lines can be achieved. These and other pipeline connection topologies are explored in
Chapter 8 o f the thesis.
The PE, specified in Chapter 8, will process both hexagonal and square sampled data. This
dual standard device has been simulated and the results of the simulation reported in Chapter 9.
Comparisons arc made between results obtained from the simulated PE operating on equivalent
images in both systems. The advantages and disadvantages o f hexagonal processing arc stated.
1.3 The Structure of the Thesis.
Vision and hexagonal sampling systems arc explored in Chapters 2 to 6, and computer architectures
for industrial image processing in Chapters 7 to 9. The overall conclusions reached during the
project are presented in Chapter 10. A summary of the contents o f each chapter follows.
Chapter 2: Human Vision, Computer Vision, and Industrial Inspection. The general areas of
biological, computer and industrial vision arc surveyed. Comparisons are made between the com
plexity o f processes, the definition of real-time processing, the image types that require processing,
and the adaptability of systems, in each area.
Chapter 3: Image Sampling. Initially the general aspects o f image sampling arc discussed. These
include the sampling theory, and quantisation errors in the pixel brightness and position. Aspects
of image reconstruction arc explored, and circularly band limited 2D signals arc defined. Square,
rectangular and hexagonal grids o f sampling points covering 2D images arc compared. Popular
image sensing, display and storage devices arc investigated, together with computer graphics
techniques.
Chapter 4: Image Processing. In this chapter image processing is reviewed, and then the
discussion centres on low level processes, that is processes on data that arc associated with points
on the sampling grid. Low level processes arc divided further into those that are global or require a
large area of suppon. and those that arc local and require a small area of support. Those requiring
a small area of support arc more relevant to the remainder o f the thesis. Many algorithms have
been developed for operators in both of these groups for square sampled images. For hcxagonally
sampled images, only binary local algorithms, and some general purpose 2D signal processing
global algorithms previously existed. Some local grey level processes, developed as a part of this
project, arc reported and compared with their square grid system counterparts.
Chapter 5: A Comparison Between Local Edge Detection Operators in Square and Hexagonal
Data structures. The design o f a hexagonal grid edge detector that is equivalent to the square
grid Sobel detector is reported. Comparisons arc made between the edge magnitude and angular
accuracies of the two detectors in addition to comparisons o f computational efficiency.
Chapter 6: Case Studies, a Comparison of Square and Hexagonal System Algorithms. Two
industrial case studies have been undertaken to identify the relevance of the set of local operators
assembled in Chapter 4. Redundant operators identified at this stage, lead to the simplification of the
the hexagonal and square sampling grids, from the points of computational efficiency and process
reliability.
Chapter 7: Computer Architectures for Machine Vision. This chapter contains a survey of
the computer architectures that have been commonly used for computer vision. The various
possible architectures arc classified, and their advantages explored. Finally, architectures suitable
for processing images captured under controlled lighting conditions, such as is often the case with
industrially derived images, are discussed. Pipelined systems o f processor elements, within which
small local image areas are assembled and operated on, show advantages for this class o f image
processes.
Chapter 8: A Pipeline Processor Element. The design of a processor element that can be
assembled into a variety o f image processing pipeline architectures is discussed. It will be able
to perform the low level local image processing operations that have been identified in previous
chapters as being useful for images that have been captured in industrial and controlled lighting
conditions. It will be able to process both square and hexagonally sampled images at picture rates
up to the video rate. Some novel pipeline image processors that use this re-configurable processor
element as a building block arc discussed.
Chapter 9: The Simulation of the Pipeline Processor Element. The results from a simulated
pipeline o f PEs arc presented. The pipeline processing of industrial and controlled lighting environ
ment images with PEs that accumulate only small local areas is shown to be feasible, on both the
square and hexagonal sampling grids. The PE is simulated largely as it is described in Chapter 8,
and internally, the circuit blocks identified there are realised by individual subroutines within the
simulation. Some choices arc then made as to which circuit blocks need to be implemented. The
word widths of the data paths within the PE are chosen. Minimising these reduces the area of
silicon required by the device, but this must be balanced against a reduction in the accuracy of the
calculations.
C hapter 2
Human Vision, Computer Vision, and
Industrial Inspection.
2.1 Introduction.
In this chapter the fields o f hum an vision, computer vision, and industrial inspection arc surveyed.
The complexity of the hum an visual process is noted and the hexagonal packing o f the retinal
cells and the hexagonal interconnections between processing cells discussed. The scientific basis
o f computer vision is briefly introduced and the interaction between it and human vision research
which has lead to the development of robust general image processing algorithms noted. With
industrial image processing, however, the lighting conditions and the number of possible image
scenes arc strictly limited, and this has been exploited in the development o f simple processing
algorithms that can execute on inexpensive computer hardware. Some examples of industrial vision
2.2 Human Vision.
2.2.1 The Historical Background of the Study of H u m a n Vision.
Historically, the study o f human vision was probably a necessary prerequisite to the study of com
puter vision. However, our knowledge of how biological vision systems operate is still fragmentary
and with the recent development of the field of computer vision, a fresh impetus has been given to
the study o f human vision.
Biological and opthalmic observations on the human eye indicate that a hexagonal packing of
retinal sensory elements has evolved in nature. This is a m otivation for the study of hexagonal
sampling schemes for computer vision which is one of the topics covered in this thesis. Behind
the eye, ganglion cells and neurons connect to the retinal sensory elements and to each other to
provide processing of the image focused on the retina. M odels o f biological image processing
have lead to the development of computer architectures such as artificial neural networks and
pyramid processors for computer vision. Finally, studies o f the "higher levels" of human vision
have suggested algorithms for object detection and location, stereopsis and movement detection
amongst others.
2.2.2 The Hexagonal Packing of Sensory Elements in the Eye.
Helmholtz in his "Treatise on Physiological Optics, 1909" [751, begins with an anatomical descrip
tion of the eye. The higher orders of life have eyes capable of distinguishing both light and darkness
and also form. To enable this, the eyes can have one o f two forms. The first, common among
insects, is a composite eye, in which sensory elements separated by opaque septa cover the surface
o f the eye. The elements at the surface of the eye, are usually o f a hexagonal or square shape.
The second form o f eye, as with the eyes of many vertebrates, has a lens which focuses light onto
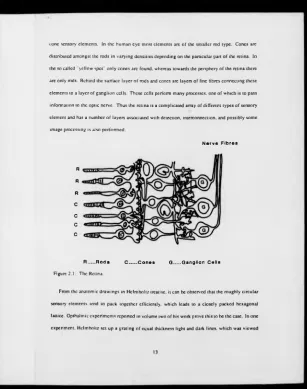
a retina. A section of a retina is shown in Figure 2.1. The retina can be comprised o f rod and
cone sensory elements. In the human eye most elements are of the smaller rod type. Cones arc
distributed amongst the rods in varying densities depending on the particular pan o f the retina. In
the so called "yellow spot" only cones arc found, whereas towards the periphery o f the retina there
are only rods. Behind the surface layer o f rods and cones arc layers of fine fibres connecting these
elements to a layer of ganglion cells. These cells perform many processes, one of which is to pass
information to the optic nerve. Thus the retina is a complicated array o f different types of sensory
element and has a number o f layers associated with detection, interconnection, and possibly some
image processing is also performed.
N e r v e F ib r e s
R
R
R
C
C
C
C
[image:39.377.25.332.12.401.2]R .... R o d s C ... C o n e s Q ...G a n g lio n C e lls
Figure 2.1: The Retina.
From the anatomic drawings in Helmholtz treatise, it can be observed that the roughly circular
sensory elements tend to pack together efficiently, which leads to a closely packed hexagonal
lattice. Opthalmic experiments reported in volume two of his work prove this to be the ease. In one
experiment. Helmholtz set up a grating o f equal thickness light and dark lines, which was viewed
at various distances and under differing lighting conditions to measure the spatial resolution o f the
eye. His results indicated that two bright lines could only be distinguished if an unstimulatcd retinal
element existed between the elements on which the images of the lines fell. This is in accordance
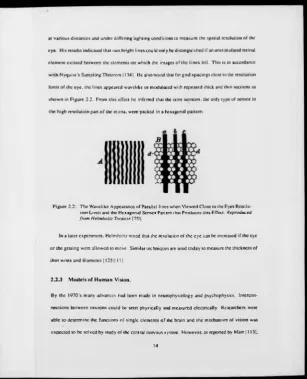
with Nyquist's Sampling Theorem 1134). He also noted that for grid spacings close to the resolution
lim it o f the eye, the lines appeared wavelike or modulated with repeated thick and thin sections as
shown in Figure 2.2. From this effect he inferred that the cone sensors, the only type of sensor in
th e high resolution part o f the retina, were packed in a hexagonal pattern.
Figure 2.2: The Wavelike Appearance o f Parallel lines when Viewed Close to the Eyes Resolu tion Limit and the Hexagonal Sensor Pattern that Produces this EfTcct. Reproduced from Helmholtz Treatise [751.
In a later experiment. Helmholtz noted that the resolution of the eye can be increased if the eye
o r the grating were allowed to move. Similar techniques are used today to measure the thickness of
thin wires and filaments [12511111
2.2.3 M o d e ls of H u m a n Vision.
By the 1970’s many advances had been made in neurophysiology and psychophysics. Intercon
nections between neurons could be seen physically and mexsured electrically. Researchers were
able to determine the functions of single elements o f the brain and the mechanism of vision was
expected to be solved by study of the central nervous system. However, as reported by Marr ( 1131,
[image:40.377.24.332.17.397.2]this expectation was incorrect, as an analysis o f the eye as an information processing system was
also required. He also noted that visual information processing is very complicated even though,
as humans, we arc able to process information apparently instantaneously, and for a wide range of
scenes under greatly varying lighting conditions.
Man- states [113] Vision is a process that produces from images o f the external world a
description that is useful to the viewer and not cluttered with irrelevant information". He then
continues to analyse vision as a system to which the input is the image o f the external world and
the output is the description. The description could be the spoken word, but more fundamentally,
evidence points to a description that is a three dimensional model of objects within the image
as being the output of the vision system. This model is independent o f the vantage point o f the
observer in that all external surfaces are described, and Marr identifies a three stage representational
framework to enable the three dimensional shape information to be derived from the original image.
In his book, Marr [113] provides illustrated examples at the various stages.
The first stage is the Primal Sketch. Here, important two dimensional information in the
image is identified, for example edge detection, where edges arc defined as the boundaries between
segments in the image, and may be found from discontinuities between the brightness of points
within the image. The second stage is the 2.5-D Sketch. Here depth information on the surfaces
visible from the viewers reference point is calculated and discontinuities in depth and orientation
noted. The final stage is the 3-D Model Representation. Shapes and their spatial organisation arc
described in an object centered coordinate system. Volume and shape primatives arc identified and
attached to a wire frame model of the object to provide the final description. Marr produced many
papers on topics within this representational framework and developed many algorithms for the
data processing primatives at the various stages. These are listed in the bibliography o f [113] and
his paper on the "Theory of edge detection" [114] is discussed further in Section 4.4.2.1. These
algorithms can o f course be modelled on digital computers. The algorithms and models developed
by Marr have been used as the basis o f many of the current algorithms and models used in modem
image processing research. Some of them, for example his edge detector and the 3-D model, appear
to be difficult to implement efficiently on computers.
1.13.X T h e M apping of Visual processes onto the Biological Visual system.
More recent researchers have attempted to map vision processes more exactly onto the biological
visual system. As an example, the following work by Watson and Ahumada 1184][ 183] on a model
of image representation in the visual cortex is included.
Anatomically, behind the hexagonally packed retinal sensors arc a layer o f retinal ganglion cells
which, in the centre of the retina, connect one to one with the sensors 1140). The ganglion cells can
also be considered to be connected on a hexagonal grid. The 2.106 ganglion cells connect to the
visual cortex which contains approximately 109 neurons. Physiological experiments have shown
that between the retina and the visual brain, the image undergoes a sequence o f transformations.
Sets o f cells in the cortex can be identified with these various transforms. Watson and Ahumada
consider a transform performed by the ganglion cells and a subsequent one performed within the
cortex. The ganglion cells transfer spatial and brightness information. Their transfer function
is broad-band and they provide local adaptive gain control. The transform within the cortex is
different. The cells are narrow-band and employ a so called hybrid space-frequency code to convey
the position, spatial variation and orientation of a region. Watson and Ahumada model the process
in this set o f cells by a structure, described below, which they refer to as a hexagonal orthogonal
oriented quadrature pyramid. This is considered further here to indicate the complexity of the
human visual system compared to current machine vision systems, and the necessity for the large
number o f cells involved to process a wide range o f image types as they are presented in real-time
to the hum an being. Real-time infers here that the images arc processed quickly enough for us to
continue to function as we do. Some machines may be able to process specific visual information
more quickly, but cannot cope with the variety of scenes and lighting conditions that a human can.
Simple pyramid processing structures, commonly used in computer vision, arc described in
Section 7.4.4. The image transform performed can be considered as image coding and performed
by an image pyramid. Pyramids, introduced by Tanimoto and Pavlidis (170], filter the image into
several levels o f resolution. At the bottom is the highest resolution image. This is subsampled to
produce a lower resolution image at the next highest level in the pyramid, and so on, until at the
highest level is an image with the lowest resolution. The aim of Watson and Ahumada was to model
the transform in the human cortex with a pyramid constructed from elements that were themselves
modeled on known physiological components. The pyramid had a hexagonal lattice input layer, the
[image:43.378.23.331.13.399.2]transform was invertible, and the overall process was found to be efficient.
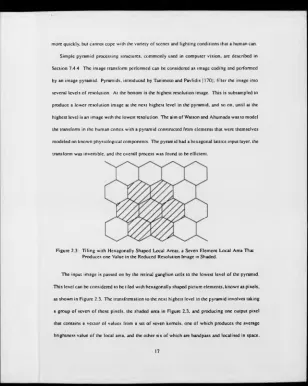
Figure 2.3: Tiling with Hcxagonally Shaped Local Areas, a Seven Element Local Area That Produces one Value in the Reduced Resolution image is Shaded.
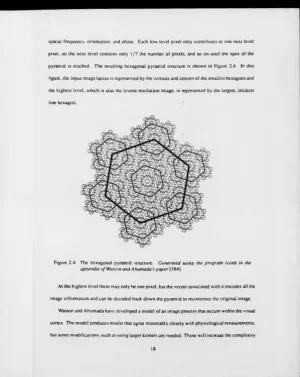
The input image is passed on by the retinal ganglion cells to the lowest level o f the pyramid.
This level can be considered to be tiled with hcxagonally shaped picture elements, known as pixels,
as shown in Figure 2.3. The transformation to the next highest level in the pyramid involves taking
a group of seven of these pixels, the shaded area in Figure 2.3, and producing one output pixel
that contains a vector of values from a set o f seven kernels, one of which produces the average
brightness value o f the local area, and the other six o f which arc bandpass and localised in space.
spatial frequency, orientation, and phase. Each low level pixel only contributes to one next level
pixel, so the next level contains only 1 /7 the number o f pixels, and so on until the apex o f the
[image:44.374.26.327.16.394.2]pyramid is reached. The resulting hexagonal pyramid structure is shown in Figure 2.4. In this
figure, the input image lattice is represented by the vertices and centres o f the smallest hexagons and
the highest level, which is also the lowest resolution image, is represented by the largest, thickest
line hexagon.
Figure 2.4: The hexagonal pyramid structure. Generated using the program listed in the appendix o f Watson and Ahumada 's paper [ 184],
At the highest level there may only be one pixel, but the vector associated with it encodes all the
image information and can be decoded back down the pyramid to reconstruct the original image.
Watson and Ahumada have developed a model o f an image process that occurs within the visual
cortex. The model produces results that agree reasonably closely with physiological measurements,
but some modifications, such as using larger kernels arc needed. These will increase the complexity
of ihe model. The transform developed is a low level visual pioccss. and is only pan of the
process o f producing Marr's Primal Sketch. Human vision is very general purpose and processes
arc accomplished in real-time. The retina, visual cortex and visual brain have evolved to be
highly developed, complicated organs. In the past studies o f human vision have prompted the
development of algorithms for computer vision, however, only a small consideration has been given
to the hexagonal packing o f machine vision sensors and the processing of the resulting hcxagonally
sampled images.
2.3 Computer and Machine Vision.
2.3.1 General Purpose Systems.
A general purpose computer vision system would include all the functions o f human vision, and
ideally, would compute in real-time. Here, real-time means that the machine o f which the vision
system is a pan. can operate at its designed rate. Additionally, as noted by Horn [81] it would also
have to reason about the physical world. There has been much research specifically towards the
goal of the general purpose system, one approach has been to implement a system within Marr’s
processing framework ( See Section 2.2.3 ). Such a study was undertaken in the UK as pan of the
Alvey Programme [3].
The core o f a general purpose vision framework should be implcmcntable on any hardware
system, whether a biological system or an electronic computer. Differences occur at the input and
output stages. In computer vision, the image input sensor could be one or more from a widely
divergent set including:- monochrome and colour TV cameras, line scan cameras and multiple
frequency band detectors such as those used for remote sensing [68], System output will depend on
the environment, and on the overall function of the machine o f which the vision processor is a part.
For a computer vision system, the choice of architecture is an important consideration. The more
general purpose a system is. the higher the computation load. Additional constraints arc imposed
by the time available for the computation and the financial cost of the system. Image input systems
usually provide a 2-D image, exceptions include line and raster scanned input devices which produce
1-D information, but lines of data arc associated with one another and the overall data set is 2-D.
Some devices such as nuclear magnetic resonance scanners and laser range finders (91.90] produce
3-D or 2.5-D information directly. Processes within the system can produce multidimensional data
sets and other data sets such as knowledge bases will also need to be operated on. Roscnfcld [153]
lists commonly used architectures. The basis of the list is included here with some
additions:-• Single processor systems, these operate on one data byte at a time.
• Multi-processor systems, these operate on several bytes in parallel. A sub-list o f types
follows:-- Pipelined systems. 1follows:--D arrays o f processors performing a sequence of operations on a
stream o f data passing along the array.
- Systolic arrays. One or more dimensional arrays of processors performing the same
operation on every datum in the array [55]. Note, alternative definitions exist.
- Mesh connected systems. 2-D arrays that can perform local operations on the whole
image simultaneously.
- Trees and Pyramids. These can perform global and local kernel operations on the data.
The lowest level processors in the architecture arc associated with small sections of the
image. Groups of these processors communicate upwards with a reduced number of
processors at the next highest level, and so on, until at the highest level a single processor
contains the final result of the image process. A variation of the architecture also allows
data flow in a downwards direction. Such systems are often used for multi-resolution
image processing. Mulii-rcsoiution processing forms a part of Marr's [113] overall
processing framework.
- Hypcrcubcs. These combine the advantages o f m eshes and pyramids. The topology of
the network consists of a Boolean n cube.
- Shared memory machines. Use an interconnection network between the processors and
common memory. They can simulate other architectures.
- Artificial neural networks.
Some of these architectures employ three or multidimensional arrays of processors, but there
is an interconnection limitation with such systems. Gosely packed 3-D arrays of interconnected
neurons exist within the human visual cortex, but it is not possible to effect such interconnections
on integrated circuit devices. Connections arc limited to a 2-D plane. Nudd [130] reports a
compact system using current technology to interconnect a stack o f wafer scale integrated processors.
Each wafer contains an array of 32x32 processors, and typically seven wafers containing different
processor types may be required for a simple image operation. Data is loaded serially into the top
wafer in the stack, processed, and then transferred vertically to the corresponding processor in the
wafer below. It may be possible to make the top wafer a CCD device that could accept direct light
input. With systems for larger, say 512x512 images, the num ber o f interconnections may make
such a stack difficult to implement.
A general purpose computer vision system would be m ost likely to succeed, if implemented
on a highly parallel machine, as these architectures maximise processing rate. From the above
list, pyramid, hypcrcubc and artificial neural networks appear most suitable. However, practical
systems tend to have more modest specifications, and the requirement to be cost effective leads to
implemented systems with a wide variety of architectures.