Doctoral Dissertations Student Theses and Dissertations Spring 2020
Towards efficacy and efficiency in sparse delay tolerant networks
Towards efficacy and efficiency in sparse delay tolerant networks
Douglas John McGeehanFollow this and additional works at: https://scholarsmine.mst.edu/doctoral_dissertations
Part of the Computer Sciences Commons Department: Computer Science
Department: Computer Science Recommended Citation
Recommended Citation
McGeehan, Douglas John, "Towards efficacy and efficiency in sparse delay tolerant networks" (2020). Doctoral Dissertations. 2870.
https://scholarsmine.mst.edu/doctoral_dissertations/2870
This thesis is brought to you by Scholars' Mine, a service of the Missouri S&T Library and Learning Resources. This work is protected by U. S. Copyright Law. Unauthorized use including reproduction for redistribution requires the permission of the copyright holder. For more information, please contact [email protected].
NETWORKS
by
DOUGLAS JOHN MCGEEHAN
A DISSERTATION
Presented to the Graduate Faculty of the
MISSOURI UNIVERSITY OF SCIENCE AND TECHNOLOGY
In Partial Fulfillment of the Requirements for the Degree
DOCTOR OF PHILOSOPHY
in
COMPUTER SCIENCE
2020
Approved by
Sanjay Madria, Advisor Bruce McMillin Venkata S. S. Nadendla
Yanjie Fu
PUBLICATION DISSERTATION OPTION
This dissertation consists of the following three articles, of which two have been published and one is currently under peer review:
Paper I: Pages 37–67 have been published in the 36th IEEE International Conference on Distributed Computing Systems (ICDCS).
Paper II: Pages 68–124 have been accepted for publication to Distributed and Parallel Databases, a journal by Springer.
Paper III: Pages 125–165 has been submitted for publication in Wireless Networks, a journal by Springer.
ABSTRACT
The ubiquitous adoption of portable smart devices has enabled a new way of commu-nication via Delay Tolerant Networks (DTNs), whereby messages are routed by the personal devices carried by ever-moving people. Although a DTN is a type of Mobile Ad Hoc Net-work (MANET), traditional MANET solutions are ill-equipped to accommodate message delivery in DTNs due to the dynamic and unpredictable nature of people’s movements and their spatio-temporal sparsity. More so, such DTNs are susceptible to catastrophic conges-tion and are inherently chaotic and arduous. This manuscript proposes approaches to handle message delivery in notably sparse DTNs. First, the ChitChat system [69] employs the social interests of individuals participating in a DTN to accurately model multi-hop relationships and to make opportunistic routing decisions for interest-annotated messages. Second, the ChitChat system is hybridized [70] to consider both social context and geographic infor-mation for learning the social semantics of locations so as to identify worthwhile routing opportunities to destinations and areas of interest. Network density analyses of five real-world datasets is conducted to identify sparse datasets on which to conduct simulations, finding that commonly-used datasets in past DTN research are notably dense and well con-nected, and suggests two rarely used datasets are appropriate for research into sparse DTNs. Finally, the Catora system is proposed to address congestive-driven degradation of service in DTNs by accomplishing two simultaneous tasks: (i) expedite the delivery of higher quality messages by uniquely ordering messages for transfer and delivery, and (ii) avoid congestion through strategic buffer management and message removal. Through dataset-driven simu-lations, these systems are found to outperform the state-of-the-art, with ChitChat facilitating delivery in sparse DTNs and Catora unencumbered by congestive conditions.
ACKNOWLEDGMENTS
It is quite challenging to give due acknowledgement to all who aided me through this ardruous journey. Of course, I thank Dr. Sanjay Madria and Dr. Dan Lin, my academic advisors throughout my Ph.D., for their vision and guidance on which problems to research and the academic rigor needed to solve them. Beyond academics, the following people deserve recognition: my family, forever providing me unconditional love and support, a warm meal and an in-person visit when needed, and periodic reminders that the end is within sight, even when obscured by seemingly-impenetrable obstacles; my friends: Ashok, Ayan, Brett, Cameron, Dan, Gracie, Himanshu, Jenna, Jess, Jonathan, Katrina, Lauren, Michael, Shudip, and countless others for providing companionship, joyful memories, and an occassional escape from obligations; my pets: Linus, Lucy, Leland, and Isabel, for their warmth on cold nights and snuggles during emotional stress; Dr. Stephen Jackson, for giving me a thread of hope when I felt I had lost it all; Dr. Jeffrey Schramm, for his leadership and judgement-free ear; and all the DJs at KMNR 89.7 FM for the opportunity to lead their organization. No doubt, I have missed individuals who deserve acknowledgement. Just know that I feel indepted to you regardless of whether your name is listed here.
I dedicate this dissertation to the loving memory of my two dogs, Linus (2010–2016) and Lucy (2008–2019).
TABLE OF CONTENTS
Page
PUBLICATION DISSERTATION OPTION . . . iii
ABSTRACT . . . iv
ACKNOWLEDGMENTS . . . v
LIST OF ILLUSTRATIONS . . . xi
LIST OF TABLES . . . xiii
SECTION 1. INTRODUCTION . . . 1
1.1. APPLICATIONS . . . 1
1.1.1. Disaster Communications . . . 1
1.1.2. Ad Hoc Battlefield Communications . . . 2
1.1.3. Offloading Traffic from Overloaded Networks . . . 2
1.1.4. Floating Content . . . 2
1.1.5. Network Connectivity for Developing Communities . . . 3
1.2. CHALLENGES WITH MANET SOLUTIONS . . . 4
1.3. CHARACTERISTICS OF DTNS . . . 5
1.3.1. Temporal Model of a DTN . . . 8
1.3.2. Requirements for Successfully Delivery . . . 9
1.4. PERFORMANCE METRICS . . . 11
1.4.1. Delivery Ratio . . . 11
1.4.3. Delivery Delay . . . 12
1.4.4. Overhead Ratio . . . 12
1.4.5. Caveats of Metric Interpretations . . . 13
2. LITERATURE REVIEW . . . 14
2.1. PROPOSED SOLUTIONS TO DTN ROUTING . . . 14
2.1.1. Centrality . . . 14
2.1.2. Communities . . . 17
2.1.3. Friendship . . . 22
2.1.4. Social Interests and Profiles . . . 24
2.1.5. Geographic Routing . . . 26
2.2. SIMULATING DTNS . . . 29
2.2.1. Contact Traces . . . 29
2.2.2. Synthetic Mobility Models . . . 31
2.2.3. GPS Trajectory Datasets . . . 33
2.3. UNADDRESSED PROBLEMS . . . 34
2.3.1. The Unaddressed Challenges of a Sparse DTN . . . 35
2.3.2. Congestion and Network Degredation . . . 36
PAPER I. CHITCHAT: AN EFFECTIVE MESSAGE DELIVERY METHOD IN SPARSE POCKET-SWITCHED NETWORKS . . . 37
ABSTRACT . . . 37
1. INTRODUCTION . . . 38
2. CHITCHAT ARCHITECTURE AND ROUTING PROTOCOLS . . . 42
2.1. PROBLEM STATEMENT . . . 42
2.3. REAL-TIME TRANSIENT SOCIAL RELATIONSHIP MODELING 45
2.4. CHITCHAT ROUTING PROTOCOL. . . 51
3. PERFORMANCE EVALUATION . . . 54
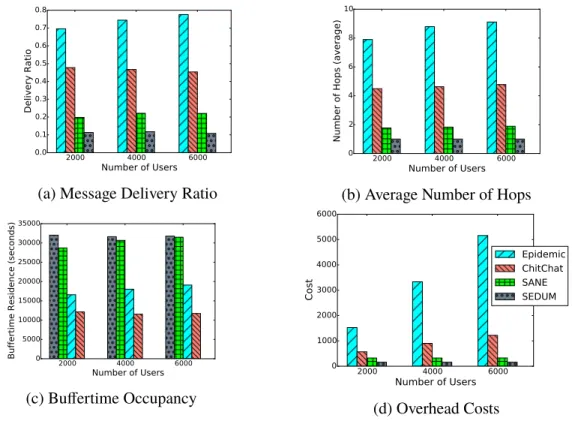
3.1. EFFECT OF THE NUMBER OF USERS IN THE NETWORK . . . 56
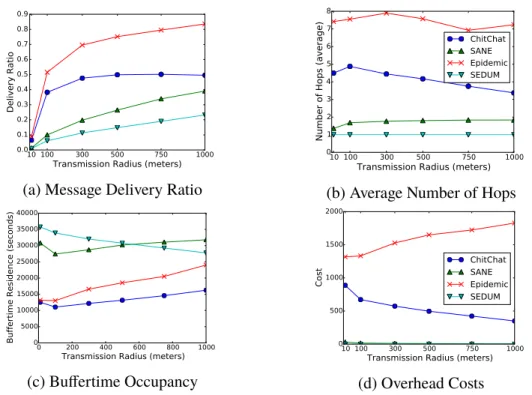
3.2. EFFECT ON TRANSMISSION RANGE. . . 58
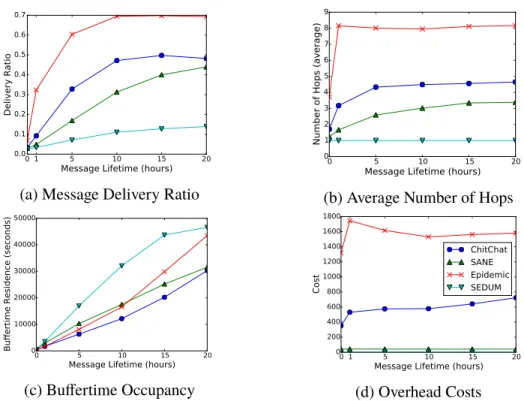
3.3. EFFECT OF MESSAGE LIFETIME . . . 60
3.4. EFFECT OF SOCIAL INTERESTS DISTRIBUTION . . . 61
4. RELATED WORK . . . 62
5. CONCLUSION . . . 64
ACKNOWLEDGEMENTS . . . 65
REFERENCES . . . 65
II. EFFECTIVE SOCIAL-CONTEXT BASED MESSAGE DELIVERY USING CHITCHAT IN SPARSE DELAY TOLERANT NETWORKS . . . 68
ABSTRACT . . . 68
1. INTRODUCTION . . . 69
2. CHITCHAT ARCHITECTURE AND ROUTING PROTOCOLS . . . 74
2.1. PRELIMINARY DEFINITIONS . . . 75
2.2. OPPORTUNISTIC GEOGRAPHIC SOCIAL HEATMAP MOD-ELING . . . 79
2.3. OPPORTUNISTIC TRANSIENT SOCIAL RELATIONSHIP MOD-ELING . . . 83
2.4. CHITCHAT ROUTING PROTOCOL. . . 94
3. PERFORMANCE EVALUATION . . . 98
3.1. SPARSITY ANALYSIS OF REAL-WORLD DATASETS . . . 101
3.2. EFFECT OF THE NUMBER OF USERS IN THE NETWORK . . . 105
3.3. EFFECT ON TRANSMISSION RANGE. . . 108
3.5. EFFECT OF SOCIAL INTERESTS DISTRIBUTION . . . 111
3.6. DELIVERY LATENCIES . . . 112
4. RELATED WORK . . . 113
4.1. ROUTING STRATEGIES FOR DTNS . . . 113
4.2. INTRINSIC DENSITY OF PREVIOUSLY EVALUATED DATASETS116 5. CONCLUSION AND FUTURE WORK . . . 118
5.1. PRIVACY OF USER SOCIAL INTERESTS . . . 119
ACKNOWLEDGEMENTS . . . 120
REFERENCES . . . 120
III. CATORA: CONGESTION AVOIDANCE THROUGH TRANSMISSION OR-DERING AND RESOURCE AWARENESS IN DELAY TOLERANT NET-WORKS . . . 125
ABSTRACT . . . 125
1. INTRODUCTION . . . 126
2. RELATED WORK . . . 129
2.1. MODELING CONGESTION. . . 129
2.2. CONGESTION AVOIDANCE AND CONTROL . . . 130
2.3. BUFFER MANAGEMENT . . . 131
3. FORMAL DEFINITIONS AND ARCHITECTURE . . . 134
3.1. DELAY TOLERANT NETWORK ARCHITECTURE . . . 134
3.2. MESSAGES . . . 135
3.2.1. Message Path . . . 136
3.2.2. Message Copy Count . . . 137
3.3. CHALLENGES OF MESSAGE DELIVERY IN DTNS . . . 137
4. CONTRIBUTING FACTORS TO CONGESTION . . . 138
4.1. SIMULATION SETUP . . . 140
4.3. ANALYSIS OF CONGESTION . . . 143
5. THE CATORA SYSTEM . . . 144
5.1. MESSAGE DELIVERY ORDERING . . . 146
5.2. MESSAGE TRANSFER ORDERING . . . 146
5.3. STORAGE BUFFER MANAGEMENT . . . 147
5.4. THE CATORA PROTOCOL . . . 149
5.4.1. Behavior At Connection Establishment . . . 149
5.4.2. Behavior At Message Transfer . . . 150
5.4.3. Behavior At Buffer Congestion . . . 151
5.4.4. Behavior At Connection Drop . . . 152
6. PERFORMANCE EVALUATION . . . 152
6.1. CONGESTION AVOIDANCE . . . 155
6.2. QUALITY OF SERVICE . . . 156
6.3. RESOURCE CONSUMPTION. . . 158
7. CONCLUSION AND FUTURE WORK . . . 161
REFERENCES . . . 161 SECTION 3. CONCLUSION . . . 166 4. FUTURE WORK . . . 168 4.1. PRIVACY. . . 168 4.2. INCENTIVIZATION . . . 169 4.3. MACHINE LEARNING . . . 169 REFERENCES . . . 170 VITA . . . 183
LIST OF ILLUSTRATIONS
Figure Page
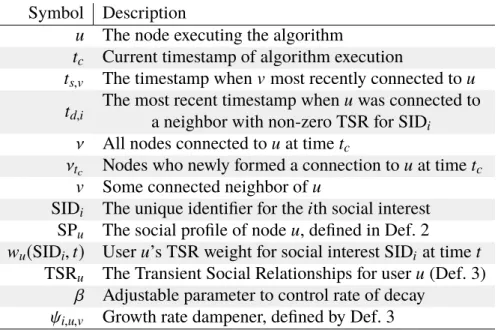
2.1. Illustrative example for calculating the Relative Social Pressure Metric (RSPM)
from [10] based on historic contact information. . . 21
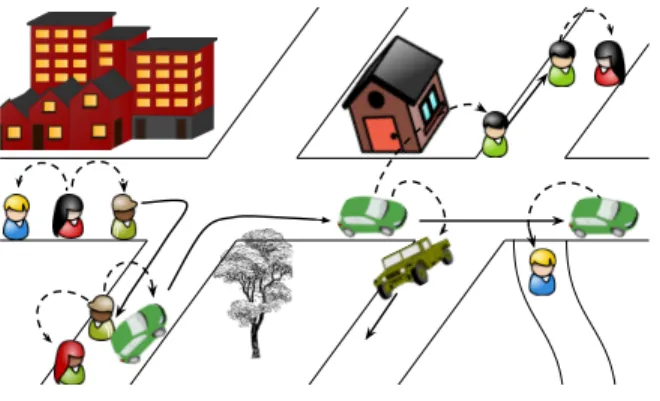
PAPER I 1. An example of a Pocket Switched Network. . . 38
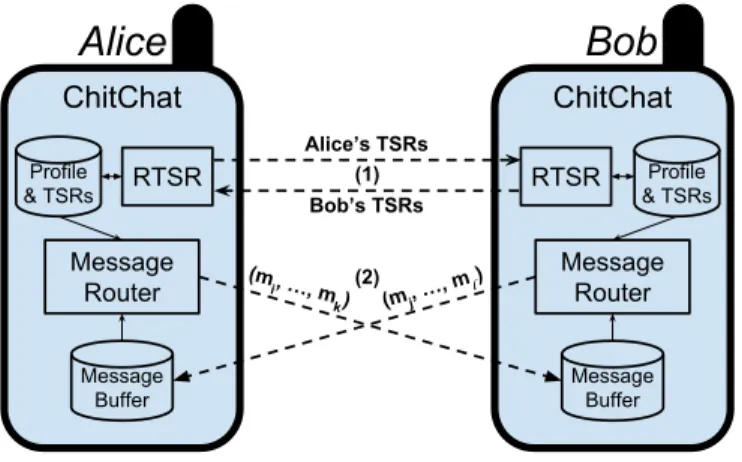
2. Architectural diagram of the ChitChat system within each node. . . 44
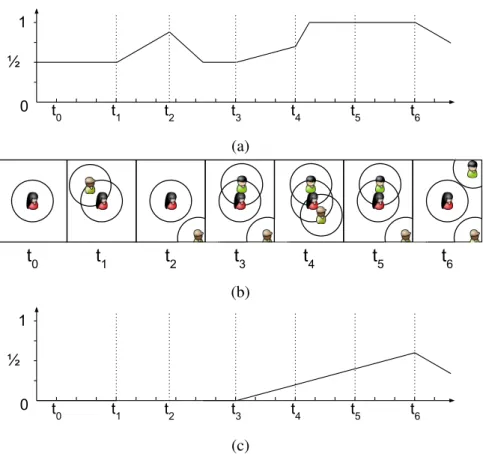
3. Illustrative example for calculating a Transient Social Relationship (TSR) given connections and disconnections. . . 49
4. Effect of user participation on performance . . . 57
5. Effect of transmission radius on performance. . . 59
6. Effect of message lifetime on performance. . . 60
7. Effect of the number of social interests per user. . . 61
PAPER II 1. An example of a Delay Tolerant Network. . . 70
2. Architectural diagram of the ChitChat system within each node, employing Opportunistic Geographic Social Heatmaps, Opportunistic Transient Social Relationships, and the Message Router. . . 75
3. Illustrative example of opportunistic Geographic Social Heatmap (GSH) merging. 82 4. An example of the growth and decay of a Transient Social Relationship caused by connections and disconnections with others. . . 90
5. Network densities of the DTNs formed by five datasets: INFOCOM06, MIT Reality Mining, SIGCOMM09, Microsoft’s Geolife, Nokia’s MDC. . . 104
6. Effect of user participation on performance. . . 105
7. Effect of transmission radius on performance. . . 106
8. Effect of message lifetime on performance. . . 109
9. Effect of social profile sizes on performance. . . 111
PAPER III
1. Quality of Service for Synthetic (left), SIGCOMM 2009 (middle), and
INFO-COM 2006 (right) . . . 142 2. Congestion Symptoms for Synthetic (left), SIGCOMM 2009 (middle), and
INFOCOM 2006 (right) . . . 143 3. Congestion Symptoms for SIGCOMM 2009 (left) and INFOCOM 2006 (right) . 153 4. Quality of Service for SIGCOMM 2009 (left) and INFOCOM 2006 (right). . . 157 5. Resource Consumption for SIGCOMM 2009 (left) and INFOCOM 2006 (right) 159
LIST OF TABLES
Table Page
PAPER I
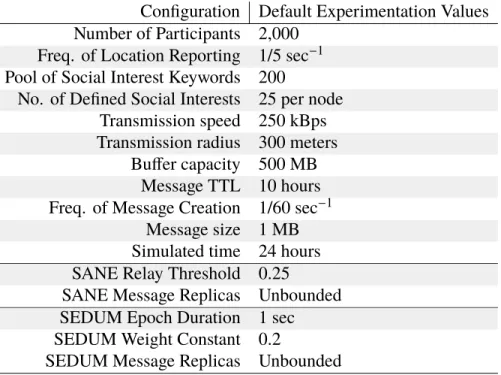
1. Table of Symbol Descriptions . . . 50 2. Default Experimental Settings . . . 55 PAPER II
1. Default Experimental Settings . . . 102 2. Summary of Dataset Usage and Density of DTN Routers . . . 117 PAPER III
1. Catora Symbology . . . 145 2. Catora Simulation Configurations . . . 154
1. INTRODUCTION
Smartphones have become a new accessory for many individuals, carried inside pockets and purses everywhere their owner goes. Forecasts predict that, by 2024, approxi-mately 8.4 billion smartphones will be online, with an estimated 92% of the world’s popula-tion having mobile broadband coverage to drive further adoppopula-tions of these devices [32]. This overwhelming distribution of wirelessly-connectable mobile devices has garnered interest from researchers seeking novel approaches to capitalize on their abundant availability. One particular area of interest investigates how to establish a network between only these smart-phones, carried around by people, without relying on a connection to the Internet. Such a network has been interchangeably referred to by several names in research literature, such as a Delay/Disruption Tolerant Network [119, 120] (used in this report, abbreviated DTN), Mobile Opportunistic Network [3, 66, 111, 128], Intermittently Connected Networks [104], Pocket Switched Network [71, 108, 124], and so on. Within this network, the establishment of connections between nodes is dictated by people’s mobility over time; when two nodes come within close proximity to each other, their devices are able to wirelessly connect. There are plenty of interesting applications that are possible in such an environment, as is detailed in the following subsections.
1.1. APPLICATIONS
1.1.1. Disaster Communications. Natural and man-made disasters can severely
damage or completely destroy an area’s communication infrastructure, preventing a timely and coordinated response from rescue personnel [6, 76, 89]. It takes time to roll out a
temporary infrastructure – time which may be crucial in preventing further loss of life. With people already carrying smartphones, an emergency network could activate to immediately begin the retrieval and distribution of information. Examples of disaster-related information may pertain to severity of building damage, the location of isolated and injured people, or the contamination of air and water supplies.
1.1.2. Ad Hoc Battlefield Communications. An active battlefield is hardly a place
to expect a secure and reliable communication infrastructure [4]. Strategic movements and enemy attacks require that any sort of communication infrastructure have protection, redundancy, and mobility to enable communication. Military vehicles, having electricity produced from diesel/gasoline engines, may act as mobile base stations to receive and transmit information about the situation at hand. Foot soldiers are able to move away from these vehicles to closer examine a point of interest, gather intelligence, and disseminate orders or warnings. By equipping soldiers with wirelessly-communication devices and visual, audio, and environment sensors, the turn-around between intelligence gathering and strategic response can be greatly reduced.
1.1.3. Offloading Traffic from Overloaded Networks. Locations where many
people crowd together can overwhelm a wireless base station for that area. This can happen in both urban areas – e.g. San Francisco [115] – and rural areas – e.g. outdoor-oriented Music Festivals [51]. One option to alleviate such overloading is to provision more infrastructural resources to that area. This approach may not be economically feasible, though, due to the transient nature of such overloading events. In these areas, locally relevant information does not need Internet connectivity for successful distribution. Instead, information such as venue programming changes and emergency alerts can be distributed in a peer-to-peer fashion between the devices in that area [110, 122].
1.1.4. Floating Content. Geosocial network applications such as Tinder and
Air-Drop provide users with content and social connection opportunities specifically relevant to their geographic location. However, these applications require an Internet connection to
retrieve such content, and mobile devices must report their location to submit and retrieve content for their area. This approach opens up the possibility of location spoofing as a means of accessing content without the user being in the area. One way to maintain the locality and isolation of such information is to deploy it as floating content, where data is physically located in the location where it is relevant [28, 74]. Content can be stored in stationary dropboxes (e.g. a WiFi router equipped with adequate long-term storage) or virtual dropboxes, where the content is exchanged between and cached within devices en-tering and leaving an area. This method of content posting and retrieval permits devices to exchange content only when a direct connection can be made with a dropbox, thus requiring nearby proximity. The content is said tofloat in that particular area, adding a new aura of experience and entertainment to that area.
1.1.5. Network Connectivity for Developing Communities. In some
environ-ments, it is economically infeasible to provide an Internet connection through the instal-lation of necessary infrastructure [37]. Such environments could be rugged and hostile settlements (e.g. camps leading to the peak of Mount Everest), widely distributed low-density population centers – e.g. scattered villages in rural South Africa [34] – along rivers for pollution monitoring [107] – and deep within the wilderness for animal tracking [99]. These areas may still benefit from Internet connectibility, even if the latency for delivery is orders of magnitude longer than what is available in more developed regions. Assuming a stream of people are arriving and leaving the area, each traveler can act as a carrier for content requests and delivery, thus providing connectivity at a significantly lower cost than dedicated infrastructure. In a sense, this approach would mimick a local library in terms of content requests and delivery delays, which was the source of knowledge for several millenia before the invention of the Internet.
1.2. CHALLENGES WITH MANET SOLUTIONS
Considering these applications, one may question whether solutions for Mobile Ad Hoc Networks (MANETs) could be adopted. A MANET is characterized as a set of communication-able nodes, each with its own ability of movement, deployed to serve some networking functionality that would otherwise be cost prohibitive for traditional infrastructure installation. Indeed, a Delay Tolerant Network is a specialization of the more generic MANET definition. However, the solutions proposed to provide MANET functionality are not practical in a DTN environment based on their implicit assumptions.
Consider, for example, on-demand routing protocols for MANETs – e.g. AODV [75], DSR [50]. When a message is generated at a source node for some destination, the first step of an on-demand routing protocol is to discover a path to the destination. This is accom-plished in three phases: route request, route reply, and route maintenance. When there is no known path to the destination, the source will begin the process of discovering a route by contacting its neighbors, who contact their neighbors, and so on until the destination is located. Once the destination is found, a reply is generated to notify the sender of the route, following the reverse path of the request. This reply also provides a caching opportunity to all other nodes receiving the reply, who may record the path for later use. However, due to the mobility of participating nodes, the topology of the network may change, rendering some cached routes obsolete. When this happens, route maintenance occurs, allowing for the network to self-heal and for cached routes to be updated, albeit at the cost of additional overhead.
In order for route request and route reply to work, it is implicitly assumed that the path between the source and the destination will last long enough for (1) route discovery to reach the destination, (2) a route reply to backtrack back to the source node, and (3) the message to traverse through the path. Once it is known, the nodes along the path will receive the message and pass it along without any concern of long-term queuing/storage. This is a tough requirement to achieve for a network composed of smartphones carried by people.
The communication range of these devices is limited by their antenna length, government regulations on their transmission power, and the available battery capacity. In order for a DTN to be instantaneously connected requires a sufficient density of people. However, the mobility of these participants may rapidly change the topology of the network, rendering path discovery useless before any of its phases are complete. In reality, the network is more likely to be highly partitioned with many disjointed, small connected subgraphs scattered across the network’s geographic area. As a result, messages may need to be stored until such a time as a bridge between connected subgraphs is formed. Simply put, past MANET solutions are crippled by the amplified mobility and network disconnections of a DTN.
Because of these challenges, solutions for a DTN must embrace and exploit the nature of human mobility, acknowledge the technological limitations of smartphones, and tolerate unpredictable, long delays for message delivery, and limited knowledge. This manuscript seeks to explore how researchers have dealt with such issues, provides an understanding of what remains to be addressed, and proposes our own solutions for accommodating message delivery in sparse DTNs.
1.3. CHARACTERISTICS OF DTNS
Delay Tolerant Networks are differentiable from other network architectures by the more frequent occurrence of disconnections between established channels of two nodes. Many other network types are often assumed to have some sufficient degree of stability and availability of communication channels between nodes; DTNs make no such assumption. Communication between nodes in a DTN may fluctuate more aggressively through time than what would be expected in other networks.
DTNs are derived from the more general Opportunistic Network (ON), which is itself derived from the more general Wireless Ad-hoc Network (WANET). The primary difference between DTNs and other ONs is the primary cause of connections and disconnections:
mobility. When two people move to become sufficiently close1, a connection between their devices may be formed to open a channel for communication. Likewise, when they move away from each other, communication ceases. These connections and disconnections are opportunistic, implying that their formation and destruction has some degree of stochasticity and some degree of chaos, introducing uncertainty in predicting their occurrence. ONs are seperated from the more general WANETs by the degree to which uncertainty prevents connection predictability. The following two examples illustrates how a DTN may be different from some other type of ON/WANET.
Example 1: A network composed of polar-orbitting satellites and grounded
re-ceivers will have connections established due to a satellite passing through the portion of its orbit in the sky above the receiver. Disconnections occur due to the satellite progressing beyond the line-of-sight of the receiver or due to obstructions such as large buildings or underground tunnels. Thus, in order to accomplish network functionality, participating nodes should expect to store data for some period of time until the next connection will occur. Likewise, applications using this data should expect extended delays in its delivery. Although this network is a ON, it would not strictly be considered a DTN due to the avail-ability of a contact plan – i.e. the guaranteed recurrence of connections at known intervals. The strong predictability of connections and disconnections allows for many important networking metrics to be calculated with increased certainty, such as the expected delay of data delivery, the transmission speed of the established channel, the theoretical upper bound on the channel’s capacity, and an upper bound on necessary queuing storage.
Example 2: A network composed of wirelessly-connected mobile devices, carried
by people, will have connections established due to two people coming within close prox-imity. Disconnections primarily occur when the two people move away from each other. Due to the unpredictable nature of human mobility, it is unknown when and for how long two nodes will be within communication range of each other. This prohibits a node from
knowing how long it must store a message. Likewise, if a node does not know which other node it will connect with next, it also cannot know if a path to the destination will even exist to the destination. This network is an ON because it relies on opportunities to achieve network functionality, and further is considered a DTN due to the aforementioned uncer-tainties. When a connection opportunity arises, a message-holding node must determine if it will use this opportunity to forward its message to the encountered node.
These two examples highlight characteristics that can be used to differentiate one type of Delay Tolerant Network from another, as well as differentiating one type of Oppor-tunistic Network from another. Example 1, for instance, has intrinsic predictability of when future connections will be formed. A schedule for message transmissions can be computed based on the satellite’s orbital model, and resource allocation can be planned in advance of network deployment. By being able to predict future connections, the method of construct-ing delivery paths becomes a problem modeled by the quickest trans-shipment problem [33] or a mixed integer linear program [113, 135], which would allow traditional networking protocols to be trivially modified. Example 2, on the other hand, does not have such a luxury of predictibility due to human mobility. Fall [33] enumerates four types of DTNs with different characterizations of the causes of frequent interruptions: Terrestrial Mo-bile Networks, Exotic Media Networks, Military Ad-Hoc Networks, and Sensor/Actuator Networks. Each of these network types may be further classified by the predictability of interruptions (e.g. a Terrestrial Mobile Network of buses has symmetry and predictabil-ity due to fixed routes, whereas one of taxis has no guarantee of repetitive or predictable motion) and in the directionality of communication (e.g. military communications with a submarrine may only be one way due to its covert radio silence). In this manuscript, the focus is on reviewing recent advancements in Terrestrial Mobile Network characterised by opportunistic and unpredictable connections.
1.3.1. Temporal Model of a DTN. The traditional modeling of networks as graphs
requires augmentation to accurately describe a DTN [16]. Instead of a graphG = hV,Ei representing the network, a Time-Varying Graph (TVG) G = hV,E,T, ρ, ζi is required, whereVis the set of nodes;T ⊆Tis a timespan within the temporal domainTrepresenting the lifetime of the network;Eis the set of edges representing network connections that exist at some time instant duringT; ρ : E × T → {0,1} is a presence function that indicates whether a given edge exists at a given time instant; and ζ : E × T → T is a latency function that indicates the time duration needed to traverse the given edge starting at the given timestamp. The state of connectivity of the network depends on the locations of individuals at a given time. The set of edges {e |e ∈E, ρ(e,t0)=1}, denoting the edges
in the network at timet0, may be considerably different when compared to the set of edges
{e | e∈ E, ρ(e,t1)=1}at some other timet1 > t0. Betweent0andt1, people have moved,
connections have been broken, and new connections have been formed. Thus, the topology of the network could be radically different at different periods of time.
To accomplish message delivery in a DTN, the definition of a path between two nodes uand v is often insufficient due to the scarsity of contemporaneous connections between nodes. Here, a path is defined as a sequencePu,v = (e1= {u,w
0},e
2, ...,eω = {w
00,v}) , such that:
• The nodes for each edge are nodes in the graph – i.e. u,w0,w00,v ∈V
• Each edge of the path is an edge in the graph – i.e. ∃ei ∈E ∀ei ∈Pu,v
• Each pair of consecutive edges shares a common node – i.e.
Rather, a journey connects two nodes through multiple hops that span time, and at each time instant the multi-hop path between the nodes is not necessarily connected. Formally, a journeyJu,vinGis a sequence of timestamped edges
Ju,v = he1 ={u,w0},T1= (ts 1,t e 1)i,he2,T2i, . . . ,heω,Tωi such that:
• The nodesuandv are on the first and last edges, respectively – i.e. u∈e1,v ∈eω
• Each edge is connected during the defined time duration – i.e. ρ(ei,t)= 1∀t ∈ Ti
• An edge along the journey is open sometime after the previous edge – i.e.
tis+ 1 ≥t s i +ζ(ei,t s i)for all 0<i < ω.
Letm = htc,td,payloadibe a message, wheretc ∈ T is message’s creation time, tk ∈ T,td > tcis the time when the message is no longer useful, andpayloadis the content of the message. A messagem is deliverable from a node u to another node v through G if and only if there exists a journey Ju,v such that the message is created before the first connection ends and expires after the last connection begins – i.e. tc <t1dandtd > tks.
1.3.2. Requirements for Successfully Delivery. In order for a message to pass
through a DTN, each node must adopt the store-carry-forward paradigm of message delivery and make best-effort decisions for routing. In this paradigm, a node stores a message in its buffer, carries it as it moves about, and, upon encountering a neighbor, decides whether to forward the message. This process brings about several bottlenecks.
• Buffer space: How much buffer space is available in each node to carry these
messages? This attribute depends on the size of each message, the frequency at which messages are created, the duration of time a message is carried until it is dropped, and the aggressiveness of nodes forwarding messages to encountered neighbors.
• Channel capacity:How much channel capacity is available when two nodes connect with each other? This attribute depends on the power consumption, duration of time two nodes are connected, the distance between two nodes, and the overhead of the protocol used for communication.
• Battery capacity: How much energy does a node have to dedicate to wireless
transmissions? Smartphones are not solely used to relay messages between other devices, and it would otherwise be undesirable if a phone’s battery was depleted in doing so.
• Delivery delay: How much time will the recipient(s) of a message have to wait
until it is delivered? This depends on many complex factors, a few of which are the geographic distance between the source and the destination, the number of participants in the network, and the amount of time each relay must carry the message before forwarding it on further to the next worthwhile neighbor.
Several forwarding strategies have been adopted by proposed solutions for DTNs. Some schemes will simply push a message to all encountered neighbors not already carrying a message. These strategies are known as flooding schemes. Although one may think this approach would be able to provide the highest guarantee of delivery in a DTN, this approach runs this risk of triggering network congestion [49].
Another strategy is to have nodes make calculated decisions on to whom a message should be forwarded, whether it be single-copy forwarding (i.e. at most one copy of a message resides in the network at any time) or a multi-copy forwarding (i.e. when a node forwards a message to a neighbor, it retains a copy for future forwarding opportunities). Implicitly, this strategy requires a node to have some knowledge on which to base its decision. Without the availablility an Internet connection nor contemporaneous paths, knowledge of the global state of the network is unavailable to each node. This prohibits nodes from computing optimal routing plans; instead, the knowledge available to each node is limited
to that it has learned and stored locally or that it can learn from its connected neighbors. However, this stored knowledge must be accurate to some degree. If this knowledge pertains to currently open connections in the network, it can quickly become stale due to frequent changes in network topology. If it pertains to predicting future connections, there is a chance the future connection will not occur. Thus, if a node is to rely on local knowledge within itself and its neighbors, knowledge recording mechanisms must be designed in such a way that can indicate whether an encountered neighbor is a worthwhile candidate. Section 2.1 details how recent proposals have designed such mechanisms.
1.4. PERFORMANCE METRICS
In order to evaluate the effectiveness of a proposed DTN routing scheme and make comparisons between other schemes, it is important to understand certain performance metrics. In their surveys on DTNs, Abdelkader et al [2], Cao and Sun [12], and Liu et al [65] describe three metrics (defined below) that are commonly used in DTN routing simulations: (1) delivery ratio; (2) delivery latency; and (3) overhead ratio. In addition to these three, hop counts have also been demonstrated as an important metric to optimize [1, 125]. These metrics are important for evaluating DTNs and many past proposals have used them to compare their contribution against other state-of-the-art approaches.
1.4.1. Delivery Ratio. Whennmessages are created for dissemination in a DTN,
andr messages are successfully delivered, then thedelivery ratiofor the given experiment is rn. A higher delivery ratio indicates more messages were able to reach their destination.
1.4.2. Hop Count. The hop count, also called the path length, of a delivered
message is defined as the number of nodes that relayed a message over the first journey that reached the message’s destination. For ther messages that are successfully delivered, the reported metric is often the average number of edges in the delivering journey for each. For single-copy forwarding schemes, the hop count of a delivered message is approximately proportional to the amount of power consumed to deliver the message. For multi-copy
forwarding schemes, the propagation pattern forms a tree with the source as its root. The hop count for multi-copy forwarding schemes is the distance from the root node to the destination node, which only accounts for a subset of the number of forwards.
1.4.3. Delivery Delay. Assume that r messages are successfully delivered in a
DTN. For each message mi of the r delivered messages, let ∆ti be the duration of time between messagemi being created and it arriving at its destination. The average delivery delayfor the experiment is defined as
1 r r Õ i=1 ∆ti
Should all messages pass along their globally optimal paths of earliest arrival time, then the average delivery delay is optimal as it implies all messages were delivered as fast as possible within the simulated network.
1.4.4. Overhead Ratio. DTNs are derived from the more general Opportunistic
Network (ON), which is itself derived from the more general Wireless Ad-hoc Network (MANET). For multi-copy forwarding schemes, the overhead ratio gives an idea of the resource costs that are needed to successfully deliver messages, and only applies to multi-copy strategies. When a message m is forwarded from a node s to its neighbor t, an additional copy of m is created, thus occupying additional buffer space and consuming power for transmission. These resources are non-renewable; regardless ifmis successfully delivered, the resources consumed to disseminate m throughout the network have been consumed.
Assume that n messages are created in a DTN. For each message mi of the n messages, letcibe the number of times messagemi was forwarded through a channel. The overhead ratiofor the experiment is defined as
1 n n Õ i=1 ci
An overhead ratio of 1 is optimal for minimizing resource consumption. It implies all delivered messages were delivered in only one hop on a channel between the source node and the destination node. Typically, an overhead ratio is expected to be > 1, and a comparison between two routing algorithms, all other factors remaining equal, would have the router with the lesser overhead ratio being favored2.
1.4.5. Caveats of Metric Interpretations. The above-mentioned metrics may
con-flict with one another when evaluating a DTN forwarding scheme. For instance, assuming the absense of network congestion, a flooding approach is able to achieve both an optimal delivery delay and delivery ratio in a DTN at the cost of increased overhead. Overhead can only be reduced by preventing some nodes from using an opportunistic connection with a neighbor to pass along a message. By placing restrictions on which connections to use, a lower delivery ratio and an increased delivery delay is to be expected. It is thus important that, when interpretting and comparing results, one metric should be allowed to vary while all other metrics are held stationary. For example, if two schemes are able to achieve the same delivery ratio, then the scheme with the lower overhead ratio or the lower average delivery delay is favored. Determining which performance metric is favorable, however, depends on the application specifications.
2Favoring the router that consumes less resources is typical, but not absolute. Some routing strategies are more favorable because of their reduced latencies or increased delivery ratios, albeit at the cost of consuming more resources.
2. LITERATURE REVIEW
2.1. PROPOSED SOLUTIONS TO DTN ROUTING
In this section, the state-of-the-art DTN solutions are categorized and briefly de-scribed. The focus here is to detail what types of knowledge has been demonstrated as useful for DTNs, and how this knowledge is gathered within the confines of a DTN to en-able nodes to make informed forwarding decisions. One area of focus has looked into topics from social network analysis, such as centrality (Section 2.1.1) and community detection (Section 2.1.1). Another draws from online social networks, using a node’s explicit friend list (Section 2.1.3) and social profiles (Section 2.1.4) to bootstrap network functionality without waiting for opportunistic training to complete.
2.1.1. Centrality. Centrality is a measurement tool originating from graph theory
and social network analysis [23]. It provides a scalar measure of how important a node’s presence is in its network. There are many flavors of centrality that have been proposed, each providing a different point of view of a node’s importance. Degree centrality measures the number of direct links made to a particular node. In an opportunistic network, a node with a high degree centrality is one that is characterised with having contacted many other nodes, whereas one with a low degree centrality would be a characteristic of a recluse. Closeness centrality reflects the distance between a node and all other nodes in the network based on the shortest paths connecting the two. Nodes with a high closeness centrality are said to be able to contact other nodes quickly, while nodes with low closeness centrality must rely upon long paths in order to reach others in the network. Betweenness centrality for a node measures the number of times the node falls on the shortest paths between two
other nodes in the network. When considering information flows within the network, a node’s betweenness centrality indicates how influential that node is in facilitating the flow of information if it is assumed that information always flows through a shortest path.
A DTN-appropriate variation on the betweenness centrality is proposed by Zhang et al [128], which specifically targets a specific pair of nodes – e.g. a message carrier and the destination of the message – instead of just a single node. For a given pair of nodes s and d, the destination-aware betweeness centrality is calculated as the sum of ratios of the number of shortest journeys passing throughsand ending atdover the total number of shortest paths ending atd.
Probabilistic centrality is investigated by Wu et al [118], where they propose the reachability probability centrality between two nodes. This metric considers the probability that two nodes are reachable over journeys of any length from 1 to k. This is built on the baseline probability of a direct contact, as calculated from ratio of the average contact rate between two nodes over the sum of averages across all pairs of nodes.
With many centrality metrics to draw upon, some researchers have questioned which serves a more effective role in facilitating DTN routing. Socievole et al. [98] investigated how degree centrality, eigenvector centrality, and egocentric betweenness centrality affected the performance of their proposed router. Their findings show that degree centrality pro-vided better delivery ratios, followed closely by a properly tuned eigenvector centrality. Betweenness centrality, however, performed the worst out of their simulations. Although it performed worst, small networks have it performing better than large networks.
Degree centrality is calculated in BUBBLE Rap [42], where a messagebubblesup through the network reaching more popular nodes until it enters the destination’s commu-nity. Once there, the forwarding strategy shifts its focus from global degree centrality to community-centric degree centrality (i.e. degree centrality with nodes of that community). Hui et al. postulate that a node’s popularity within its community is a more effective metric for reaching a message’s destination than the node’s global popularity when the node shares
a community with the destination. In order for each node to know its popularity, each computes two centrality metrics for themselves: a local community-focused centrality and a global centrality.
Rango et al [83] extend this idea by computing node centrality using different inputs and adding time variability. This centrality metric, called the Fused Online and Offline Centrality (FOOC), is computed by considering both measurements on opportunistic contacts in the DTN as well as explicit social-ties founds in online social networks. This metric varies across certain time windows, allowing it to fluctuate based on changes in a node’s sociability through time. Additionally, the influence of DTN and online contacts on a node’s FOOC can be tweaked in real-time based solely on the node’s local information. When a node recognizes that it is not meeting many others, it will put less emphasis on its online contacts and more emphasis on the nodes it directly meets.
Another approach to proposing a centrality suitable for DTNs is proposed by Zhou et al [136]. Similar to FOOC, the time-ordered cumulative neighboring relationship (TCNR) centrality is computed by analyzing a node’s connectivity in the network at consecutive time-frames in the network’s operation. However, it differs significantly by considering multi-hop journeys as part of its computation, whereas previous DTN-applied centrality metrics have only considered direct, single-hop encounters. The TCNRs of each node is calculated based on the average and variability of time durations between contacts with all other nodes in the network during specific time windows, whether the contacts be direct or through journeys. Each of the centralities for each time window is then aggregated to produce a single scalar value. Zhou et al propose three such aggregation methods: (i) averaging the centralities, (ii) a linear-decay weighing of the centralities, and (iii) an exponential-decay weighing of the centralities. The last two methods favor the centralities that occur earlier in the network, and thus offer a better chance to facilitate message delivery.
2.1.2. Communities. Communities are an artifact derived from people’s desire to
socialize [36], and are exploitable for DTN functionality [84]. They are characterised as a tightly-connected group of nodes in a network, with each community having more intracommunity connections than intercommunity connections. This leads to one node having more connections with members of his communities than with nodes outside of his communities. Additionally, a node will more likely have future connections with other members of his community than with members outside. This characteristic lends itself to assisting in the delivery of messages in DTNs; if a message destined for node d can be delivered to some individual who is a member of a community ofd, then the possibility of a successful delivery increases. Indeed, having community information is useful for many DTN schemes, as has been demonstrated in recent investigations [10, 42, 59, 130]. When nodes are aware of communitiy formations and a destination’s membership in these communities, they are able to decide to whom a message should be forwarded when contact opportunities arise. It’s as simple as asking “which communities do you belong to?"
To exploit communities, nodes must first know about their existence, their bound-aries, and their membership. BUBBLE Rap [42] accomplishes this by having nodes explicitly label themselves with one of their affiliated communities. When a message is created in a DTN, its header includes the destination’s ID as well as the communities with which she is a member. This information might be unavailable, as was the case with BUBBLE Rap’s performance evaluation. Centralized community detection was needed, after which labels were explicitly assigned to each node as input for their simulations. Even if people are aware that they are a member of some communities (e.g. a Volleyball team for their interdepartment company games), they may be unaware that they are part of other unconventional communities (e.g. a group of commuters taking the subway to work each morning). Detection of these communities must be performed based on the contact information accumulated by each node’s participation in the network.
In [59], the SEBAR algorithm employs k-clique communities to distribute social energyto nodes, which in turn is used to make routing decisions. The social energy metric is dynamically computed based on the duration of a contact between two nodes, and some of theenergy1 generated is shared with the other nodes residing in their communities. It also exhibits decay in the form of a sliding window average of past and current energy values so as to maintain up-to-date accuracy on a node’s social activity. When considering message forwarding, upon creation of a message, the source caps the number of permitted message copies, with the router halving this amount for each node that receives a copy. A two-phased routing strategy, similar to that of BUBBLE Rap, is adopted based on the location of the message at each juncture. If the message is outside of all of the destination’s communities, the message carrying node forwards the message to its neighbor if the neighbor has a higher social energy. Once the message has reached a node that shares a community with the destination, the second phase only forwards to other nodes also within a community of the destination, specifically to those that are members of communities with higher social activity than the message carrier.
Zhang and Cao [130] consider the temporal relevance of community formation, with an emphasis on detecting the dividing line between multiple communities that are spatially and temporally correlated. They identify two scenarios that may hinder community detection in a time-varying network: false mixture, and false separation. A false mixture of two communities occurs when, through the process of detecting communities in a network, two logically separate communities are merged due to spatial and temporal overlap and common nodes. This may occur on a college campus, for example, when one class is dispersing and the next class is taking their seats. A false separation, on the other hand,
1The authors adopt the termenergyas a quantity produced by a contact between nodes as an analog to the
energy produced by particals colliding in partical physics. It is not to be confused with the impression that a node contact creates actual thermodynamic energy.
is the division of a ground-truth community due to weak member connections. The time-varying nature of DTNs makes community detection through traditional methods, requiring static graph representations of the network, susceptible to improperly divided communities. To accomplish accurate community detection in the disconnected environment of a DTN, Zhang and Cao propose the Contact-burst-based Clustering Method (CCM) for the real-time detection of communities within a DTN. Since contacts are instantaneous (e.g. observing a beacon broadcast from a neighbor), contact observations are merged into a contact burstTB = [ts,te], starting at time ts and ending at time te, if each instantaneous contact is withinλtime units of the next. Contact bursts are then merged to form clusters. Two contact burstsTb1andTb2are merged if (1) they share a common node, and (2) their temporal overlap, represented by the Jaccard similarityS(Tb1,Tb2)over their time durations, exceeds a thresholdγ.
S(Tb1,Tb2)=
|Tb1∩Tb2|
|Tb1∪Tb2|
The merging of clusters requires internode exchanging of cluster information, and continues until the largest similarity between all known clusters cannot exceedγ.
Chen and Lou [19] propose another two-phased Community Aware Routing (CAR) protocol that considers expected encounter rates of nodes and the time-to-live (TTL) of the messages they carry. While a message is outside of the destination’s communities, nodes rapidly try to spread copies of the messages to others such that the new recipient is in a community not yet carrying the message. With each forwarding, the number of replicas that are allocated to the new recipient is devised proportional to the expected number of community contacts of the two nodes within the remaining life of the message. Once the message has arrived within a community containing the destination, a strategy similar to BUBBLE Rap pushes the message copies to nodes with more frequent intra-community contacts. Unlike past systems, though, the system has a contingency for when a node can no longer make additional message copies – i.e. the total number of permissible message
copies has been reached in the network. When this occurs, the single copy of the message is forwarded to whichever node has a higher likelihood of encountering the destination or one of its communities.
With community memberships and time occurrences known with these proposed systems, the periodic recurrence of communities can further be detected to assist with message delivery. If a node can accurately predict the formation of a community within a future time frame, this node can then decide if forwarding a message to another community is worthwhile. When considering a message’s destination, the node carrying the message is aware of the destination’s communities. The node is also aware of the membership lists of these communities and the time in which they meet and ajourn. This information lends itself to calculating the relay capability of one community to another community based on the shared membership between those communities. With this information, a node meeting another node in adjacent communities can decide to forward its message if the communities of the neighboring node have higher relay capabilities to the destination than the current node’s.
These solutions, however, require either centralized computation of community membership and knowledge of predictable node behavior, or a lot of data overhead in order to detect communities in a real-time and opportunistic manner. This overhead adds to an already constrained network environment and leads to the possibility that some nodes may be unable to access up-to-date information for their forwarding decisions. To address this, Bulut et al. [10] propose a community detection and routing system that does not require network-wide distribution of community knowledge. Instead, nodes only need to exchange information with their connected neighbors.
Nodes deployed with Friendship Based Routing [10] construct their communities by considering elapsed time between contacts with other nodes in the network. For each node u, its friendship community Fu is defined as the set of nodes {v1,v2, ...} that meet
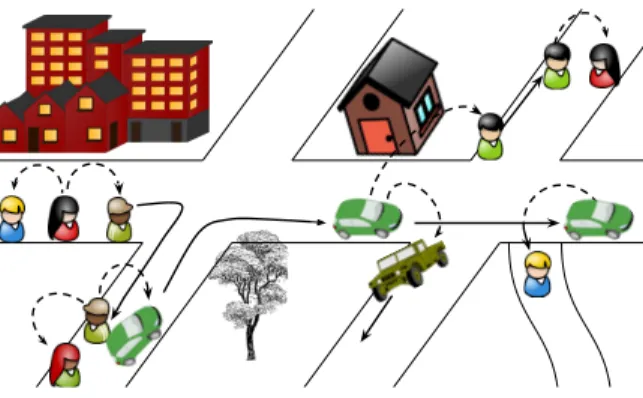
Figure 2.1. Illustrative example for calculating the Relative Social Pressure Metric (RSPM) from [10] based on historic contact information. In this example, nodejwould be calculating RSPMi,k|j based on the interactions withithat immediately precede interactions withk.
(SPM) ofv relative tou, denoted SPMu,v = 1 T ∫ T t=0 f(t)dt
whereTis the time frame in which contacts are considered, and f(t)is how much estimated time remains until nodeu andv will next make contact. If SPM1u,v > τ for some threshold
τ, then v is in Fu. The second condition considers 2-hop contacts. If node v is a friend
of u, and w is a friend of v, then node w and u are friends through v. To capture this, relative social pressure metrics (RSPM) are used, represending the average expected delay of message delivery if a message came fromu, passed throughv, and was destined forw.
RSPMu,w|v = 1 T n Õ x=1 ∫ ta,x 0 (tb,x+ta,x−t)dt
Here,nis the number of times a(v,w)-contact immediately follows a(u,v)-contact during a time frameT. Refer to Figure 2.1 for a visual example ofta,xandtb,x. Of these consecutive-contacts,ta,x is the duration of time between the x-th and(x+1)-th(v,w)contacts, andtb,x
is the time between the(u,v)end and thex-th(v,w)beginning for the x-th pair. For w to be considered an indirect close friend ofu, and thus included inFu, both RSPM1u,w|v > τand
1 SPMu,v > τmust be satisfied. Fu= v| 1 SPMu,v > τ ∪ w| 1 RSPMu,w|v > τand 1 SPMu,v > τ
With these communities known within each node, a node u carrying a message destined for nodedwill hand off its message to a neighbor nodevif and only if (1)vandd are friends (i.e. d ∈ Fv) and (2)vis a closer friend tod(i.e. SPM1u,d < max
1 SPMv,d, 1 RSPMv,d|∗
for any RSPMs involvingvas the source friend).
When timely delivery of messages is important, the time in which a community assembles is crucial for making community-based routing decisions. The above-mentioned Friendship Based Routing [10] did indeed divide historic training data by the time frame in which they occurred. Each friendship communitity is thus time-dependent and stored for later querying. Thus, a node carrying a message can ask a connected neighbor which communities they are members of, and make a forwarding decision knowing the receiving node will likely meet the destination before the message expires.
2.1.3. Friendship. As social beings, people form strong friendships that result in
regular encounters and longer times spent within close proximity. These traits are desirable when messages are being forwarded in a DTN. If a node is friends with the destination of a message, which is carried by someone they encounter, the exchange of the message to the destination’s friend would intuitively strengthen the possibility of successful delivery. Several investigations have acknowledged this, leading to attention placed on how well friendship graphs improve DTN message forwarding. For instance, Socievole et al. [97] found the degree centrality of an individual’s Facebook profile is highly correlated with their degree centrality from physical proximity. This finding suggests that a DTN could be bootstrapped for immediate routing decisions by using an online social network to calculate degree centralities of participating nodes. Their findings also suggested that betweenness
centrality, eigenvector centrality, and closeness centrality had little to no correlation between the social networks. Thus, these metrics would need to be calculated within the confines of the DTN in order to be used.
In [98], an analysis of multiple social network graphs is performed to determine which social network graph has promising influence on successful forwarding. Similar to the motivation of [97], the goal in their analysis is to rely less on long-term learning of social patterns through opportunistic connections, and instead bootstrap the network by using social information that exists in other social networks. Their analysis considers two networks: the social graph formed from the Facebook friend lists of participating nodes, and a graph formed from the nodes’ explicit interests. Their findings suggest that centrality measurements from the opportunistic network are still needed, but the addition of other social network graphs improves successful delivery when compared to relying solely on centrality measurements. Specifically, the explicit interests of participating nodes can be used to predict future contacts in the network. Likewise, a very social node who has a message’s destination as an explicitly listed friend is very likely to meet with that destination. Centrality is still found to be the most important factor in making opportunistic forwarding decisions, but complementing centrality with other social network information boostes a node’s decision making abilities.
Kim and Han [54] propose the Multi-path Routing for Heterogeneous-sized data (MRH) router that considers both the size of the messages being forwarded and the type of relationships between encountered nodes: whether they are friends or just opportunistic encounters. Friendship is determined based on the length of the contact; contacts that are too short are considered pass-by contacts, suggesting the encounter was not between two friends; conversely, contacts that are sufficiently long are considered to be between friends. Given these contact durations, nodes will compute and update three utility scores over time: a node’s social tie score with a particular node is calculated by the average multi-hop minimum social contact duration between the two nodes; a node’s social popularity score is
calculated by the average of all friendship-based contact durations of the node; and a node’s non-social popularity score is calculated by the average of all pass-by contact durations. Using these, the MRH router will forward smaller messages to pass-by contacts that have a higher non-social popularity with others. For larger messages, a contact between friends will result in a message being forwarded if the neighbor has either a higher social tie to the destination or, both having equal social ties, if their social popularity is higher.
2.1.4. Social Interests and Profiles. Apart from a friendship graph, online social
networks also offer other details forming asocial profileof a particular individual: where they live, what topics interest them, their favorite music, etc. The intuition behind using these social profiles is based on the notion that people will tend to meet others with shared interests more often than they would with dissimilar interests. These personal details have been investigated in a few works to see if they improve a node’s ability to make forwarding decisions in a DTN. Primarily, when a message-carrying node encounters another node, a comparison between the two’s social profiles is performed. This comparison would then result in the message-carrying node deciding if the encountered node should receive the message.
In [114], the social tie strength between nodes is considered in a two-phased broad-cast scheme with the objective of decreasing delivery latency without incurring flooding-based resource consumption. During the first phase, called Weak tie-driven forwarding, nodes who act primarily as bridges between communities (who are identified based on their weak social ties) spread a message to other bridges. When message-holding nodes estimate that the message has sufficiently been seeded across the network, the scheme switches into the second phase, calledStrong tie-driven forwarding, where message holders forward the message to very popular nodes so as to quickly spread the message to all nodes within its community.
The social tie strengths used in [114] are calculated for each node-pair based on a linear combination of the number of contacts between the two nodes and their social profile similarities. The contact numbers and the social profile information are recorded and exchanged during a training phase of the network. Social profile similarities are defined as the number of differences between two individuals in specified categories, such as favorite food, home town, employer, etc. For example, a node u with the social profile hfemale, Parisi and a node v with the social profile hfemale, Londoni have a social distance of 1, whereasuand another node wwith the social profile hmale, New York Cityiwould have a social distance of 2.
In SANE [71], unicasting and interest-casting is accomplished through the usage of social profile comparison. In order to represent an individual’s social profile, Mei et al adopt a vector representation hv0,v1,· · ·,vmi, where, among m unique social descriptors,
the valuevk represents a binary weight to which thekth descriptor describes the individual. For instance, consider Bob, who lives in San Francisco and likes Chinese food, and Linda, who lives in Boston but doesn’t like Chinese food. The adopted approach to represent their social profile would first start with assigning indices to each descriptor. In the example’s case, the index 0 would be assigned to Lives in San Francisco, 1 to Lives in Boston, and 2 toLikes Chinese Food. Then, Bob’s social profile could be represented as h1,0,0i, and Linda’s social profile ash0,1,1i.
The forwarding decision adopted in SANE is based around how similar an encoun-tered node’s social profile is to the topics that describe the message under consideration. Similar to each participating node having a social profile of the form hv0,v1,· · · ,vmi, so
too does each message have metadata of the formhv0,v1,· · ·,vmi. When a nodeu, carrying
a messaged, meets a nodev, ucalculates the cosine similarity the social profile of v and the message metadata of d, which is the cosine of the angle formed by the two vectors if they were vectors in anm-dimensional space. If this angle is larger than some minimum threshold,uwill forward the message tov. For the interest-casting approach, where many
nodes in the network wish to receive messages of topics that interest them, the cosine similarity would represent how interested the individual is in the message. In the unicasting approach, the metadata of a message is the social profile of the message’s destination. Thus, if an encountered node has a high similarity value to the message, it is predicted that this individual is more likely to meet up with the destination than some other individual with a much lower similarity.
The Social Identity-aware Opportunistic Router (SIaOR) [112] considers both the social profiles of nodes and their social influences when making routing decisions. Social profiles are generated not solely from a user’s online social media profile, but rather are dynamically generated based on the metadata of the content they produce, such as that stemming from object recognition in photos or significant keywords in messages. Social influence is computed using the nodes’ encounter ratio to each other relative to all of the encounters for a particular node and their trust degree – the ratio of the number of messages a node forwards from its neighbor over the number of messages it received from its neighbor. When nodes encounter one another, they update their social influences, either growing or decaying depending on the new trust degree toward their neighbor, and compute a routing utility relative to each carried message as a power-law weighted product of the potential recipient’s social similarity to the message’s destination and their own social influence on their neighbor. Should the neighbor have a higher utility score for the message, the carrier will forward a copy.
2.1.5. Geographic Routing. Beyond social network based approaches, geographic
information has been investigated as a means for DTN routing. Generally speaking, geo-graphic routing through a network focuses on the specific locations of sources, intermediate relays, and destinations [56]. Of course, this requires that this knowledge be available. Within the confines of a DTN, however, a node carrying a message destined for a des-tination may be unable to look up their location when an opportunistic contact occurs, and any a priori information on the destination’s whereabouts may be inaccurate due to
their unobservable movements. Zhang et al [129] propose the Mobility Prediction-based Routing (MPR) protocol, which models the probability that a node will move from one area to another, and stay within that region for a given period of time, by a time-homogeneous semi-Markov process. Using this process, a message-carrying node will forward a message to the encountered neighbor with the highest probability of encountering the message’s destination for as much time as is needed to successfully transfer the message. MobiT [123] is proposed for trajectory-based routing in Vehicular DTNs, where it is assumed that there exists some infrastructure for message delivery such as moving service vehicles and static road-side units (RSUs). The service vehicles collect the trajectories of participating vehi-cles in the network and centralize them at RSUs, which then use the trajectories to make routing schedules for messages. Messages are delivered through the network over partici-pating vehicles in such a way as to deliver messages to RSUs located where a destination is traveling to before the destination arrives.
Many of the state-of-the-art works for DTN-based geographic routing have, in one way or another, extended the Spray-and-Wait (SaW) algorithm [100]. The most common characteristics of these routers is that the number of message copies that are permitted in the network is capped at some pre-determined quantity, after which no further copies are permitted to be created, and the routing algorithms operate in two phases: the first phase consists of the sprayingof messages to as many nodes as possible, and the second phase consisting of discriminatory forwarding of the remaining message copy to qualified nodes, dropping the message from the sender’s buffer, and traversing through the network until either the message arrives at its destination or the message is dropped, either to make room for more important messages or to delete expired ones. Zhang et al [127] propose the Speed Adaptive Multi-Copy Routing (SAMCR) algorithm that follows this paradigm for Vehicular DTNs (VDTNs) with sparsely-available, statically located road-side units (RSUs). SAMCR
considers an encountered neighboring node to be qualified if the node has a greater relative velocity. Other works, like those that follow, consider geographic information beyond simple velocity.
Cao et al [13] propose the Geographic-based Spray-and-Relay (GSaR) router to use historic locations, velocities, and encounter rates of nodes. Each node is assumped to have initial historic information pertaining to location, velocity, and encounter rates of some nodes throughout the network. This information bootstraps the network, and is progressively updated and further disseminated to others opportunistically. When a node comes in contact with a neighbor, it will iterate over its messages in an order dependent on whether location information of the router is available: in its absence, the order is based on the age and number of remaining replicas available for the message (younger messages with more remaining replicas are favored), and routing operates exactly as specified in Spray-and-Wait. Should the location information be available, the message ordering is based on the likelihood that the traveling encountered neighbor will encounter the destination, based on projections of movement, before the message expires (higher likelihood results in higher priority). To compute this, the message carrying node computes the possible range of movement that the destination for each message could have traveled since its location was last recorded, given the historic speed of the destination. Then, given this range and the traveling direction of the encountered neighbor, half of the permissible message replicas will be handed off if the neighbor will be within this range faster than the message holder.
Similar to GSaR, the Location-Aided Controlled Spraying (LACS) router is pro-posed by Hang et al as another extension on Spray-and-Wait that considers location in-formation [39]. Again, it is a two-phased router split between aspraying phase followed by a decisive single-copy forwarding strategy. When a message carrying node encounters another node, the expected remaining throughput of the channel is computed based on the other node’s relative velocity, channel transmission speed, and the distance between the two nodes. Using this, messages are iterated over, with one being skipped if it cannot
be transmitted during the contact’s remaining time. If a message can be transmitted, the node’s router decides if it will be transmitted. For messages with remaining copies left, transmission is carried out, with half of the messages being transmitted if the nodes are traveling in opposite directions (in a binary-spraying manner) or only one message copy if the nodes are traveling in a similar direction (single-copy relaying manner). However, when only one message copy remains, it would be relayed to the neighbor only if the neighbor is expected to encounter the destination sooner than the carrier. This is computed based on a semi-Markov model that is used to predict the location of the destination node, along with the velocity of the two nodes.
2.2. SIMULATING DTNS
To demonstrate the effectiveness of a DTN forwarding scheme, many researchers have simulated a DTN and gathered statistics from the simulations, such as those outlined in Section 1.4. These simulations require input datasets that describe the time-evolving nature of the network topology. This can come from two sources: real-world datasets or synthesized datasets. In this section, available datasets and models for synthesizing the data needed to simulate a DTN are listed and described.
2.2.1. Contact Traces. When it comes to characterising real-world datasets usable
for DTN simulation, the majority of datasets available are contact traces. A contact trace is a dataset that includes records pertaining to when, and between whom, a contact has occurred. These datasets have typically been produced by dispensing a wirelessly-enabled device to many individuals that periodically broadcast a beacon to all neighboring devices, who in turn reply to announce their presence. The contact traces available have been generated through neighbor detections using the Bluetooth protocol, which has an intended range of 10 meters for most mobile phones and Bluetooth accessories [116].
![Figure 2.1. Illustrative example for calculating the Relative Social Pressure Metric (RSPM) from [10] based on historic contact information](https://thumb-us.123doks.com/thumbv2/123dok_us/10190893.2921834/35.918.174.810.121.302/figure-illustrative-example-calculating-relative-pressure-historic-information.webp)