Instructions for use
Author(s) Ishii, Ken; Kikuchi, Masaru; Nishimura, Takuya; Black, Cameron J.
Citation Earthquake engineering & structural dynamics, 46(4), 677-694https://doi.org/10.1002/eqe.2809
Issue Date 2017-04-10
Doc URL http://hdl.handle.net/2115/68760
Rights
This is the peer reviewed version of the following article: Earthquake Engineering & Structural Dynamics 46(4) 10 April 2017,
pp. 677‒694 which has been published in final form at http://onlinelibrary.wiley.com/doi/10.1002/eqe.2809/abstract. This article may be used for non-commercial purposes in accordance with Wiley Terms and Conditions for Self-Archiving.
Type article (author version)
Published online in Wiley InterScience (www.interscience.wiley.com). DOI: 10.1002/eqe
Coupling behavior of shear deformation and end rotation of
elastomeric seismic isolation bearings
Ken Ishii
1∗†, Masaru Kikuchi
1, Takuya Nishimura
2and Cameron J. Black
3 1Department of Architectural and Structural Design, Faculty of Engineering, Hokkaido University, Kita-13, Nishi-8,Kita-ku, Sapporo 060-8628, Japan
2Institute of Technology, Shimizu Corporation, 3-4-17, Etchujima, Koto-ku, Tokyo 135-8530, Japan 3Seismic Isolation Engineering, Inc., 1144 65th Street, Unit C, Emeryville, CA 94608-1053, U.S.A.
SUMMARY
This paper presents a mechanical model for predicting the behavior of elastomeric seismic isolation bearings subject to combined end rotations and shear deformation. The mechanical model consists of a series of axial springs at the top, mid-height and bottom of the bearing to vertically reproduce asymmetric bending moment distribution in the bearings. The model can take into account end rotations of the bearing, and the overall rotational stiffness includes the effect of the variation of vertical load on the bearing and the imposed shear deformation. Static bending tests under various combinations of vertical load and shear deformation were performed to identify the mechanical characteristics of bearings. The test results indicate that bearing rotational stiffness increases with increasing vertical load but decreases with increasing shear deformation. Simulation analyses were conducted to validate the new mechanical model. The results of analyses using the new model show very good agreement with experimental observations. A series of seismic response analyses were performed to demonstrate the dynamic behavior of top-of-column isolated structures, a configuration where the end rotations of isolation bearings are typically expected to be larger. The results suggest that the end rotations of elastomeric bearings used in practical top-of-column isolated structures do not reduce the stability limit of isolation system. Copyright c2010 John Wiley & Sons, Ltd.
Received . . .
KEY WORDS: seismic isolation; elastomeric isolation bearings; rotational stiffness; seismic response analysis
1. INTRODUCTION
Seismic isolation has been used extensively throughout the world over the last three decades to protect structures from the damaging effects of earthquakes. Elastomeric isolation bearings are one of the most popular devices, and typically installed between large girders which ensure that the ends of isolators remain substantially horizontal with minimal rotation. Configurations without a bottom girder, including top-of-pile isolation and top-of-column isolation result in lower construction costs and a more economical design for isolated structures. However, in these configurations, end rotations of isolators under earthquake excitations are expected and therefore a better understanding of some of the more complex aspects of the isolation device behavior is important for evaluating the stability limit of the isolation system.
∗Correspondence to: Ken Ishii, Department of Architectural and Structural Design, Faculty of Engineering, Hokkaido
University, Kita-13, Nishi-8, Kita-ku, Sapporo 060-8628, Japan
Contract/grant sponsor: Grant-in-Aid for Scientific Research (A); contract/grant number: 15H02274
The mechanical properties of elastomeric isolation bearings depend on the interaction between shear and axial forces. The horizontal stiffness of elastomeric bearings decreases under large shear deformation and high compressive load, and the decrease will ultimately causes isolator buckling. The critical buckling load is one of the most important issues to investigate when considering the safe conditions for isolators. Haringx has introduced an evaluation criterion for the horizontal stiffness of rubber rods under the combination of vertical and horizontal loads [1]. Gent confirmed that the evaluation formula can be applied to elastomeric bearings [2]. In Haringx’s theory, additional shear force and bending moment result from rotational deformation and horizontal deformation, respectively. When considering the horizontal behavior of elastomeric bearings, accurate calculation for bending stiffness is as important as shear stiffness. Previous experimental and analytical research related to the stability of rubber bearings under shear deformation have been conducted. Buckleet al.investigated the critical load of elastomeric bearings [3] and Warnet al.expressed the relationship between the vertical stiffness and the overlapping area of elastomeric bearings [4]. Warnet al.performed parametric finite element analyses, and suggested that the critical load capacity is influenced by not only the overlapping area, but also the shape factor of the bearing [5] and Weismanet al.conducted experimental tests and finite element analyses, and showed that the overlapping area method is a conservative estimation [6]. In addition, Ohsakiet al.performed finite element analyses for a building frame supported by rubber bearings which showed that the vertical pressure concentrates at the overlapping area [7].
Past studies have presented mechanical models which consist of springs and rigid bars in order to illustrate nonlinear characteristics of elastomeric bearings. Koh and Kelly have proposed a simple model which is a series combination of a rotational spring and a shear spring and a rigid link [8]. The model can include the well-known geometric nonlinearity called P-∆effect for isolators. Using the mechanical model, horizontal and vertical deformations of natural rubber bearings are predicted. Iizuka has proposed a macroscopic model as an expansion of Koh and Kelly’s model [9]. The model introduced finite deformation and nonlinear hysteresis to predict the large-deformation behavior of isolators. Takaokaet al. have proposed a modified macroscopic model which contains additional axial spring [10]. Using the modified model, results of shaking table tests including the ultimate behavior of lead lubber bearings are well simulated. Kumaret al.have presented a numerical model containing coupling of horizontal and vertical behavior provided by Koh and Kelly’s model [11]. The model takes axial hysteresis model, shear stress degradation due to heating in lead plug into consideration. Nonlinear behavior of isolators in tension and shear is well captured by the model. Kelly also has presented another expansion of Koh and Kelly’s model [12]. The model has two rotational springs at the top and bottom ends, and the rotational springs are connected to a shear spring at mid-height by two rigid links. A number of extensions of this model have been developed, for example, Ryanet al.extended the model for lead rubber bearings by introducing nonlinear shear springs [13]. Kikuchiet al.have proposed a multi-spring mechanical model which has two series of axial springs instead of two rotational springs mentioned above [14]. The series of axial springs can account for nonlinear behavior in the rotational direction influenced by compressive load, which causes buckling behavior under large shear deformation. Analytical results using this model showed good agreement with test results of lead rubber bearings.
To extend the application of seismic isolators, investigation of the behavior subject to more complex load and deformation is necessary. Imbimbo and Kelly have conducted numerical analyses to simulate buckling behavior of elastomeric bearings supported with flexible ends [15]. The analytical results showed that the critical compressive load decreases with rotational flexibility of the supported end. Karbakhshet al. have extended Haringx’s theory to include initial rotation of the top and bottom ends of elastomeric bearings [16]. The evaluation of the mechanical properties indicated that horizontal stiffness of an isolator can be significantly affected and depending on the direction of end rotation, the horizontal stiffness with end rotation may become larger than the original stiffness. Similarly, Kelly pointed out that the shear deformation of an isolator prevents the tension buckling [17]. Rastgoo Moghadam and Konstantinidis have performed finite element analyses to simulate nonlinear behavior of elastomeric bearings under various boundary conditions [18]. The results well captured the effect of end rotations predicted by Karbakhsh’s theory.
Recently, new design strategies for seismically isolated buildings, such as inter-story isolation and multi-story isolation have progressed [19][20], and several buildings have been built or retrofitted [21][22] using these techniques. A main motivation for this design feature is that it makes the seismic gap around the buildings unnecessary, a potentially significant cost-savings for the project. In the case of top-of-column isolation, the isolators are subjected to not only shear and axial deformation but also end rotations. In this case, the additional bending moment caused by P-∆
effects is distributed asymmetrically in the vertical direction due to the end rotations. The varying load and deformation conditions have to be considered in time history analysis to accurately predict response. This paper presents a mechanical model for elastomeric isolation bearings with the capability to predict nonlinear behavior influenced by load and deformation conditions. This improved model is shown to have greater accuracy and validated with an experimental test program conducted to investigate the cyclic bending of elastomeric bearings. The efficacy of the model is further shown through the simulation of earthquake response of a building model incorporating the numerical bearing model.
2. A MECHANICAL MODEL FOR ELASTOMERIC BEARINGS 2.1. Model formulation
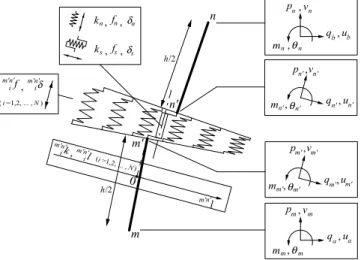
Figure 1 shows the new mechanical model for elastomeric bearings subject to combined end rotations and shear deformation. The model is an extension of an existing model developed by [14]. The model proposed herein has additional mechanical members which improve the accuracy of the model with a minimal increase in complexity. The model is developed for a two-dimensional system, and consists of a series of axial springs at the top, mid-height and bottom of the bearing to vertically reproduce asymmetric bending moment distribution in the bearings. Nonlinear hysteretic relationships are defined for each axial spring to simulate compression and bending behavior of the bearings. The external nodes,aandb, have displacements in horizontal, vertical and rotational directions. The internal nodes,mand n, have displacements in vertical and rotational directions, and their horizontal displacements are equal to those of the external nodes. Two rigid links, whose lengths are equal to the half-height of the bearing,h/2, connect top, mid-height and bottom layers of axial springs. An additional axial spring and a shear spring are located at the center of the mid-height layer. The internal nodes,m0 andn0, have displacements in the horizontal, vertical and rotational directions.
Multiple axial springs
Axial/Shear spring Rigid link Horizontal force Vertical force Bending monent a (external node) b (external node) m n n' m'
Figure 1. Three-layer multi-spring mechanical model.
Figure2shows the forces and deformations on the multiple axial springs between the nodesa andm. In this paper, the left side subscript refers to an individual spring,i, in the multi-spring layer, wherei, ranges from 1 to the number of multiple axial springs,N. The left side superscript is used
=1,2, ... ,N i ( ) f am i ,amid ma,qa qa,ua a p v, a mm,qm m p ,vm l a m k am i (i=1,2, ... ,N) am i , l a m Restoring force, deformation Internal force, displacement Spring constant, distance from the center
0
Figure 2. Forces and deformations on the multiple axial springs at the bottom end.
to indicate the end nodes of the particular layer,a-m/m0-n0/n-b. The incremental deformation of the ith spring,∆am iδ, is expressed as ∆amiδ= [ −1 −am il 1 amil ] ∆amu (1) wheream
il is the distance between theith spring to the center of the series of axial springs, and
∆amuis the incremental displacement vector expressed as
∆amu={∆va ∆θa ∆vm ∆θm
}T
(2) The incremental force of theith spring is expressed as
∆amif =amik·∆amiδ (3)
wheream
ikis the stiffness of theith spring. The incremental forces and bending moments on the
nodesaandmare expressed as follows:
∆pa=−∆pm=− N ∑ i=1 (∆amif) (4) ∆ma=−∆mm=− N ∑ i=1 (∆amif·amil) (5)
The relationship between incremental forces and incremental displacements of the multiple axial springs at the bottom end is expressed as
∆amf =amK∆amu (6) where ∆amf ={∆pa ∆ma ∆pm ∆mm }T (7) amK= amK 1 amK2 −amK1 −amK2 amK 3 −amK2 −amK3 amK 1 amK2 symm. amK 3 (8) amK 1= N ∑ i=1 (amik), amK2= N ∑ i=1 (amik·amil), amK3= N ∑ i=1 (amik·amil2)
By substituting the nodes nand bfor aandm, the same procedure can be applied to obtain the relationship of the multiple axial spring at the top. The relationship is expressed as
mm',qm' qm',um' m' p ,vm' mn',qn' qn',un' n' p,vn' l m'n' k m'n' i =1,2, ... , N i ( ) m'n' i , l =1,2, ... ,N i ( ) f m'n' i d m'n' i , ks,fs,ds kn,fn,dn qa,ua mm,qm m p ,vm qb,ub mn,qn n p ,vn h/2 h/2 n n' m' m 0
Figure 3. Forces and deformations on the multiple axial springs at mid-height and rigid links.
Figure3shows the forces and deformations on the multiple axial springs between the nodesm0 andn0. The incremental force-displacement relationship on the nodesm0andn0, which exclude the rigid links, is expressed as follows:
∆m0n0f =m0n0K∆m0n0u (10) ∆m0n0f ={∆qm0 ∆pm0 ∆mm0 ∆qn0 ∆pn0 ∆mn0 }T (11) ∆m0n0u={∆um0 ∆vm0 ∆θm0 ∆un0 ∆vn0 ∆θn0 }T (12) m0n0K= m0n0K s 0 0 −m 0n0 Ks 0 0 m0n0K n 0 0 −m 0n0 Kn 0 m0n0K r 0 0 −m 0n0 Kr m0n0K s 0 0 m0n0K n 0 symm. m0n0K r (13) m0n0K s=ks, m 0n0 Kn = N ∑ i=1 (m0n0ik) +kn, m 0n0 Kr= N ∑ i=1 (m0ni0k·m 0n0 il 2 )
whereksandkn are the stiffness of shear and axial springs at the center of the mid-height layer,
respectively. Because of its location, the axial spring has no contribution to the rotational stiffness of multiple axial springs m0n0K
r. By introducing the transformation matrix,T, the displacement
vector and the force vector on the nodesmandncan be expressed by those on the nodesm0andn0 as follows: ∆m0n0u=T∆mnu, ∆mnf =TT∆m0n0f (14) where ∆mnf ={∆qa ∆pm ∆mm ∆qb ∆pn ∆mn }T (15) ∆mnu={∆ua ∆vm ∆θm ∆ub ∆vn ∆θn }T (16)
T= 1 0 −h/2 0 0 0 −θm 1 δs/2 0 0 0 0 0 1 0 0 0 0 0 0 1 0 h/2 0 0 0 −θn 1 −δs/2 0 0 0 0 0 1 (17)
In the construction of T, P-∆ effect is considered while small rotational angle is assumed. The deformation of the shear spring,δs, is calculated by
δs=un0−um0 = (ub−ua) +
h
2(θn+θm) (18)
The incremental force-displacement relationship on the nodesmandnis expressed as follows:
∆mnf =mnK∆mnu (19)
where
mnK=TTm0n0KT
(20) The relationship between incremental forces and incremental displacements of the overall bearing element is obtained from Equations (6), (9) and (19):
{ ∆fex ∆fin } = [ K11 K12 K21 K22 ] { ∆uex ∆uin } (21) where∆fexand∆finare the incremental forces on the external nodesaandb and on the internal
nodesmandn, respectively, and∆uexand∆uinare the incremental displacements on the external
nodesaandband on the internal nodesmandn, respectively. The incremental force vectors and displacement vectors are expressed as
∆fex= { ∆qa ∆pa ∆ma ∆qb ∆pb ∆mb }T (22) ∆fin= { ∆pm ∆mm ∆pn ∆mn }T (23) ∆uex= { ∆ua ∆va ∆θa ∆ub ∆vb ∆θb }T (24) ∆uin= { ∆vm ∆θm ∆vn ∆θn }T (25) The sub matrices,K11,K12,K21andK22, are obtained by arranging the entry ofamK,mnKand nbKto the corresponding nodesa,b,mandn. In the step-by-step calculation for dynamic analysis,
the total acting force can be expressed as { Fex Fin } = { fex fin } + [ K11 K12 K21 K22 ] { ∆uex ∆uin } (26) whereFexandFinare the acting forces at the new time step on the external nodesaandband the
internal nodesmandn, respectively, andfexand fin are the acting forces at the old time step on
the external nodesaandband the internal nodesmandn, respectively. In the case that the internal nodes have no mass, by substitutingFin=0, solving Equation (26) forFexanduingives
Fex=fex−K12K−221fin+ (K11−K12K−221K21)∆uex (27)
∆uin=−K−221fin−K−221K21∆uex (28)
Equation (27) describes how to calculate the acting forces from the incremental displacement on the external nodesaandb. This condensation procedure can be used to facilitate stable numerical analyses when this proposed mechanical model is used with other structural elements, such as columns or beams.
2.2. Spring constants
The process to determine the stiffness of the shear and axial springs in the mechanical model is described below. The total stiffness of an elastomeric bearing is expressed as follows:
KH= GA hr (29) KV = EcA hr (30) KR= EbI hr (31) whereKH,KV andKRare the horizontal, vertical and rotational stiffness, respectively, andG,Ec
andEbare the shear, compressive and bending moduli, respectively. The remaining parameters,A,
Iandhrare the cross-sectional area, the second moment of area and the total thickness of the rubber
pad, respectively. The effective moduli of an elastomeric bearing are calculated as follows: Ec= E(1 + 2κS2)·K E(1 + 2κS2) +K (32) Eb= E(1 + 23κS2)·K E(1 +23κS2) +K (33)
whereE,Kandκare the Young’s modulus, the bulk modulus and a constant related to the hardness of the rubber, respectively, and S is the shape factor of the rubber pad. The shape factor,S, is expressed as
S= D−Di 4tr
(34) whereD,Diandtrare the outer diameter, inner diameter and the thickness of a rubber pad.
First, the horizontal stiffness of the bearing is represented by the shear spring which is located at the center of the mid-height layer. The condition can be expressed as
ks=KH (35)
Next, regarding the three layers of multiple axial springs as three rotational springs connected in series, the rotational stiffness is given by:
1 KR = am1 KR +m0n10 KR +nb1 KR (36) whereamK R, m 0n0
KR and nbKR are the rotational stiffness values of each multiple axial spring
component calculated as follows:
amK R= amEI aml , m0n0K R= m0n0EI m0n0l , nbK R= nbEI nbl (37)
where amE, m0n0E and nbE are the elastic moduli, and aml, m0n0l and nbl are the fictitious computational lengths of the multiple springs. Consider the horizontal deformation derived from bending deformation in the case of antisymmetric bending with keeping the horizontalness of the top and bottom end. If the horizontal deformation of the mechanical model is equal to that of a beam element, the stiffness of the rotational springs at the top and bottom end,amK
RandnbKR, satisfy: amK
R=nbKR= 6KR (38)
In the derivation of Equation (38), the mechanical model is assumed to be symmetric. By substituting Equation (38) into (36),m0n0K
Ris obtained as m0n0K
When the fictitious computational lengths of multiple springs,aml,m0n0landnbl, are equal to one
third of the total thickness of the rubber,hr/3, the elastic moduli are amE=nbE= 2E
b (40)
m0n0E= 0.5E
b (41)
The spring constants of the multiple axial springs,am ik,m
0n0
ikandnbik, are calculated by using these
moduli with nonlinear properties in the next section. Finally, regarding the three layers of multiple axial springs as the three vertical springs connected in series, the vertical stiffness is given by:
1 KV = 1 amK V + 1 m0n0K V + 1 nbK V (42) where amK V, m 0n0
KV and nbKV are the vertical stiffness values of each multiple axial spring
component calculated as follows:
amK V = amEA aml , m0n0K V = m0n0EA m0n0l +kn, nbK V = nbEA nbl (43)
By substituting Equation (43) to (37), the vertical stiffness can be expressed as follows:
am KV = amK RA I , m0n0 KV = m0n0K RA I +kn, nb KV = nbK RA I (44)
The stiffness of the axial spring which is located the center of the mid-height layer,kn, is determined
from Equations (30), (31), (38), (39), (42) and (44) as kn= 9 2 Eb(Ec−Eb) 3Eb−Ec A hr (45) 2.3. Nonlinear properties for axial springs
Multiple axial springs
between node a and m
a - m
m' - n'
n - b
1 i N
Shear deformation Effective sectional area
A B B' A' if AA' BB' =
Each spring in the multiple axial spring component represents an individual strip of the bearing’s cross-sectional area, and is located at the center of gravity of individual strip. The spring constant of each spring,ik, is calculated as
ik=
ie·ia·iφ
l (46)
whereie,iaandlare the elastic modulus, the area of the strip and the fictitious computational length
of the spring. The overlapping factor,iφ, is used to calculate the effective sectional area of multiple
axial springs.
Figure4illustrates the overlapping area between the top and bottom endplates, and the calculation of the overlapping factor for theith spring between the nodesaandm. The chords AA’ and BB’, passing through the location ofith axial spring, are the chords of the circular area at thea-mlayer (bottom end of the bearing) and the overlapping area at then-blayer, respectively. The overlapping factor,iφ, is calculated as the ratio of the length of the chord BB’ to AA’.
Figure5describes the stress-strain relationship for each axial spring. The elastic modulus,ie, is
defined by using the hysteresis model, whereσty is 1 MPa,Ety/Einit is 1/500,σcy is 100 MPa,
Ecy/Einitis 1/2.Einit, the initial elastic modulus, is calculated by Equation (40) (for the springs at
the top and bottom end) or (41) (for the springs at the mid-height).
0 0 Axial strain Axial st res s Compression Tension Ety Einit Ecy sty scy
Figure 5. Hysteresis model for multiple axial springs.
3. BEARING TESTS AND SIMULATION ANALYSES 3.1. Bearing tests
Accurate estimation of the rotational stiffness is important when investigating coupling in the shear and axial directions. This is particularly true when considering the buckling stability of elastomeric bearings. Static bending tests under various combinations of vertical load and shear deformation were performed on two bearings to identify their mechanical characteristics. Figure 6shows the design of the natural rubber bearings tested while TableIsummarizes their properties. The aspect ratio,S2=D/hr, is defined as a ratio of the rubber diameter to total rubber thickness, and is an
indicator of buckling stability. As shown in Table I, the bearings tested as part of this study had aspect ratios of 4 and 5.
Figure 7 outlines the procedure used to perform the bending tests. After the bearings were loaded to a partical axial compressive stress, the top of the bearing was offset a certain distance corresponding to a perscribed shear stress. In this offset position, the top of the bearing was rotated relative to the bottom. The rotational angle, which is observed at the top of the upper most rubber layer, was varied from−0.02 to 0.02 rad. The test parameters are summarized in TableII.
70 32 268.3 200 450 500 32 70 32 224.9 200 450 500 32
Bearing A (aspect ratio, S2 = 4) Bearing B (aspect ratio, S2 = 5)
Unit: mm
Figure 6. Rubber bearing design.
Table I. Dimensions and material constants of the natural rubber bearings.
Bearing A Bearing B
Outer diameter,D(mm) 500
Inner diameter,Di(mm) 70
Thickness of rubber pad,tr(mm) 3.7
Thickness of steel plate (mm) 2.5
Shape factor,S 29.1
Number of rubber layers 34 27
Total rubber thickness,hr(mm) 125.8 99.9
Total height,h(mm) 208.3 164.9
Aspect ratio,S2 4 5
Shear modulus,G(MPa) 0.392
Bulk modulus,K(MPa) 2000
Constant related to the hardness,κ 0.85
1) Compress
2) Shear offset
Observation point of rotational angle and bending moment
3) Rotate
Rotational angle, q
Offset shear strain, g
Compressive stress, s
Table II. Parameters varied in bearing tests.
Aspect ratio of the bearing 4, 5
Compressive stress,σ(MPa) 1, 10
Offset shear strain,γ(%) 0, 50, 100, 150, 200
Rotational angle,θ(rad) ±0.02
3.2. Simulation analyses -0.02 0 0.02 -300 -200 -100 0 100 200
Rotational angle [rad]
Be ndi ng m om ent [10 6 N ×m ] experiment analysis -0.02 0 0.02 -100 0 100
Rotational angle [rad] experiment analysis -0.02 0 0.02 -100 0 100
Rotational angle [rad]
Be ndi ng m om ent [10 6 N ×m ] experiment analysis
(a) Aspect ratio = 4, s = 1 MPa (b) Aspect ratio = 5, s = 1 MPa
(c) Aspect ratio = 4, s = 10 MPa (d) Aspect ratio = 5, s = 10 MPa
g = 0% g = 100% g = 200% g = 0% g = 100% g = 200% -0.02 0 0.02 -300 -200 -100 0 100 200
Rotational angle [rad] experiment analysis g = 0% g = 100% g = 200% g = 0% g = 100% g = 200%
Figure 8. Bending moment-rotational angle relationship.
Simulation analyses of the bearing tests were conducted to validate the proposed mechanical model. Equation (47) is used to calculate the Young’s modulus of the rubber.
E= 9KG
3K+G (47)
Experimental testing is not required to determine the properties of the model as the stiffness of the shear and axial springs in the proposed model can be determined directly from the geometry and
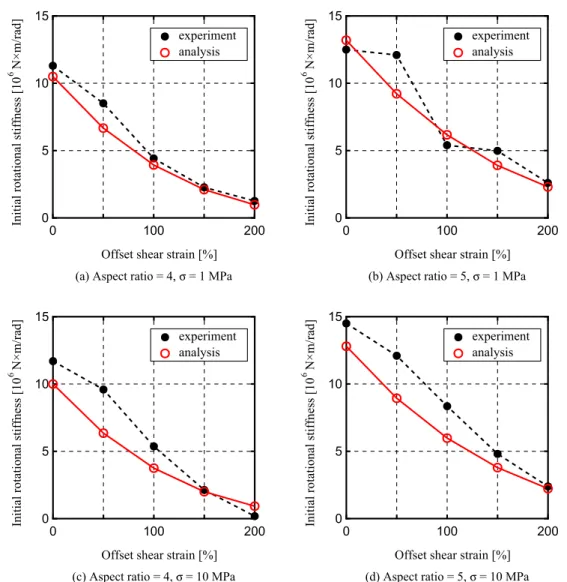
(a) Aspect ratio = 4, s = 1 MPa (b) Aspect ratio = 5, s = 1 MPa
(c) Aspect ratio = 4, s = 10 MPa (d) Aspect ratio = 5, s = 10 MPa
0 100 200
0 5 10 15
Offset shear strain [%]
Ini ti al rot at iona l s ti ffne ss [10 6 N ×m /ra d] experiment analysis 0 100 200 0 5 10 15
Offset shear strain [%]
Ini ti al rot at iona l s ti ffne ss [10 6 N × m /ra d] experiment analysis 0 100 200 0 5 10 15
Offset shear strain [%]
Ini ti al rot at iona l s ti ffne ss [10 6 N × m /ra d] experiment analysis 0 100 200 0 5 10 15
Offset shear strain [%]
Ini ti al rot at iona l s ti ffne ss [10 6 N ×m /ra d] experiment analysis
Figure 9. Initial rotational stiffness vs. offset shear strain.
material constants listed in TableI. If a new, or previously untested rubber material is used in the bearings, material tests to obtain material constants and stress-strain relationship would be required. Figure 8 shows the comparison of the bending moment-rotational angle relationship obtained from experimental and analytical results. Figures 8(a) and (b) show the results under 1 MPa compressive stress for the two aspect ratios considered. For the analyses at zero shear strain, the characteristic values, including the yielding moment, the yielding angle and the post-yield stiffness are well predicted. For the analyses at 100% or 200% shear strain, it is seen that the post-yield stiffness is underestimated somewhat at larger angles of rotation. The bending moment at zero rotation is a result of the offset shear deformation in the bearing. Although the analytical results underestimate the post-yield stiffness, the results indicate that the simulation analyses using the overlapping factor does reasonably account for the change in rotational stiffness. Figures8(c) and (d) show the results under 10 MPa compressive stress. The equivalent stiffness under 10 MPa compressive stress is larger than that of 1 MPa results because compressive stress prevents partial tension yielding of the rubber. In the case of 200% shear strain, the experimental results for the bearing with an aspect ratio of 4 shows a negative stiffness due to bearing instability. While the analytical results underestimate the hysteresis loop area, the model does reasonably predict the change in equivalent stiffness when the bearing is stable.
Figure9shows the comparison of the initial rotational stiffness calculated from the results within small rotational angles. The stiffness decreases with increasing offset shear strain, and increases with increasing compressive stress. The analytical results show good agreement with experimental results in all parameters, and further validates the methodology of the proposed model.
4. SEISMIC RESPONSE ANALYSES 4.1. Structure model
A series of seismic response analyses were performed to demonstrate the dynamic behavior of top-of-column isolated structures. In the case of top-top-of-column isolation, the isolators are subjected to not only shear and axial deformation but also end rotations. Time history analysis is used with the proposed mechanical model to investigate varying conditions of load and deformation.
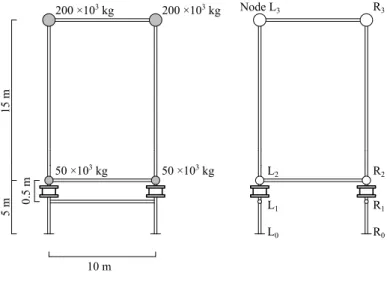
Figure10shows the simplified structure model used in the seismic response analyses. Structure A, referred to as the double beam structure, represents a conservative design which uses two beams (one above and one below the isolator) to limit end rotations in the isolators. Structure B, the single beam structure, omits the bottom beam between the node L1 and R1. Isolation bearing elements are applied to the column tops at the first floor, between the node L1 and L2, and the node R1 and R2, and linear beam elements are used to connect the other nodes. The same isolator with aspect ratio 4 used in bearing tests and simulation analyses is used in this structure model.
Masses are applied to the node L2, L3, R2 and R3 to produce 10 MPa compressive stress on the isolators. The stiffness of the beam elements are chosen to give a fundamental period of 0.8 s for the non-isolated, single beam case, with a beam-column stiffness ratio of 3/1. By introducing the bottom beam for Structure B, little decrease in the fundamental period is found. Stiffness proportional damping is applied to the beam elements with the damping factor of 2% at the fundamental period of the non-isolated structure. A linear dashpot element (not shown in Figure10) is also installed at the isolation level with and equivalent damping factor of 15% at the seismic isolation period of 3.9 s.
Structure A (double beam) Structure B (single beam) 10 m 15 m 5 m 0.5 m 200 ×103 kg 50 ×103 kg 200 ×103 kg 50 ×103 kg Node L3 L1 L2 L0 R3 R2 R1 R0
Figure 10. Structure models for seismic response analyses.
4.2. Earthquake ground motions
Figure11shows the ground motions for the response analyses. The ground motions are generated to match target response spectrum for basic design earthquakes [23]. Phase angles of JMA Kobe
(a) Time history (b) Response acceleration spectrum Input A (Kobe, PGA = 4.20 m/s2)
Input B (Hachinohe, PGA = 3.91 m/s2)
Input C (Random, PGA = 3.54 m/s2)
Time [s] Acce le rat ion [ m /s 2] Period [s] R esponse ac ce le rat ion [ m /s 2] Input A Input B Input C -5 0 5 -5 0 5 0 40 80 120 -5 0 5 10-1 100 101 0 4 8
Figure 11. Input ground motions.
NS (1995), Hachinohe NS (1968) and the random number record are denoted inputs A, B and C, respectively. For the analysis, the structure model was subjected to a series of input motions scaled from 5% of the original motion, increasing in 5% increments, until the deformation in the isolators reached 0.4 m, which corresponds to a shear strain of 320%.
4.3. Analysis results
Figures 12 and 13 show the relationship between the maximum acceleration and displacement response at node L3 and the peak ground acceleration (PGA). For comparison, the analysis results for a conventional non-isolated building model and an isolated building model with linear isolator elements with stiffness values defined by Equations (29), (30) and (31) are also indicated. As expected, the acceleration response decreases while displacement response increases for the isolated structures. The results obtained using the proposed mechanical model show that the slope of the response acceleration curve gradually decreases while that of the response displacement curve increases. The influence of introducing the bottom beam on the acceleration and displacement response is minimal.
Figure 14 shows the maximum bending moment at the first floor column base (node L0). By introducing the bottom beam, the maximum bending moment reduction in the conventional and isolated structures is about 20% and 60%, respectively.
Figure 15 shows the maximum relative rotational angle between the ends of the isolators. For comparison with conventional structures, the relative rotational angle is calculated between the nodes L1 and L2. By introducing the bottom beam, the reduction in the maximum rotational angle in the case of conventional and isolated structures are about 50% and 75%, respectively, when the PGA is less than 2 m/s2. In these cases, the rotational angle of the isolated double beam configurations,
are nearly the same as that of conventional structure, while they rapidly increase for PGAs above 2 m/s2. The maximum rotational angle in all numerical analyses is less than 1/1000, and therefore the
isolator end rotations are not significant enough to degrade the seismic performance of the isolators. Figure16shows the horizontal force-deformation relationship of the isolators between nodes L1 and L2 for the maximum ground motions considered. The results are obtained using the proposed mechanical model. The nonlinear relationships remain stable even when the horizontal stiffness is negative after buckling occurrs at the deformations of around 0.35 m. The results suggest that the end rotations of the isolators in the top-of-column isolated structure (without the bottom beam) do not decrease the stability of the isolation system. Response values obtained from the linear isolated
Input A Input B Input C PGA [m/s2] Acce le rat ion [ m /s 2] Double beam Single beam
Conventional Isolated, linear model Isolated, proposed model
0 2 4 0 2 4 6 0 2 4 0 2 4 6 0 2 4 0 2 4 6
Figure 12. Acceleration of the superstructure.
Input A Input B Input C
PGA [m/s2] Displ ac em ent [ m] Double beam Single beam
Conventional Isolated, linear model Isolated, proposed model
0 2 4 0 0.2 0.4 0 2 4 0 0.2 0.4 0 2 4 0 0.2 0.4
Figure 13. Displacement of the superstructure.
Input A Input B Input C
PGA [m/s2] B ending mom ent [ kN ×m] Double beam Single beam
Conventional Isolated, linear model Isolated, proposed model
0 2 4 0 1000 2000 0 2 4 0 1000 2000 0 2 4 0 1000 2000
Input A Input B Input C PGA [m/s2] R ot ati oanl angl e [ ra d] Double beam Single beam
Conventional Isolated, linear model Isolated, proposed model
0 2 4 0 0.001 0 2 4 0 0.001 0 2 4 0 0.001
Figure 15. Relative rotational angle between the top and bottom ends of the isolator. Double beam Single beam Horizontal Deformation [m] (Shear Strain) Hor iz ontal F orce [kN ] -200 0 200 -0.4 0 0.4 -0.4 0 0.4 -200 0 200 -0.4 0 0.4 -200 0 200
Input A Input B Input C
(320%) (-320%)
(320%)
(-320%) (-320%) (320%)
Figure 16. Horizontal force-deformation relationship of the isolator.
model are conservative in these analyses, but the proposed model is necessary to confirm the stability of seismically isolated buildings when the isolators are expected to buckle.
5. CONCLUSIONS
This paper proposed a mechanical model for predicting the behavior of elastomeric seismic isolation bearings subject to combined end rotations and shear deformation. The mechanical model consists of a series of axial springs at the top, mid-height and bottom of the bearing. The model accounts for the interaction between shear and axial forces, such as P-∆effects, and the three series of axial springs can reproduce asymmetrically distributed bending moment caused by end rotations. The overlapping factor and the nonlinear hysteresis model are applied to the axial springs to account for the influence of the variation of vertical load on the bearing and the imposed shear deformation.
Static bending tests under various combinations of vertical load and shear deformation were performed to identify the mechanical characteristics of bearings, and simulation analyses for the bearing tests were conducted to validate the proposed model. The results indicate that bearing rotational stiffness decreases with increasing offset shear strain, and increases with increasing compressive stress. The analytical model succeeded in capturing the stiffness changes observed in the bearing tests.
A series of seismic response analyses were performed to demonstrate the dynamic behavior of top-of-column isolated structures. Two simplified structure models, a double beam and a single beam structure, were generated to represent a conservative and economical design for seismic isolation. The influence of omitting the beam below the isolators is not significant in the response acceleration and displacement, while it increases the response rotational angle and bending moment. Although the end rotation of the isolators are relatively large in the case of the single beam, the horizontal stiffness degradation observed in the isolators is negligible in the range of the numerical analyses. By reinforcing the base of the isolated column, the seismic performance of top-of-column isolated structures can be as high as structures isolated at their base. The analysis results suggest that the single beam, top-of-column isolation can be used without a reduction in the stability limit of the isolation system.
REFERENCES
1. Haringx JA. On highly compressible helical springs and rubber rods, and their application for vibration-free mountings.Philips Research Reports1948;3. 1949;4.
2. Gent AN. Elastic stability of rubber compression springs.Journal of Mechanical Engineering Science1964;6(4): 318–326. DOI: 10.1243/JMES JOUR 1964 006 046 02.
3. Buckle I, Nagarajaiah S, Ferrell K. Stability of elastomeric isolation bearings: experimental study.Journal of Structural Engineering2002;128(1): 3–11. DOI: 10.1061/(ASCE)0733-9445(2002)128:1(3).
4. WarnGP, Whittaker AS, Constantinou MC. Vertical stiffness of elastomeric and lead-rubber seismic isolation bearings. Journal of Structural Engineering 2007; 133(9): 1227–1236. DOI: 10.1061/(ASCE)0733-9445(2007)133:9(1227).
5. Warn GP, Weisman J. Parametric finite element investigation of the critical load capacity of elastomeric strip bearings.Engineering Structures2011;33(12): 3509–3515. DOI: 10.1016/j.engstruct.2011.07.013.
6. Weisman J, Warn GP. Stability of elastomeric and lead-rubber seismic isolation bearings.Journal of Structural Engineering2012;138(2): 215–223. DOI: 10.1061/(ASCE)ST.1943-541X.0000459.
7. Ohsaki M, Miyamura T, Kohiyama M, Yamashita T, Yamamoto M, Nakamura N. Finite-element analysis of laminated rubber bearing of building frame under seismic excitation. Earthquake Engineering and Structural Dynamics2015;44(11): 1881–1898. DOI: 10.1002/eqe.2570.
8. Koh CG, Kelly JM. A simple mechanical model for elastomeric bearings used in base isolation.International Journal of Mechanical Sciences1988;30(12): 933–943. DOI: 10.1016/0020-7403(88)90075-6.
9. Iizuka M. A macroscopic model for predicting large-deformation behaviors of laminated rubber bearings.
Engineering Structures2000;22: 323–334. DOI: 10.1016/S0141-0296(98)00118-7.
10. Takaoka E, Takenaka Y, Nimura A. Shaking table test and analysis method on ultimate behavior of slender base-isolated structure supported by laminated rubber bearings.Earthquake Engineering and Structural Dynamics2011;
40(5): 551–570. DOI: 10.1002/eqe.1048.
11. Kumar M, Whittaker AS, Constantinou MC. An advanced numerical model of elastomeric seismic isolation bearings.Earthquake Engineering and Structural Dynamics2014;43(13): 1955–1974. DOI: 10.1002/eqe.2431. 12. Kelly JM.Earthquake-resistant design with rubber (2nd edition). Springer: London, 1997.
13. Ryan KL, Kelly JM, Chopra AK. Nonlinear model for lead-rubber bearings including axial-load effects.Journal of Engineering Mechanics 2005;131(12): 1270–1278. DOI: 10.1061/(ASCE)0733-9399(2005)131:12(1270). 14. Kikuchi M, Nakamura T, Aiken ID. Three-dimensional analysis for square seismic isolation bearings under large
shear deformations and high axial loads.Earthquake Engineering and Structural Dynamics2010;39(13): 1513– 1531. DOI: 10.1002/eqe.1042.
15. Imbimbo M, Kelly JM. Stability aspects of elastomeric isolators.Earthquake spectra1997;13(3): 431–449. DOI: 10.1193/1.1585956.
16. Karbakhsh Ravari A, Bin Othman I, Binti Ibrahim Z, Ab-Malek K. P-∆and end rotation effects on the influence of mechanical properties of elastomeric isolation bearings.Journal of Structural Engineering2012;138(6): 669–675. DOI: 10.1061/(ASCE)ST.1943-541X.0000503.
17. Kelly JM. Tension buckling in multilayer elastomeric bearings.Journal of Engineering Mechanics2003;129(12): 1363–1368. DOI: 10.1061/(ASCE)0733-9399(2003)129:12(1363).
18. Rastgoo Moghadam S, Konstantinidis D. Effect of rotation on the horizontal behavior of rubber isolators.11th Canadian Conference on Earthquake Engineering, Victoria, BC, Canada, 2015; No. 94255.
19. Ryan KL, Earl Cl. Analysis and design of inter-story isolation systems with nonlinear devices. Journal of Earthquake Engineering2010;14(7): 1044–1062. DOI:10.1080/13632461003668020.
20. Charmpis DC, Komodromos P, Phocas MC. Optimized earthquake response of multi-storey buildings with seismic isolation at various elevations. Earthquake Engineering and Structural Dynamics 2012; 41(15): 2289–2310. DOI:10.1002/eqe.2187.
21. Tsuneki Y, Torii S, Murakami K, Sueoka T. Middle-story isolated structural system of high-rise building.The 14th world Conference on Earthquake Engineering, Beijing, Cnina, 2008.
22. Fakhouri MY, Igarashi A. Multiple-slider surfaces bearing for seismic retrofitting of frame structures with soft first stories.Earthquake Engineering and Structural Dynamics2012;42(1): 145–161. DOI: 10.1002/eqe.2198. 23. Midorikawa M, Okawa I, Iiba M, Teshigawara M. Performance-based seismic design code for buildings in Japan.