NBER WORKING PAPER SERIES
MAThEMATICAL ACHIEVEMENT IN
EIGHTh GRADE: INThRSTATE
AND RACIAL DIFFERENCES
Victor R. Fuchs
Diane M. Reklis
Working Paper No. 4784
NATIONAL BUREAU OF ECONOMIC RESEARCH 1050 Massachusetts Avenue
Cambridge, MA 02138
June 1994
Financial support for this reseaich from the Andrew W. Mellon Foundation and The Robert
Wood Johnson Foundation is gratefully acknowledged. We also wish to acknowledge helpful
comments from seminar participants at the Stanford Center for the Study of Families, Children
and Youth and at the Biostatistics Workshop at Stanford University. and from Alan Garber and
Alan Krueger. This paper is part of NBER's research program in Labor Studies. Any opinions
expressed are those of the authors and not those of the National Bureau of Economic Research.
NBER Working Paper #4784 June 1994
MATHEMATICALACHIEVEMENTIN
EIGHTh GRADE: INTERSTATE
AND RACIAL DIFFERENCES
ABSTRACT
The 1992 eighth grade
mathematicstest of the National Assessment of Educational
Progress reveals a low average
level of achievement, wide variation acrossstates, and a large
difference in average
scoresof white and black students. Multiple regression analysis across
states indicates that the characteristics of children (such as readiness to learn in kindergarten) andof the households in which they live (such as mother's education) have much larger effects on
NAEP test scores than do variables (such as the student/teacher ratio) that measure school
characteristics. White-black differences in the levels of child and household variables account
for much of the white-black difference in NAEP test scores.
Victor It Fuchs
Diane M. Reklis
National Bureau of Economic Research
National Bureau of Economic Research
204 Junipero Sen Boulevard
204 Junipero Sen Boulevard
Stanford, CA 94305 Stanford, CA 94305
Expressions of concern regarding the low achievement of American students have been appearing for more than a decade.' Some researchers contend that the bad news has been overstated,2 but others point to a variety of evidence that provides little ground for complacency. From the early 1960s to the late 1970s, SAT scores declined substantially; this decline can only partially be explained by changes in the composition of students taking the test.3 Since the tate
1970s, there has been a slight recovery in mathematics scores, and a substantial rise in the achievement of black students overall, but verbal scores for white students remain close to their all-time low. In comparisons with students in other industrialized nations, American students often perform poorly; international differences in achievement in mathematics and sciences have
received special attention.4 U.S.employersand prospective employers frequently complain about high school graduates who lack basic skills in English and mathematics, and these
complaints are echoed by university professors and administrators who find that many freshmen require extensive remedial work before they can begin higher education. Finally, it is important to note that achievement varies widely within the U.S. by geographic location, race, and socioeconomic status.
Concern regarding low achievement is not accompanied by agreement about it's causes or possible solutions. Some critics see the problem residing primarily in the schools themselves, while others believe that changes in families and communities are at the root of the problem. Even those who focus on the schools disagree as to whether the problem is primarily one of inadequate resources (e.g., high student/teacher ratios) or whether the educational process is plagued by inefficient bureaucrats and ineffective teachers. Similarly, critics who claim that the problems lie outside the schools are divided between those who see poverty as the principal cause and those who put more emphasis on changes in adult behavior that result in decreased parental involvement with their children.
In a previous study of the decline in the mental, physical, and emotional well-being of children since 1960, we found that explanations that emphasize material resources could not be valid for the first half of the period: purchases of goods and services for children by government rose rapidly, as did real household income per child, and the poverty rate of children
plummeted.5 By contrast,inthe 1980s material conditions deteriorated for many children, especially those in households at the lower end of the income distribution.
This paper attempts to identify the factors associated with educational performance through an analysis of interstate differences in mathematical achievement in 1992. The determinants for all races and for white students only are identified, and the latter are used to analyze the large white-black differential in achievement.
Reliance on state data has some obvious limitations, including a relatively small number of observations and the possibility that statewide aggregates may obscure information about individual students. There are, however, at least two important advantages of state aggregate data over cross-sectional studies of individual students. First, because there is great stability in interstate differences overtime, the "window of time" problem is not as severe.6 With
individual data, for example, a child may nat be living in poverty at the time of a given study, but her performance in sèhool may be significantly affected by having been in poverty for much of her life. Second, studies based on individual data usually assume that all of the effects of a variable, e.g., living in a one-adult household, are experienced by the individual child. In fact, there may be important "neighborhood" effects (i.e.. externalities) which will be reflected in the aggregate data. In addition to these methodological advantages, data for certain important variables are available only by state.
Interstate and Racial Differences in Achievement
The results of the eighth grade mathematics test (MATHS) of the National Assessment of Educational Progress (NAEP) were used to measure mathematics achievement. According to some experts, the MAEP offers uthe only dependable national index for monitoring the perform-ance of our schools."7 NAEP results were made available by state for the first time in 1990, and again in 1992. This study used the 1992 scores8 which we found to be highly correlated with both the 1990 data (r=.97) and with the 1992 fourth grade mathematics scores (r=.95).
Three aspects of the statewide averages summarized in Table 1 deserve special attention. First, the averagelevel of achievement--a mean of 266—is quite low.9 For students to receive a score of 300 they only had to demonstrate an ability to solve problems involving decimals, fractions, and percentages, and to use elementary concepts in algebra, geometry, and
statistics.10 There is no state where the average eighth grader came close to meeting that standard. A score of 250 indicates only an ability to add, subtract, multiply and divide whole numbers and solve two-step problems." Second, we see wide variation across states in the avenge level of achievement. There is almost a 40 point gap between the lowest and the highest state. Finally, achievement levels differ greatly between white and black students. Thehighest mean state score for blacks is below the lowest mean state score for whites. The following analyses focus on the interstate and racial differentials; the results may also throw light on the generally low level of achievement.
Determinants of Interstate Differences in Achievement
The explanatoryvariablesused in this study are described in Table 2. They are of three types. First,
there are
variables such as READYand LOWBWT that pertaindirectly to children themselves.Second, there
are variables such asMOMDRP andPOVRTYthat describe the households inwhichthe children live. Finally, variables such as STU/TCH measure characteristics of the schools that the children attend. Variables were chosen on the basis of theoretical considerations, previous empirical research, and availability.Readiness-to-learn in kindergarten (READY) is a new series developed by the Carnegie Foundation for the Advancement of Teaching. In 1990 kindergarten teachers were asked to estimate the percentage of their students who entered kindergarten ready to learn, based on
"physical well-being, social confidence, emotional maturity, language richness, general knowledge, and moral awareness"; these responses were reported by state but not byrace)2 Low birthweight, a variable that has been identified as a predictor of poor performance in school,13 was obtained from the National Center for Health Statistics)4 The remaining child and household data were derived from the March Consumer Population Surveys (CPS) for the years 1988 through 1990.15 The measurement of percentblack (AFRAM) is straightforward, but the interpretation is complicated by correlation with many socioeconomic variables plus possible cultural biases in standardized tests.
The importance of household variables was emphasized by Coleman in 1966: "Variations in family background account for far more variation in school achievement than do variationsin school characteristics."'6 The percent of children living with only one adult is of interest
because of a rapid increase (5.5% in 1960, 14.8% in 1990') and concerns about the effects of this increase oil children. As more mothers enter the work
force, it
is important to examine the implications of this trend for children. To analyze this phenomenon, we focused on households where there is one adult male and one adult female, and calculated the percent of children living in these households where both adults work 20 or more hours per week. We also calculated the percent of children in households where both adults are in the labor force, but at least one works less than 20 hours per week. Most educational researchers believe that "a weak but statistically significant relationship exists between student poverty and academic achievement.• ta With one in five children currently living in poverty, it is important to consider the possible effect of this variable.Other child and household variables that were considered but found to have no independent statistically significant relation to MATHS included the percent of children who moved in the past year, who live in big cities, and who live in households where there are at least two adults, but no married couple. Also considered but not found to be statistically significant were the percent of mothers who received prenatal care, the number of children in Head Start as a percent of children in poverty, and median household income per person.
School variables include the student-teacher ratio in each stat&9 and the portion of state and local education revenues which came from the state.20 The portion of revenue from the state is of interest because it has increased substantially since 196821 and it is likely to continue to increase as taxpayers resist high property taxes and as the states seek greater equality of revenue across school districts. The increasing importance of state financing may lead to less local community involvement with the schools.
School variables which were considered but were not statistically significant included dollar revenue per student, the percent of children 9-13 in private school, and the percent of children ages 3 and 4 in preschool.
The state MATHS avenges for all races were regressed on the children, household, and school variables in a wide variety of specifications. Those regressions with the most explanatory power (highest R2s adjusted for degrees of freedom) are shown in Table 3. Their overall
explanatory power is very high; almost 90% of the variance in NAEP scores is explained by a relatively small set of. variables?2
In all specifications the most important determinant of MATHS is READY. It is the first variable to enter in stepwise regressions, always has a high level of statistical significance regardless of specification, and the absolute size of the effect is substantial. A change of one percentage point in READY
is
associated with a change of about .4 or .5 in the NAEP score. AFRAM is also always statistically significant (pc .01), but the size of the effect is not as large as READY. The coefficient for AFRAM varies from -.2 to -.3, depending on whetherLOWBWT is included or excludedY
STATSHR is the only schooling variable that is consistently significant (p< .Ol),24 but the size of the effect is small. The coefficient of-. £3 implies that an increase in STATSHR of ten percentage points would, ceteris paribus,
result
in a decrease of 1.3 points in MATH8. MOMDRP is statistically significant at Pc .05; its effect on MATHS is about one-half that of READY. BOTHWK, the onlyother variable that is statistically significant in manyspecifications, has apositive effecton
MATHS. Although
LOWBWF,POVRTY, and STU/TCH
figureprominently in many discussions of student achievement, they do not play a significant role in cross-state differences in MATHS, as may be seen in regressions (2) through (5).Determinants of Readiness to Learn in Kinder2arten
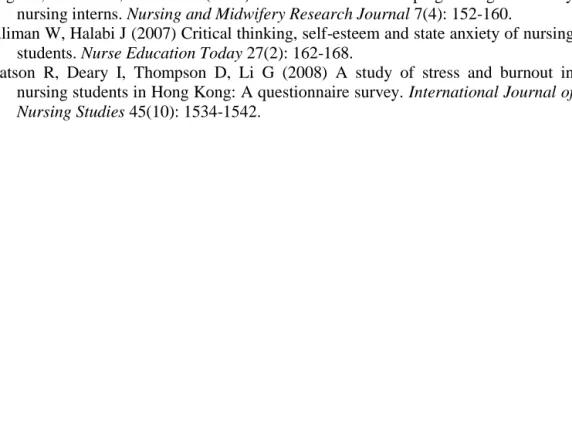
Readiness to learn merits particular attention. The scatter diagram (Figure 1) and the robustness of READY in the regressions show the strong relation between this variable and achievement in mathematics in eighth grade. In order to identify the factors associated with readiness to learn, READY was regressed on several variables, and those regressions with the
most explanatory power are shown in Table 4. We report the results of regressions weighted by number of children because READY was based on responses from fewer than 50 kindergarten teachers in one state. The coefficients are similar in the weighted and unweighted regressions, but the former yield higher adjusted R2s.
Either measure of mothers' education (MOMEI) or MOMDRP) was the first variable brought in by stepwise regressions and was always significant at the .01 level; MOMED gave slightly better results. If MOMED increases by one year, READY increases by about five percentage points. The percent of children living in single-adult households was always significant at least at the .05 level. An increase in ADULT 1 of 1 percentage point is associated
with a .5 percentage pointdecreasein READY.
This has serious
implications given the 9 percentage point increase in ADULTI since 1960.The percent of two-adult households where both adults work 20 hours per week and the percent of those households where both are in the labor force but at least one works less than 20 hours were frequently significant but in opposite directions. While a one percentage point increase in EOTHWK results in a decrease of about .25 percentage points in READY, a similar increase in BOTHLFX results in an increase of the same magnitude. Low birthweight has a ]arge but not statistically significant effect on READY. The percent of children in poverty has a very small and statistically insignificant coefficient when other variables (particularly MOMED and ADULT!) are included; AFRAM also has a small coefficient which is not statistically significant.
Racial Differencesin Achievement
Totestthe robustness of the MATHS regression results reported in Table 3, we estimated similar regressions for white students only (see Table 5)." Because READY was not reported by race, we used a predicted value for whites, estimated from the results of regression (1) in Table 4 applied to the levels of the variables for whites only.26 Qualitatively, the results for whites-only are similar to those for all races; the principal differences are a substantial increase in the coefficients for POVRTY and MOMDRP, a large decrease for AFRAM, and a modest
decrease for READY.
The regression results for MATHS for white students and for READY for all races provide significant insights concerning the white-black differential in MATHS, as shown in Table 6. First, we we see that there is a large racial differential in READY as predicted from
regression 1 in Table 4. This difference is attributable primarily to the large percentage of black children living with only one adult, and secondly to the greater education of white mothers. There are also racial differences in labor force status of two-parent families, but they have small and offsetting effects on READY.
The large racial difference in READY helps explain the large differential in MATHS. Equally important are the racial differences in MOMDRP, LOWBWT, and POVRTY. Using the coefficients from regression (5) in Table 5, the predicted white-black difference in MATHS is 25.6. The actual difference is 37.7. Thus, the differences between whites and blacks in the
children andhouseholdvariables shown in Table 6 explain two-thirds of the racial difference in mathematical achievement in eighth grade. Unmeasured socioeconomic differences and
segregated schools could account for some or all of the unexplained differential.
Conclusion
Multiple regression analysis of state data yields two important conclusions about mathe matical achievement in eighth grade. First, we find that the characteristics of children and the that households in which they live have much larger effects on NAEP test scores than do variables that measure school characteristics. Second, we find that white-black differences in the children and household variables account for most of the large white-black difference in NAEP test scores.
The most consistent predictors of interstate differences in mathematical achievement are the percent of children who enter kindergarten ready to learn and the percent of mothers who dropped out of high schobl. The percent of students who are black has a large, statistically significant negative relation with achievement in the all-races regressions; for whites-only the coefficient is much smaller, but still statistically significant. The only school-related variable that is statistically significant is a small negative effect of the share of school revenues supplied by the state. Both parents working in paid jobs has a positive effect on MATHS.
The observed difference in mathematical achievement between white and black students can be explained largely by differences in predicted readiness-to-learn in kindergarten, mother's education, low birthweight, and poverty. Readiness-to-learn in kindergarten is predicted primarily by mother's education (positive) and living in a one-adult household (negative).21 The extent of parental labor force participation in two-parent households is also relevant: when both parents work 20 or more hours per week the effect is negative; when both parents are in the labor force but at least one works fewer than 20 hours the effect is positive.
If a public policy goal is to increase achievement in mathematics, these results suggest that more emphasis be given to the pre-school years even if this requires re-allocation of resources from formal schooling. Unless there is a dramatic improvement in the circumstances of young children, there is little chance of achieving the nationally established goals that by the year 2000 "all children will come to school ready to learn" and "American students will be first in the world in math and science achievement."28
References and Notes
1. See, for instance, National Commission on Excellence
in Education, "ANation atRisk," 1983 report, in The
Great School Debate (Simon & Schuster,New York, 1985); A. D.
Bloom, The Closingof the American Mind (Simon&Schuster, NewYork, 1987); D. Ravitch
and C. Finn, What Do Our
17-Year-OldsKnow? (Harper & Row, New York, 1987); J. I.
Goodlad, P. Keating, eds., Access
toKnowledge: An Agenda for Our Nation's Schools (CollegeEntrance Examination Board, New York, 1990); T. Sowell, Inside American Education (Free
Press, New York, 1993).
2. SeeD. C. Berliner, "Mythology and the American System of Education," Phi Delta
Kappan 632-MO (April, 1993); C. C. Carson, R. M. Huelskamp, T. D. Woodall, "Perspectives
on Education in America, Sandia National Laboratories, The Journal of Educational Research,
259-310 (May/June 1993).3. College Entrance Examination Board, On Further Examination, Report of the
Advisory Panel on the Scholastic Aptitude Test Score Decline (College Entrance Examination Board, New York, 1977).4. For example, C. McKnight et al., The Underachieving Curriculwn: Assessing U.S.
School Mathematics from an International Perspective (Stipes, Champaign IL, 1987); D. F.
Robitaille, The lEA Studyof Mathematics II (Pergamon, New York, 1989).
5. V. R. Fuchs and 0. M. Reklis, "America's Children: Economic Perspectives and
Policy Options," Science 255, 41-46 (1992).6. See M. E. Orland, "Demographics of Disadvantage: Intensity of Childhood Poverty
and Its Relationship to Educational Achievement," ih Access to Knowledge: An Agenda for Our Nation's Schools, 1. 1. Goodlad and P. Keating, eds. (College Entrance Examination Board, NewYork, 1990). pp. 43-58; K. R. White, "The Relation Between Socioeconomic Status and
Academic Achievement" Psychological Bulletin, 91 #3, pp. 461.481 (1982).
7. R. D. Bock, "Designing the National Assessment of Educational Progress to Serve a
Wider Community of Users: A Position Paper," ERIC ED279 664, p. 1(1986).
8. Average scores are available for 41 states for all races and for whites and for 31 states
for black students, National Center for Education Statistics, NAEP 1992 Mathematics ReportCard for the Nation and the States (Educational Testing Service, Washington DC, 1993), pp. 10
and 20. The avenge state sample was 2,531; there were 1,934 test results in the state with the
smallest sample.
9. The low scores may be partly because the results are not made available to the students
or their teachers; this may reduce the incentive to perform well.
tO. NAEP 1992 Mathematics Report Card for the Nation and the States, p. 237.
Erratum: Below are revised pp 6 and 7 of Working
Paper #4784, "Mathematical Achievement
in Eighth
Grade: Interstate & Racial
Differences" by
Victor R. Fuchs and Diane Ii.
Reklis
witha .5 percentage point
decrease in READY. This has serious implications
given the 9
percentagepoint increase in ADULTI since 1960.
The percent of two-adult households where both adults work . 20 hours per wen and
the percent of those households where both
are in the labor force but at least one works less than 20 hours were frequently significant but in opposite directions. While a one percentage point increase in BOTRWK results in a decrease of about.25 percentage points in READY, a similar
increase in BOTHLFX results in an increase of thesame magnitude, Low birthweight has a large
but not statistically significant effectonREADY. The percent of children in poverty has a very small and statisticaJl, insignificant coefficient when other variables (pariicularly MOMED and ADVLTI) are included; AFRAM also has a small coefficient which is not statistically significant. Bacial Differences in Achieveme,ij
To test the robustness of the MAT}-18
regression results reported in Table 3, we estimated similar regressions for white students only (see Table 5),hl Because READY was not reported by race, we used a predicted value for whites, estimated from the results of regression (I) in Table 4 applied to the levels of the variables for whites
only." Qualitatively, the results for whites-only are similar to those for all races; the principal differences
are a substantial increase in
the coefficients for POVRTY and MOMDRP, a large decrease for AFRAM, and a modest decrease for READy,
The regression results for MATH8 for white students and for READY for all races provide significant insights concerning the white-black differential in MATHS, as shown in Table 6. First, we we see that there is a large racial differential in READY as predicted from
regression tin Table 4. This difference is attributableprimarily to the large percentage of black children livingwith only one adult, and secondly to the
greatereducation of white mothers.
There are also racial differences in labor force status of two-parent families, but they have small and offsetting effects on READY.
The large racial difference in READY helps explain the large differential in MATHS. rually important are the racial differences in MOMDRP and POVRTY. Using the coefficients from regression (3) inTable 5, thepredicted white-black difference in MATH8 is 20.9. The actual
Erratum: Below are revised pp 6 and 7 of Working
Paper #4784, "Mathematical Achievement in
Eighth
Grade: Interstate & Racial Differences"
by
Victor R. Fuchs and Diane M. Reklis
witha .5 percentage point decreasein READY. This has serious
implicationsgiven the 9 percentage point increase in ADULTI since 1960.
The percent
of
two-adult households where both adults work 2. 20 hours per weex andthe percent of those households where both are in the labor force but at leastone works less than 20 hours were frequently significant but in opposite directions. Whilea one percentage point increase in BOTHWK results in a decrease of about .25 percentage points in READY, a similar increase in BOTHLFX results iii an increase of the same magnitude. Low birthweight has a large but not statisticaJty significant effect on READY. The percent of children in poverty has a very
small and statisticail insignificant coefficient when other variables (particularly MOMED and ADULTI) are included; AFRAM also has a small coefficient which is not statistically significant.
Bacial Differences in Achievement
To test the robustness of the MATHS regression results reported in Table 3. we estimated siruiilar regressions for white students only (see Table 5)." Because READYwas not reported by race, we used a predicted value for whites, estimated from the results of regression (I) in Table 4 applied to the levels of the variables for whiles only!6 Qualitatively, the results for whites-only are similar to those for all races; the principal differences are a substantial increase in the coefficients for POVRTY and MOMDRP, a large decrease for AFRAM, and a modest decrease for READY.
The regression results for MATH8 for white students and for READY for allraces
provide significa,t insights concerning the white-black differential in MATH8, as shown in Table 6. First, we we see that there is a large racial differential in READY as predicted from
regression tin Table 4. This difference is attributable primarily to the large percentage of black children living with only one adult, and secondly to the greater education of white mothers. ihcre are also racial differences in labor force status of Iwo-parent families, but they have small and offsetting effects on READY.
The large racial difference in READY helps explain the large differential in MATHS. IRually important are the racial differences in MOMDRP and POVRTY. Using the coefficients from regression (3) in Table 5, the predicted white-black difference in MATHS is 20.9. The actual difference is 377. Thus, the differences between whites and blacks in the children and
household variables shown in Table 6 explain more than half of the racial difference in mathematical achievement in eighth•grade. Unmeasured socioeconomic differences and segregated schools could account (or some or all of the unexplained differential.
Conclusion
Muttipte regression analysis of stale data yields two important conclusions about niathemat-ical achievement in eighth grade. First, we find that Ihe average characteristics of children and th households in which they live have much larger effects on average NAEP testscores than do varia-bles that measure school characteristics. Second, we find that white-black differences in the chitdren and household variables account for much of the large white-black difference in NAEPtest scores.
The most consistent predictors of interstate differences in mathematical achievement are the percent of children who enter kindergarten ready 10 learn and the percent of mothers who dropped out of high school, The percent of students who are black has a large, statistically significant negative relation with achievement in the all-races regressions; for whiles-only the coefficient is much smaller, but stitl statisticalty signiFicant. The only schoot-related variabte that us statistically significant isa small negative effect of the share of school revenues supplied by the state. Both parents working in paid jobs has a positive cft'ect on MATH8.
The observed difference in mathematical achievement between while and black students can be explained largely by differences in predicued readiness-to-learn in kindergarten, mothcr's education, and poverly. Readiness-to-learn in kindergarten is predicted primarily by mother's education (posilive) and living in a otie-adult household (negative)." The extent of parental labor force participation in two-parent households is also relevant: when both parents work It)or
more hours per week the effect is negative; when both parents are in the labor force hul at least one works fewer than 20 hours the effect is positive.
If a public policy goal is to increase achievement in mathematics, these results suggest that more emphasis be given to the pre-school years even if this requires re-allocation of resources from formal schooling. Unless there is a dramatic improvement in the circumstances of young children, there is little chance of achieving the nationally established goals that by the
year 20(10 "all children wilt conic to school ready to learn' and 'American students will be First iii the world iii uiath and science achievement."''
Errata: This page was inadvertently omitted from NBER Working Paper 4784, "Mathematical Achievement in Eighth Grade: Interstate and Racial Differences," by Victor R. Fuchs and Diane K. Reklis. Please attach this sheet to appropriate page of
your copy.
Table 6. White—Black differences in determinants of READY
and
MATH8, 31 states.' Children 9—13 MOPIDRP AFRA?l 12.2 27.9 •STATSHR 14.8 22.7 BOTHWI( 52.8 55.4 POVRTY 48.1 46.2 Predicted NATII8C 274.0 Actual MATH8 271.2 —15.7 —7.9
—2.6
1.9 —31 .5For this analysis, we used only the 31 states where NAEP scores were reported for both black and white students.
We
weighted each state average for each
race by the number of 9- to l3—year—ojds of that race in our CPS
sample.
bEstimated from regression (1), Table 4.
'Estimated from regression (3) Table 5. Black Variable White Children c S MOMED 13.1 ADULT1 7.6 BOTMWK 36.0 BTHLFX 27.4 Predicted READYb 70.4 White minus black 12.0 30.2 42.5 32.3 54 .7 1.1 —22.6 —
6.5
—4.9
15.7 253.1 236.5 20.9 37 .711. Ibid.,
p.236.
12. E. L. Boyer, Ready
to Learn: A Mandate for the Nation (CarnegieFoundation for the Advancement of Teaching, Princeton NJ, 1991).13. M. C. McCormick et ab, 'Vei•y Low Birth Weight Children: Behavior Problems
and School Difficulty in a National Sample," TheJournal of Pediatrics 117,No. 5,
pp. 687-693(1990); H. Corman and S. Chaikind, 'The Effect of Low Birthweight on the Health, Behavior,
and School Performance of School-Aged Children," NBER Working Paper 4409 (1993);Department of Education, "Preparing Young Children for Success: Guideposts for Achieving
Our First National Goal. An America 2000 Education Strategy" ERIC ED339 504 (1991).
14. National Center for Health Statistics, Health,
United States (U.S. GovernmentPrinting Office, Washington DC, 1991 p. 133; 1988 p. 48).
15. Bureau of the Census, Current Population Survey, public use tapes, 1988-1990.
16. J. S. Coleman etal., Equality
of Educational Opportuniry (U.S. Goveriiment PrintingOffice, Washington DC, 1966), p. 218.
17. Calculated from 1960 U.S. Bureau of the Census, 1/1000 Sample, and 1990 March
Current Population Survey for all children underage18.18. M. E. Orland, p. 45.
19. Enrollment K-12 divided by the number of teachers, National Center for Educational
Statistics, Digestof Educational Statistics, (U.S.Government Printing Office. Washington DC,1992).
20. Bureau of the Census, StatisticalAbstract
of the United States (U.S.Government Printing Office, Washington DC, 1992 #239, 1991 #244, 1990 #236, 1989 #229, 1988 #2 17).21. K. K. Wong, "Fiscal Support for Education in American States: The
'Parity-to-Dominance' View Examined," AmericanJournal of Education 97,No. 4, 329-359 (1989).
22. When the regressions were run in weighted form (the number of children in each
state used as weights) the results were very similar to those shown in Table 3, and the overall explanatory power was about the same.23. When all other variables are excluded the coefficient for AFRAM is .5.
24. STUITCH achieves statistical significance (p< .05) if STATSHR and BOTHWK are
both excluded. The coefficient for S11J/TCH, -.5,
isquite small. It implies that a reduction of
two students in the student/teacher ratio would result in an increase of only one point in the NAEP mathematics score.25. Cross-state regressions for black students are not reliable because of small sample
size in several states.Errata: This page was inadvertentiy omittedfrom NBER Working Paper 4784. "Mathematical Achievement in Eighth Grade; Interstate and Racial Differences," by Victor R. Fuchs and Diane M. Reklis. Please attach this sheet to appropriate
page of your copy.
Table 6. White-Black differences in
determinants of READY and
MATH8, 31 states.'
Variable White
Black White minus
black Children < S MOMED 13.1 12.0 1.1 ADULT1 7.6 30.2 —22.6 BOTHWK 36.0 42.5 —
6.5
BTFILFX 27,4 32.3 —4.9
Predicted READ? 70.454
15.7 Children 9_i) MOMDRp 12.2 27.9 -15.7 14.3 22.7 —7.9
STATSHR 52.855,
—2.6
BOTIIWK 48.1 46.2 1.9 POVRTY 10.2 41,8 —31.5 Predicted MATl8 274.0 253.1 20.9 Actual MATHs274.2
2)6.5 37.7'For this analysis, we
used only the 31 states where NAEP sc?res were reported for both
black and white students. We
weighted each state
average for each race by the number of 9— to l)—year—oia5 of that race in our cps Sample.
bEstimated from regression
(1), Table 4.
'Estimated from regression
290
285
• U
a
280
• UI
c 275
C)
C)
•
'1270
•
U
U) ci)U
U
265
U
U
o
.
ffi260
.a U
••
C
.
.
Z
25&
a
.
250
U24&
U
24O
I50
60
65
70
80
85
percent ready to learn, 1990
Figure
1. Scatter diagram of mathematics achievement in eighth grade
and readiness to learn in kindergarten, 41 states.
26. READY was estimated for white, black, and others using the regression coefficients and the state averages for each variable and racial group. Each value was then adjusted by the factor for that state which would equate the weighted avenge of the three estimated values of READY to the observed value for that state.
27. Some reformers advocate delaying entry to kindergarten in order to increase the percent of children ready to learn. However, this would probably increase the disparity among children as parents with more education and more resources would be likely to substitute other learning experiences for early kindergarten, whereas parents with fewer options might settle for custodial care.
28. National Education Goals Panel, The National Education Goals Report, Building a Nation of Learners (Government Printing Office, Washington DC, 1992).
Table 2. Explanatory variables used in regressions.
A. Child and household variables:
READY Percent of children ready to learn in kindergarten as assessed subjectively by
kindergarten teachers, 1990.
LOWBWT Percentof children born C 2500 grams!
MOMDRP
•
Percentof children whose mothers completedless than 12 years of education. MOMED * Meannumber of yearsof education of children's mothers.ADULTI * Percentof children livinginhouseholds with onlyone adult.
BOTI-IWK * Percentof children living in householdswithone adult maleandone adult female
whereboth adultsworkat paid jobsat least 20hoursper week.
BTHLFX
•
Percentof children living in householdswithoneadultmaleand one adultfemalewhere both adults are inthe labor force, but atleastoneworkslessthan20
hours per week.
POVRTY *
Percentof children living in poverty.-AFRAM * Percentof children classified as black, non-Hispanic.
B. School variables:
STUITCH Student-teacher ratio, Kl2.b
STATSHR Percent of
state andlocal revenuetopublic elementary andsecondaryschools which comes fromstate sources.L* Thesevariahles havedifferent values for different age groups and different racial groups. MATHSregressionsuse data forchildrenages 9 to 13; READY regressions use data forchildren five years ofage.
LOWBWT in the MATHS regressions is based on births from 1977 to 1979; LOWBWT in the READY
regressions on births from 1984 to 1986.
b5.pJfl and STATSHR are 5-year avenges, 1986-1990.
Table 1. Percent distribution of states by mathematical achievement in
eighth grade, 1992.
Mean
NAEF scores All races
tlnweighted WhiteC BlackC W All
races
eightedb Whitec Zlackc 281 to 284 7.3 17.1 4.9 16.1 277 to 280 9.8 22.054
24.3 273 to 276 9.8 26.8 6.3 37.5 269 to 272 14.6 12.2 16.4 6.3 265 to 268 17.1 9.8 22.0 8.0 261 to 264 9.8 9.8 11.0 5.7 257 to 260 22.0 2.4 27.6 2.1 253 to 256 2.4 1.8 249 to 252 4.9 3.2 2.8 0.2 245 to 248 2.4 3.2 1.8 0.6 241 to 244 41.9 30.7 237 to 240 16.1 15.5 233 to 236 16.1 21.8 229 to 232 19.4 31,2 Median 267 275 240 266 276 236 Mean 266 274 239 266 275 236 Standard deviation 9.1 6.6 5:2 7.8 5.9 4.7aBased on 41 states for all races and whites; 31 states for blacks.
bRy population
ages
9-13, 1988 to 1990. °Non}iispanicTable 4. READY regression results, 50 states, all races.a (1) (2) (3) (4) (5) MOMED 4.91 (1.08) ** 4,73 (1.07) ** 4.76 (1,52) ** 4.80 (1.08) ** 5.01 (1.52) ** ADULT1 -.57 (.15) ** -.41 (.18) * -.56 (.19) ** -.48 (.18) * -.44 (.21) * BTHWK - .27 (.08) ** - .24 (.08) ** - .27 (.08) **
- 24
(.08) ** - .25 (.09) ** BTHLFX .26 (.10) * .21 (.11) .26 (.11) * .23 (.11) * .20 (.11) L0WWT -LOB (.65) -1.26 (1.01) POVRTY - .02 (.13) .03 (.14) AFRAN -.06 (.06) .01 (.08) Constant 14.70 (12.23) 22.38 (12.87) 16.74 (18.74) 15.24 (12.22) 19.81 (19.60) R2 .630 .652 .630 .639 .652 Adjusted R2 397 .612 .588 .598 .594*
** p<_01
Weighted by number of children 5 years of age, 1988 to 1990 Current
Population Surveys
Table 3. MATH8 regression results, 41 states, all races (standard errors in parentheses). (1) (2) (3) (4) (5) READY .49 .41 .48 .48 .40 (.12) (.13) (.13) (.13) (.13) **
**
**
**
**
AFRA24 -.30 -.23 - 31 -.31 -.23 (.04) (.06) (.05) (.04) (.07) ****
**
**
**
STATSHR -.13 -.13 -.13 -.13 -.13 (.04) (.04) (.04) (.04) (.05) ****
**
**
**
MOMDRP -.24 -.24
-.25 -.25 -.25 (.09) (.09) (.10) (.09) (.10) -*
*
*
*
*
BOTHWIC .24 .21 .25 .26 .21 (.09) (.09) (.10) (.09) (.10) ***
*
**
LOWBWT -1.43 -1.47 (37) (.85) POVRTY .02 .02 (.12) (.12) STU/TCH .12 -.04 (.26) (.27) constant 237.6 253.7 237.5 236.0 254.6 (11.9) (14.4) (12.0) (12.5) (16.4) .899 .908 .899 .900 .908 Adjusted R2 .885 .892 .881 .882 .886 * p<.O5 ** p<.01 14Table 5. MATH8 regression results, 41 states, whites only
(standard errors in parentheses).
(1) (2) (3) (4) (5) READY .32 (.10) ** .31 (.10) ** .34 (.10) ** .32 (.11) ** .34 (.10) ** AFRAM - .09 (.04) * - .10 (.04) * - .11 (.04) ** - .09 (.04) * - .11 (.04) ** STATSHR - .12 (.03) ** - .11 (.03) ** -.08 (.04) * - .11 (.04) ** - .07 (.06) HOMDRP -.49 (.11) ** -.47 (.11) ** -.42 (.11) ** -.49 (.11) ** -.41 (.11) ** BOThW}( .20 (.07) ** .19 (.07) ** .17 (.07) * 19 (.08) * .16 (.07) * LOWBWI - .85 (.64) - .79 (.63) ?OVRTY - .24 (.12) * - .22 (.12) STIJ/TCH - .07 (.23) -12 (.22) Constant 255.5 (9.7) 260.5 (10.4) 255.5 (9.3) 256.6 (10.4) 262.0 (10.8) R2 .845 .853 .862 .846 .869 Adjusted R2 .823 .827 .538 .818 .836 * pC.O5 **