HEALTH
PERSPECTIVES
Exposure-Response Estimates for Diesel Engine Exhaust
and Lung Cancer Mortality Based on Data from Three
Occupational Cohorts
Roel Vermeulen, Debra T. Silverman, Eric Garshick,
Jelle Vlaanderen, Lützen Portengen, and Kyle Steenland
http://dx.doi.org/10.1289/ehp.1306880
Received: 2 April 2013
Accepted: 21 November 2013
Advance Publication: 22 November 2013
http://www.ehponline.org
ehp
ExposureResponse
Estimates
for
Diesel
Engine
Exhaust
and
Lung
Cancer
Mortality
Based
on
Data
from
Three
Occupational
Cohorts
1 2 3 1,4 1
Roel Vermeulen, Debra T. Silverman, Eric Garshick, Jelle Vlaanderen, Lützen Portengen, and Kyle Steenland5
1
Division of Environmental Epidemiology, Institute for Risk Assessment Sciences, Utrecht University, Utrecht, the Netherlands; 2Occupational and Environmental Epidemiology Branch, Division of Cancer Epidemiology and Genetics, National Cancer Institute, Bethesda, Maryland, USA; 3Pulmonary and Critical Care Medicine Section, Medical Service, Veterans Affairs Boston Healthcare System; Channing Division of Network Medicine, Brigham and Women’s Hospital; Harvard Medical School, Boston, Massachusetts, USA; 4Section of Environment and Radiation, International Agency for Research on Cancer, Lyon, France; 5Department of Environmental and Occupational Health, Rollins School of Public Health, Emory University, Atlanta, Georgia, USA
AddresscorrespondencetoRoel Vermeulen, Yalelaan 2, 3584 CM Utrecht, the Netherlands. Telephone: +31302539448. Fax: +31302539449. Email: [email protected]
Runningtitle:Exposureresponse diesel exhaust and lung cancer
Acknowledgments:RV and KS designed the study, performed analysis and interpretation of the data, and drafted the manuscript, tables, figures and supplemental materials. RV and KS had full access to all data in the study and take responsibility of the data and the accuracy of the data analysis. JV and LP participated in the analysis and interpretation of data, and critically reviewed the manuscript. DS and EG participated in the interpretation of data and writing of the
ConflictsofInterest:None of the authors has conflicts of interest related to this work. EG, KS, and RV participated as part of the Working Group in the evaluation of the carcinogenicity of DEE by the International Agency for Research on Cancer, Lyon, France (June, 2012).
Abstract
Background: Diesel engine exhaust (DEE) has recently been classified as a known human carcinogen.
Objective:To derive a metaexposureresponse curve (ERC) for DEE and lung cancer mortality and estimate lifetime excess risks (ELRs) of lung cancer mortality based on assumed occupational and environmental exposure scenarios.
Methods:We conducted a metaregression of lung cancer mortality and cumulative exposure to elemental carbon (EC), a proxy measure of DEE, based on relative risk (RR) estimates reported by three large occupational cohort studies (including two studies of workers in the trucking industry and one study of miners). Based on the derived risk function, we calculated ELRs for several lifetime occupational and environmental exposure scenarios, and also calculated the fractions of annual lung cancer deaths attributable to DEE.
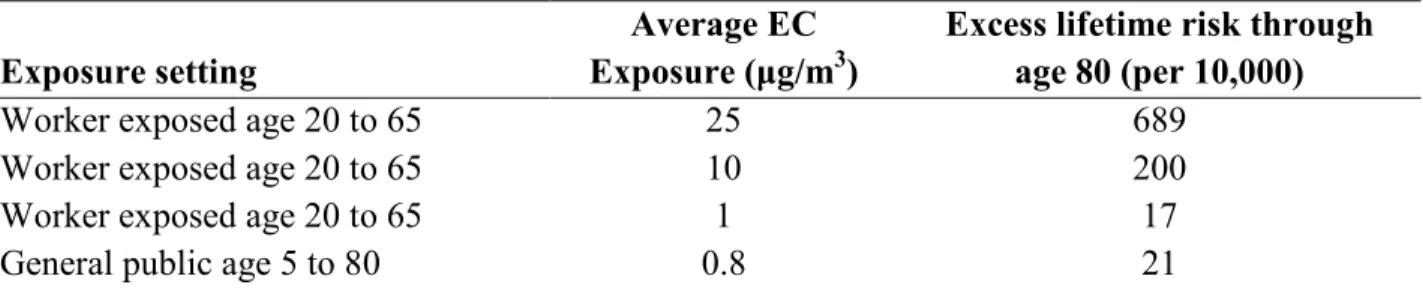
Results: We estimated a lnRR of 0.00098 (95% CI: 0.00055, 0.0014) for lung cancer mortality with each 1µg/m3year increase in cumulative EC based on a linear metaregression model. Corresponding lnRRs for the individual studies ranged from 0.00061 to 0.0012. Estimated numbers of excess lung cancer deaths through age 80 for lifetime occupational exposures of 1, 10, and 25 µg/m3 EC were 17, 200, and 689 per 10,000, respectively. For lifetime environmental exposure to 0.8 µg/m3 EC, we estimated 21 excess lung cancer deaths per 10,000. Based on broad assumptions regarding past occupational and environmental exposures we estimate that approximately 6% of annual lung cancer deaths may be due to DEE exposure.
Conclusions: Combined data from three US occupational cohort studies suggest that DEE at levels common in the workplace and in outdoor air appear to pose substantial excess lifetime risks of lung cancer, above usually acceptable limits in the US and Europe, which are generally
set at 1/1,000 and 1/100,000 based on lifetime exposure for the occupational and general population, respectively.
Introduction
Recently, a Working Group of the International Agency for Research on Cancer (IARC) Monograph Series reviewed the scientific evidence regarding the carcinogenicity of diesel engine exhaust (DEE). The Working Group concluded that DEE is a cause of lung cancer (Group 1: carcinogenic to humans) based on human, animal and experimental evidence (Benbrahim Tallaa et al. 2012). Given that large populations of workers are exposed to DEE in the workplace and that urban populations are exposed to low levels of DEE in the ambient environment, the potential public health impact of DEE exposure may be considerable. For example, Rushton et al. (Rushton et al. 2012) recently estimated that occupational DEE exposure in the United Kingdom was the third most important occupational contributor to the lung cancer burden after asbestos and silica exposure.
At the time of the IARC evaluation, three US occupational cohort studies of cumulative exposure to elemental carbon (EC; a marker of DEE) and lung cancer mortality had reported exposure response estimates, including a study of nonmetal miners (198 lung cancer deaths) (Attfield et al. 2012; Silverman et al. 2012), and two independent studies of trucking industry workers (779 and 994 lung cancer deaths, respectively) (Garshick et al. 2012; Steenland et al. 1998). A fourth cohort study of potash miners (68 lung cancers) with EC exposureresponse data was published after the IARC evaluation (Mohner et al. 2013). To clarify the public health impacts of DEE exposures, we conducted a formal metaregression to derive an exposureresponse estimate for cumulative elemental carbon and lung cancer mortality, and used it to estimate excess lifetime lung cancer mortality for environmental and occupational exposures and attributable fractions of lung cancer deaths due to DEE.
Material
and
Methods
Data
We performed, as part of the IARC evaluation, a detailed literature search using MEDLINE. Search terms included: “diesel,” “elemental carbon,” and “lung cancer.” The reference lists of candidate studies and review articles were also manually examined to find any additional relevant studies. Studies were included in the metaregression i) if DEE exposure was expressed as cumulative EC in the exposureresponse analyses, ii) if an appropriate unexposed/low exposed reference group was used and iii) if no major methodological shortcomings were noted. The great majority of studies did not include quantitative exposureresponse data. There were only three studies identified that met our criteria (Garshick et al. 2012; Silverman et al. 2012; Steenland et al. 1998). One additional study, with quantitative exposureresponse data was published after the IARC evaluation and initial literature search (Mohner et al. 2013).
We excluded this study because the mean cumulative EC exposure in the reference exposure category (624 µg/m3years) was higher than almost all of the nonreference exposure categories of the other studies, the cohort included only 68 lung cancer deaths, and the derivation of the EC exposure metric was not described in detail. In addition, there were concerns about the method used to adjust for previous employment in uranium mining since the results are dramatically different from an earlier analysis of the same data (NeumeyerGromen et al. 2009). However, we did include data from Mohner et al. in a sensitivity analysis of the obtained ERC (see Supplemental Material), with and without a correction of the reported relative risk estimates for the high level of exposure in the referent group in that study.
For the three studies included in the primary metaregression, we extracted categorical RRs (hazard ratios, or odds ratios) from the main analyses presented by the authors of each study. For the Steenland et al. nested casecontrol study of trucking industry workers, we used odds ratios (ORs) for cumulative EC exposure categories with a 5year lag (Steenland et al. 1998). The Steenland et al. study included 994 lung cancer deaths and 1,085 controls. All cases and controls had died in 1982–1983, and were longterm Teamsters enrolled in the pension system. Subjects were divided into job categories based on the longest held job. In 19881989, submicron EC was measured in 242 samples covering the major job categories in the trucking industry. Estimates of past exposure to EC, for subjects in the epidemiologic study were made by assuming that i) average 1990 levels for a job category could be assigned to all subjects in that job category, and ii) levels prior to 1990 were directly proportional to vehicle miles traveled by heavy duty trucks and the estimated emission levels of diesel engines.
For the Garshick et al. cohort study of trucking industry workers, we used HRs for cumulative EC exposure categories with a 5year lag based on analyses that excluded mechanics (Garshick et al. 2012). In the Garshick et al. study, work records were available for 31,135 male workers employed in the unionized U.S. trucking industry in 1985. Mortality was ascertained through the year 2000 and included 779 lung cancer deaths. From 2001 through 2006 a detailed exposure assessment was conducted (> 4000 measurements) that included personal and workarea sub micron EC measurements covering the major job categories in the trucking industry. Exposure models based on terminal location in the US were developed. Historical trends in ambient terminal EC were modeled based on historical trends in the coefficient of haze (a measurement of visibility interference in the atmosphere). In addition to changes in ambient exposure, the historical model accounted for changes in jobrelated exposures based on a comparison of EC
measurement data obtained in 1988 through 1989 to the newly collected EC measurements. We used the risk estimates from analyses that excluded mechanics as mechanics in the Garshick et al. study experienced significant historical changes in job duties that weakened the validity of extrapolation of the current exposure to historical estimates. In addition, the nature of exposure (intermittent exposure) was thought to be different from that of the other workers in study (longer periods of jobrelated exhaust exposure). However, as discussed below, we did include data from Garshick et al. including the mechanics in a sensitivity analysis of the obtained ERC (see Supplemental Material).
For the nested casecontrol miner study of Silverman et al., we used ORs for cumulative EC with a 15year lag; we chose to use risk estimates from the nested casecontrol study instead of estimates from the cohort analysis (Attfield et al. 2012), because of control for confounding, particularly from smoking, in the nested casecontrol study. The casecontrol study was nested within a cohort of 12,315 workers in eight nonmetal mining facilities and included 198 lung cancer deaths and 562 incidence density – sampled control subjects. Respirable elemental carbon was estimated for each surface and underground job from year of introduction of dieselpowered equipment in the facilities to December 31, 1997. Between 1998 to 2001, a detailed exposure assessment was conducted measuring personal respirable EC levels (> 700 measurements) covering the majority of jobtitles in the facilities. These estimates were backextrapolated for underground jobs per mine based on historical carbon monoxide measurement data, and DEE related determinants (e.g., diesel engine horsepower and ventilation rates).
Metaregression
From the three studies, we extracted studyspecific categorical RR estimates for lung cancer mortality in association with different cumulative diesel exhaust exposure levels relative to the lowest category of exposure for each study (see Supplemental Material, Table S1). We used the midpoint of the range of each exposure category as a specific estimate of the cumulative exposure for each RR. For the highest exposure category, we calculated the midpoint as 5/3 times the lower bound of the category, as proposed by the Unites States Environmental Protection Agency in 2008 (Lenters et al. 2011). However, for the Silverman et al. study, we obtained the median cumulative exposure value for the upper category (personal communication, DT Silverman).
The metaregression models applied consisted of a full linear model and a separate model that
th th th
incorporates a natural spline function with prespecified knots at the 20 , 50 , and 80 percentiles.
The models can be described as:
2 2 2
lnRR = β0 + β1(exposure) + σu0 + σu1 + σe0
where β0 is the common intercept across studies, β1 is the common linear slope or spline function associated with DEE exposure across studies, σu02 is the estimated variance of the intercept between studies, σu12 is the estimated variance of the slope between studies and σe02 is the variance of the individual risk estimates. [For the spline models an additional spline variable was estimated by using third order polynomials to fit a nonlinear slope (Harrell 2001)].
In these models, the natural logarithm (ln) of each study RR was inversely weighted by its variance, and correlations among the categoryspecific RRs from each individual study were
accounted for by estimating their covariance (Greenland and Longnecker 1992). To account for potential betweenstudy heterogeneity, the regression models allowed for random studyspecific intercepts and exposure effects.
Sensitivity analyses
The metaregression was repeated in a series of sensitivity analyses that used alternative data from one of the three studies while keeping the information from the other two studies unchanged from the main analysis, as described in Supplemental Material, Table S2. For the Garshick et al. study (Garshick et al. 2012) we used HRs from unlagged analyses and from analyses using a 10year lag (versus 5 years for the main analysis), and performed a third sensitivity analysis using HRs based on analyses that included mechanics (5year lag). For the Silverman et al. study (Silverman et al. 2012), we used ORs based on unlagged data (versus a 15 year lag for the main analysis) and performed a second sensitivity analysis with the OR for the highest quartile of exposure (15year lag) excluded. For the Steenland et al. study (Steenland et al. 1998) we performed one sensitivity analysis based on ORs for unlagged exposures (versus a 5year lag).
In addition, we performed two sensitivity analyses that included estimates from the Mohner et al. study (Mohner et al. 2013), including one using HRs from the original cohort analysis, and a second using ORs that were corrected for the high level of DEE in the referent exposure group (624 µg/m3 EC). This correction was made under the assumption that the OR for the Mohner et al. referent category could be adjusted upward based on the RR predicted for an average exposure of 624 µg/m3 according to the main metaanalysis (specifically, to OR = 2.0), and that
this adjusted reference OR could be used to recalibrate the nonreference effect estimates and standard errors.
Excess lifetime risk calculations
The excess lifetime risk (ELR) of lung cancer mortality associated with exposure to DEE was estimated using life table techniques accounting for allcause mortality, applying an adaptation of the method described in a 1988 report by the Committee on the Biological Effects of Ionizing Radiation (Council 1988). ELR was calculated through age 80 according to several different exposure scenarios. For occupational exposure, we assumed an exposure from age 20 to 65, as typically done in occupational risk assessment, with average EC exposures of 25, 10, and 1 µg/m3. In addition, we estimated the ELR for environmental exposure from birth to age 80 to an average EC exposure of 0.8µg/m3. All exposures were lagged 5years. Average occupational EC exposures of 25 µg/m3 have been described for diesel mechanics, 10 µg/m3 for construction workers, and 1 µg/m3 for professional drivers (Pronk et al. 2009). Average ambient air EC levels of 0.8 µg/m3 have been reported for metropolitan areas (Gan et al. 2013).
Background allcause mortality (both sexes combined) were obtained from US vital statistics for 2009 (http://wonder.cdc.gov) and used to estimate the probability of surviving each 5year age interval. In addition, we obtained lung cancer mortality rates for 2009 (http://wonder.cdc.gov) that were stratified by 5year age groups and used to estimate the cumulative probability of dying from lung cancer in each 5year age interval, conditional on not dying from other causes. These agespecific probabilities of lung cancer mortality were then summed across age groups to estimate the background lifetime (up to age 80) risk of dying from lung cancer in the absence of exposure to DEE. Next we estimated agespecific probabilities of lung cancer mortality in
populations with occupational or environmental DEE exposure by multiplying each agespecific background lung cancer mortality rate by the RR from our primary exposureresponse meta analysis for the cumulative occupational or environmental DEE exposure level estimated for that age group. We estimated cumulative exposures for each age group assuming a constant exposure intensity (at the level assumed for the exposure scenario being evaluated) that accumulated daily, with a 5year lag (e.g., exposure started at age 25 for occupational exposure and at age 5 for environmental exposure). We chose a 5year lag for our ELR analysis because a 5year lag was reported to provide the best fitting model by two of the three studies. As for the unexposed population, we summed the agespecific probabilities of lung cancer mortality to estimate the lifetime (up to age 80) risk of dying from lung cancer among those exposed to DEE. Finally, we derived the ELR as
ELR = (riskunexposed – riskexposed) / (1 – riskunexposed),
where riskexposed and riskunexposed represent the estimated lifetime risks of lung cancer mortality
among those with and without DEE exposure, respectively. In addition to estimating ELRs for occupational exposures from age 20–65, consistent with assumptions commonly used for regulatory purposes (REF) we also derived ELRs for shorter occupational exposure scenarios (10 and 20 years with start of exposure at age 20).
Estimated proportion of lung cancer deaths attributable to DEE
We used the RRs derived from the metaregression at age 70, to estimate the attributable fraction (AF) of lung cancers due to everexposure to DEE either in the environmental or occupational setting, in the two countries (US and the UK), where we had data on the proportion of the
We estimated the attributable fraction (AF) of lung cancer mortality due to environmental exposure at age 70, the approximate median age of lung cancer mortality in the US in 20062010 (http://seer.cancer.gov/statfacts/html/lungb.html). Information on environmental exposures is limited, but we assumed an average ambient EC concentration of 0.8 µg/m3 as estimated by Gan et al. (2013) for metropolitan Vancouver, Canada for 1994–1998. An average exposure of 0.8 µg/m3 would result in a cumulative exposure at age 70 of 54µg/m3years, after accounting for a 5year lag. Based on the metarisk function, we can predict for the exposed a RR of 1.05. We then estimated the AF as follows
AF = (riskexposed – riskunexposed) / riskexposed,
which is equivalent to
AF = (RR – 1) / RR, (Steenland and Armstrong 2006).
To estimate the attributable fraction (AF) of lung cancer mortality due to occupational exposures at age 70, we assumed that approximately 5% (12 million/230 million) of the adult US population has been occupationally exposed to DEE based on data for the US (Driscoll et al. 2005) that has recently been updated (personal communication Dr. T. Driscoll, Sept 2012). Similarly, we assumed that 5% of the adult UK population is or has been occupationally exposed to DEE based on an estimate derived by other investigators using similar methodology (Brown et al. 2012).
Cherrie et al (2011), estimated that 80% of the diesel exposed workers in the European Union can be regarded as low exposed while 20% would be regarded as high exposed workers (e.g., workers in mining, construction, and diesel mechanics). Based on the work of Pronk et al.
(2009), Cherrie et al. estimated that the EC exposure concentrations in this high exposed group would be on average 13 µg/m3 (Cherrie et al. 2011). Assuming an overall lognormal distribution with a GSD of 3.0, we estimated the EC exposure for the low group to be 3 µg/m3 (Kromhout et al. 1993). Average occupational exposures of 3 µg/m3 and 13 µg/m3 from age 20–65 would result in cumulative exposures of 135 and 585 µg/m3years at age 70 (using a 5year lag). As for environmental exposures, to derive RRs for each exposure group, we multiplied the cumulative exposure (54 µg/m3years by age 70) by the slope factor from our metaregression analysis for a 1µg/m3 increase in cumulative exposure. We estimated the AF for occupational exposures at multiple levels of exposure as
AF = Σpi(RRi 1) / [Σpi(RRi 1) + 1]
(Steenland and Armstrong 2006), where p represents the proportion of the general adult population with cumulative exposure to DEE at level i, and RRi represents the RR associated with cumulative exposure at level i (i.e., the metaanalysis RR × i).
Results
The ten extracted risk estimates from the three cohorts studied covered a cumulative exposure range, based on midpoints of the categories, from 37 to 1036 µg/m3years (see Supplemental Material, Table S1). The linear model (Figure 1) and the spline metaregression model (data not shown) fit the data well, with virtually equivalent curves. Therefore, we present only the linear curve, as it is a more parsimonious model with a lower Akaike Information Criterion (AIC; 9.9 versus 22.4, respectively). Slope factors (i.e., the lnRR estimated for a 1µg/m3year increase in
confidence intervals largely overlapped (Table 1). The combined slope estimate was 0.00098 (95% CI: 0.00055, 0.00141).
Combined slope estimates based on the sensitivity analyses were generally consistent with the primary estimate, ranging from 0.00061 (95% CI: 0.00019 – 0.00103) when data from the Silverman et al. (2012) study of miners were unlagged, to 0.0011 (95% CI: 0.00040, 0.00172) when the RR for the highest quartile of exposure in Silverman et al. was excluded (see Supplemental Material, Table S3 and Figure S1). Combined estimates also were similar when data from the Mohner et al. (2013) study were included in the metaanalysis.
For occupational exposures of 25, 10, and 1 µg/m3 EC over 45 years, assuming a 5year lag, we estimated excess lifetime lung cancer mortality of 689, 200, and 17 deaths per 10,000 individuals (Table 2). For environmental exposures, assuming an average exposure of 0.8 µg/m3 over 80 years (with a 5year lag), we estimated 21 excess lung cancer deaths per 10,000 individuals. Corresponding estimates for occupational exposures over 20 years were 252, 87, and 8 deaths per 10,000, and for occupational exposures over 10 years were 112, 41, and 4 deaths per 10,000.
For average occupational exposures of 3 µg/m3 and 13 µg/m (Kromhout et al. 2000) 3, the corresponding RRs at age 70, from our regression results, are 1.14 and 1.78 respectively. The RR for an average environmental exposure of 0.8 µg/m3 at age 70 is 1.05. Combining these RRs with the estimated proportions of the population exposed, we estimated attributable fractions (AF) of lung cancer deaths at age 70 years due to environmental and occupational DEE exposures in the US and UK to be 4.8% and 1.3%, respectively. Combining the AFs for environmental and occupational exposures results in an overall AF of approximately 6% in the US and the UK,
which translates to about 9,000 annual lung cancer deaths in the US, and 2,000 annual lung cancer deaths in the UK, that may be attributable to DEE.
Discussion
Diesel engines were initially used predominantly to power heavy duty equipment, with trains converting to diesel locomotives mainly after World War II (Laden et al. 2006) and with heavy duty trucks converted to diesel primarily during the mid to late 1950s (Davis et al. 2011). Dieselization of equipment in underground mines occurred mostly in the 1960s – 1970s (Stewart et al. 2010). Diesel engines also are used in automobiles, especially in Europe. Large groups in the general population living in urban areas or close to highways are exposed to DEE, albeit to lower levels than in most occupational settings (Pronk et al. 2009; Gan et al. 2013). Given that DEE is classified as a known human carcinogen (BenbrahimTallaa et al. 2012), the impact of both occupational and environmental exposures on the overall lung cancer burden is potentially significant.
Currently elemental carbon is regarded as the best available proxy measure of DEE exposure in occupational settings (Birch and Cary 1996). We identified four studies that expressed the risk of lung cancer mortality by cumulative EC exposure. Of these studies, we retained three studies in the metaregression and excluded one study because of methodological shortcomings. The retained studies were a study of nonmetal miners (Silverman et al. 2012), and two independent studies of trucking industry workers (Garshick et al. 2012; Steenland et al. 1998).
0.00187), and confidence intervals largely overlapped among the individual estimates. Furthermore, results of sensitivity analyses based on alternative results (e.g. using different exposure lags) from the individual studies, and inclusion of data from a study of potash miners (Mohner et al. 2013), which ranged from lnRR 0.00061, 0.0011 for a 1µg/m3year increase in EC, were not substantially different from our main estimate of 0.00098 (95% CI: 0.00055 0.00141). Hence, our estimated slope factor appeared to be relatively robust.
Interestingly, our slope estimate is roughly consistent with the risk of lung cancer mortality related to longterm populationbased exposure to EC previously estimated by Janssen et al. based on a conversion of black smoke to EC for two European studies (Janssen et al. 2011). Specifically, compared with no DEE exposure, the RR for a lifetime exposure at an average of 0.8 µg/m3 based on Janssen et al. would be ~ 1.03, compared with RR = 1.05 [exp(0.000982 × 70 yrs × 0.8 µg/m3)] based on our slope estimate (75 years exposure, 5year lag).
We estimated excess lung cancer deaths per 10,000 individuals for lifetime environmental exposure and for average lifetime occupational exposure levels between 1 to 25 µg/m3. Estimated numbers of excess lung cancer deaths for occupational exposures of 45 years ranged from 17 to 689 per 10,000. These ELRs exceed US Occupational Safety and Health Administration (OSHA) and EU Scientific Committee on Occupational Exposure Limits
(SCOEL) typical goal of limiting ELR of disease for exposed workers to below 1/1000 based on a lifetime exposure at an average exposure level. Workers in the trucking, railroad, and mining industries have been and still are often exposed to EC levels in these exposure ranges (Coble et al. 2010; Davis et al. 2011; Pronk et al. 2009; Vermeulen et al. 2010). With millions of workers
currently exposed to such levels, and likely higher levels in the past, the impact on the current and future lung cancer burden could be substantial.
We estimated that environmental exposure in the general population (average EC 0.8µg/m3) resulted in an estimated excess lifetime risk of 21 additional lung cancer deaths per 10,000 individuals as compared to an unexposed population. With the high prevalence of such levels of exposure in the general population of urban areas, the contribution to the lung cancer burden could be substantial.
We believe that it is appropriate to use US lung cancer rates, unadjusted for smoking, in the ELR calculations under the assumption that smoking does not modify the association between DEE and lung cancer mortality. Different smoking habits in the general population (from which we derived our lung cancer mortality rates), compared to the cohorts (from which we derived our exposureresponse function) would not affect our estimates of excess lifetime mortality if the assumption of no effect modification by smoking were correct. If smoking does modify the effect of diesel exhaust, data from one study (Silverman et al. 2012) suggests that at high DEE exposure, nonsmokers may have a higher relative risk per unit of exposure than smokers, which implies that our ELR would be an underestimate, since historically blue collar worker populations are known to have lower percentages of nonsmokers than the general population (Nelson et al. 1994).
We estimated that approximately 1.3% and 4.8% of annual lung cancer deaths at age 70 in the US and the UK are due to past occupational and environmental DEE exposures, respectively. These estimates are far from precise, and depend on broad assumptions about proportions
AF estimate for occupational DEE exposure is consistent with an AF of 1.5% estimated by Brown et al. (2012) for the UK. In addition, our AF estimate for environmental DEE exposure is generally consistent with previous estimates for trafficrelated air pollution and lung cancer mortality and incidence (5 – 7%) (Cohen et al. 2005; Vineis et al. 2007).
There are several points about our metaregression worth noting. First, the study data on which our metaregression was based are limited, resulting in inherent uncertainty in the obtained slope estimates. Formal tests of heterogeneity of estimates among the studies were of limited value due to the small number of data points for each study. Second, we extrapolated our results, which, based on spline models (data not shown) were largely linear on the log RR scale, to exposures which in some cases are lower than exposures observed in our occupational studies. However the extrapolation is not large, because exposures as low as 1 µg/m3 are present in our occupational data. Third, we recognize that not all EC in the general environment is from DEE, and as such the EC exposures in the occupational and general environment could be qualitatively different. Fourth, our estimates of the AF are based on broad assumptions regarding exposure distributions in occupational and environmental settings. However, available data to support these assumptions are limited. Fifth, estimates from the studies used in our metaanalysis differed with regard to the exposure lag time, with two studies using a 5year lag and the third a 15year lag. However, the combined slopes based on sensitivity analyses were generally consistent with our primary estimate when we used unlagged estimates from each study or estimates derived using a 10year lag from one of the studies. Sixth, it should be noted that there is considerable uncertainty inherent in retrospective exposure assessment. Nonetheless, in all three of our key studies, considerable resources were devoted to this task, and a relative large number of air samples were available in each study. Seventh, we were not able to investigate other model
forms in our metaregression, beyond the linear and spline curves, due to the limited number of data points. If nonlinear exposureresponse curves were actually a better fit (e.g., attenuation at higher exposures, for which there is some evidence in Silverman et al. ( 2012), then this might change the estimate burden of disease due to diesel engine exhaust.
Our estimates suggest that stringent occupational and environmental standards for DEE should be set. Fortunately, increasingly stringent onroad emission standards for diesel engines have been introduced in the United States and the European Union (US2010 and Euro 6 standards) with other countries (e.g., China, India, Brazil) following with a delay of about 5 to 10 years (Scheepers and Vermeulen 2012). These regulations have resulted in the recent introduction of new diesel engine technologies (integration of wallflow diesel particulate filter and diesel oxidation catalyst) that on a perkm basis achieve a more than 95% reduction of particulate mass and nitrogen oxides emissions (Scheepers and Vermeulen 2012). However, emission standards for offroad vehicles and industrial applications are generally introduced after those for onroad vehicles and therefore many offroad applications were still largely uncontrolled in 2000. It should also be noted that although new diesel engines are available, it will take still many years before they have a significant penetration into the diesel engine fleet, especially in less developed countries (Scheepers and Vermeulen 2012).
In conclusion, in a recent IARC Monograph evaluation, DEE was classified as a known human lung carcinogen. Based on a metaregression derived from three occupational studies critical to the IARC evaluation (BenbrahimTallaa et al. 2012), we estimated substantial excess lifetime lung cancer risks for several occupational and environmental exposure scenarios; each are above
1/1,000 and 1/100,000 based on lifetime exposure for the occupational and general population, respectively.
References
Attfield MD, Schleiff PL, Lubin JH, Blair A, Stewart PA, Vermeulen R et al. 2012. The Diesel Exhaust in Miners study: a cohort mortality study with emphasis on lung cancer. J Natl Cancer Inst 104:869883.
BenbrahimTallaa L, Baan RA, Grosse Y, LaubySecretan B, El Ghissassi F, Bouvard V et al. 2012. Carcinogenicity of dieselengine and gasolineengine exhausts and some nitroarenes. Lancet Oncol 13:663664.
Birch ME, Cary RA. 1996. Elemental carbonbased method for occupational monitoring of particulate diesel exhaust: methodology and exposure issues. Analyst 121:11831190. Brown T, Darnton A, Fortunato L, Rushton L. 2012. Occupational cancer in Britain. Respiratory
cancer sites: larynx, lung and mesothelioma. Br J Cancer 107 Suppl 1:S5670.
Cherrie JW, Gorman Ng AS, Tongeren van M, Mistry R, Corden C, Rushton C et al. Health, socioeconomic and environmental aspects of possible amendments to the EU Directive on the protection of workers from the risks related to exposure to carcinogens and mutagens at work. Edinburg: Institute for Occupational Medicine, 2011.
Coble JB, Stewart PA, Vermeulen R, Yereb D, Stanevich R, Blair A et al. 2010. The Diesel Exhaust in Miners Study: II. Exposure Monitoring Surveys and Development of Exposure Groups. Annals of Occupational Hygiene 54:747761.
Cohen AJ, Ross Anderson H, Ostro B, Pandey KD, Krzyzanowski M, Kunzli N et al. 2005. The global burden of disease due to outdoor air pollution. J Toxicol Environ Health A 68:1301 1307.
Davis ME, Hart JE, Laden F, Garshick E, Smith TJ. 2011. A retrospective assessment of occupational exposure to elemental carbon in the U.S. trucking industry. Environ Health Perspect 119:9971002.
Driscoll T, Nelson DI, Steenland K, Leigh J, ConchaBarrientos M, Fingerhut M et al. 2005. The global burden of disease due to occupational carcinogens. Am J Ind Med 48:419431. Gan WQ, FitzGerald JM, Carlsten C, Sadatsafavi M, Brauer M. 2013. Associations of ambient
Garshick E, Laden F, Hart JE, Davis ME, Eisen EA, Smith TJ. 2012. Lung cancer and elemental carbon exposure in trucking industry workers. Environ Health Perspect 120:13011306. Greenland S, Longnecker MP. 1992. Methods for trend estimation from summarized dose
response data, with applications to metaanalysis. Am J Epidemiol 135:13011309. Harrell FE. Regression modeling strategies: with applications to linear models, logistic
regression, and survival analysis. NewYork: Springer, 2001.
Janssen NA, Hoek G, SimicLawson M, Fischer P, van Bree L, ten Brink H et al. 2011. Black carbon as an additional indicator of the adverse health effects of airborne particles compared with PM10 and PM2.5. Environ Health Perspect 119:16911699.
Kromhout H, Symanski E, Rappaport SM. 1993. A comprehensive evaluation of within and betweenworker components of occupational exposure to chemical agents. Ann Occup Hyg 37:253270.
Kromhout H, Hoek F, Uitterhoeve R, Huijbers R, Overmars RF, Anzion R et al. 2000.
Postulating a dermal pathway for exposure to antineoplastic drugs among hospital workers. Applying a conceptual model to the results of three workplace surveys. Annals of
Occupational Hygiene 44:551560.
Laden F, Hart JE, Eschenroeder A, Smith TJ, Garshick E. 2006. Historical estimation of diesel exhaust exposure in a cohort study of U.S. railroad workers and lung cancer. Cancer Causes Control 17:911919.
Lenters V, Vermeulen R, Dogger S, Stayner L, Portengen L, Burdorf A et al. 2011. A Meta analysis of Asbestos and Lung Cancer: Is Better Quality Exposure Assessment Associated with Steeper Slopes of the ExposureResponse Relationships? Environmental Health Perspectives 119:15471555.
Mohner M, Kersten N, Gellissen J. 2013. Diesel motor exhaust and lung cancer mortality: reanalysis of a cohort study in potash miners. Eur J Epidemiol 28:159168.
Council NR. Health effects of radon and other internally deposited alpha emitters. Committee on the Biological Effects of Ionizing Radiation. Washington DC: National Academy Press, 1988.
Nelson DE, Emont SL, Brackbill RM, Cameron LL, Peddicord J, Fiore MC. 1994. Cigarette smoking prevalence by occupation in the United States. A comparison between 1978 to 1980 and 1987 to 1990. J Occup Med 36:516525.
NeumeyerGromen A, Razum O, Kersten N, Seidler A, Zeeb H. 2009. Diesel motor emissions and lung cancer mortalityresults of the second followup of a cohort study in potash miners. Int J Cancer 124:19001906.
Pronk A, Coble J, Stewart PA. 2009. Occupational exposure to diesel engine exhaust: a literature review. J Expo Sci Environ Epidemiol 19:443457.
Rushton L, Hutchings SJ, Fortunato L, Young C, Evans GS, Brown T et al. 2012. Occupational cancer burden in Great Britain. Br J Cancer 107 Suppl 1:S37.
Scheepers PT, Vermeulen RC. 2012. Diesel engine exhaust classified as a human lung
carcinogen. How will this affect occupational exposures? Occup Environ Med 69:691693. Silverman DT, Samanic CM, Lubin JH, Blair AE, Stewart PA, Vermeulen R et al. 2012. The
Diesel Exhaust in Miners Study: A Nested CaseControl Study of Lung Cancer and Diesel Exhaust. J Natl Cancer Inst.
Steenland K, Armstrong B. 2006. An overview of methods for calculating the burden of disease due to specific risk factors. Epidemiology 17:512519.
Steenland K, Deddens J, Stayner L. 1998. Diesel exhaust and lung cancer in the trucking industry: exposureresponse analyses and risk assessment. Am J Ind Med 34:220228. Stewart PA, Coble JB, Vermeulen R, Schleiff P, Blair A, Lubin J et al. 2010. The Diesel Exhaust
in Miners Study: I. Overview of the Exposure Assessment Process. Annals of Occupational Hygiene 54:728746.
Vermeulen R, Coble JB, Lubin JH, Portengen L, Blair A, Attfield MD et al. 2010. The Diesel Exhaust in Miners Study: IV. Estimating Historical Exposures to Diesel Exhaust in Underground Nonmetal Mining Facilities. Annals of Occupational Hygiene 54:774788. Vineis P, Hoek G, Krzyzanowski M, VignaTaglianti F, Veglia F, Airoldi L et al. 2007. Lung cancers attributable to environmental tobacco smoke and air pollution in nonsmokers in different European countries: a prospective study. Environ Health 6:7.
Table1.Exposureresponse estimates (lnRR for a 1µg/m3 increase in EC) from individual studies and the primary combined estimate based on a loglinear model.
Modela Intercept β (95%CI)
All studies combined 0.088 0.00098 (0.00055, 0.00141) Silverman et al. (2012) only 0.18 0.0012 (0.00053, 0.00187) Steenland et al. (1998) only 0.032 0.00096 (0.00033, 0.00159) Garshick et al. (2012) only 0.24 0.00061 (0.00088, 0.00210) a
Table2.Excess lifetime risk per 10,000 for several exposure levels and settings, U.S. in 2009.
AverageEC Excesslifetimeriskthrough Exposuresetting Exposure(µg/m3) age80(per10,000)
Worker exposed age 20 to 65 25 689
Worker exposed age 20 to 65 10 200
Worker exposed age 20 to 65 1 17
General public age 5 to 80 0.8 21
Based on linear risk function, ln RR = 0.00098 * exposure, assuming a 5year lag, using agespecific (5 year categories) all cause and lung cancer mortality rates from the US in 2009 as referent.
Figure Legend
Figure1.Predicted exposureresponse curve based on a loglinear regression model using
relative risk estimates from three cohort studies of DEE and lung cancer mortality. Individual RR estimates (based on hazard ratios reported by Garshick et al. or odd ratios reported by Silverman et al. and Steenland et al.) are plotted with their 95% confidence interval bounds. The shaded area indicates the 95% confidence interval estimated based on the loglinear model. Insert with parameter estimates present the estimates of the intercept and beta slope factor; the standard error (S.E.) of these estimates and associated pvalues.
Figure 1