Global financial markets
(1)Overview
Further marked-to-market losses on structured credit and leveraged loan exposures combined with reintermediation of financial flows maintained the pressure on banks’ balance sheets over recent months. This prompted banks to reduce further their willingness to extend credit to households and firms as well as other non-bank financial intermediaries.(2)
Tighter financing conditions for some non-bank financial institutions contributed to a further wave of deleveraging. This was particularly pronounced in mid-March when liquidity problems faced by the US investment bank Bear Stearns highlighted the potential vulnerability of financial sector balance sheets and prompted the US Federal Reserve to co-ordinate a rescue of the firm.
Towards the end of the review period, market sentiment generally improved, in part reflecting measures by a number of central banks to provide liquidity against a wider range of assets than previously. Equity markets recovered a little and corporate credit spreads narrowed slightly. Financial sector counterparty credit risk also appeared to subside as banks sought to raise fresh capital.
However, conditions in global money markets remained somewhat stressed. In particular, the cost of unsecured bank funding remained elevated and forward spreads indicated this would persist for some time. Contacts reported continued limited appetite among banks to lend to each other for periods longer than one month. Instead, banks were opting to hold more liquid assets and to conserve balance sheet capacity, partly as a buffer against corporates drawing on committed lending facilities. This was seen as more likely if
macroeconomic conditions deteriorated and, in this eventuality, corporate defaults could rise rapidly, putting further strain on credit markets.
Alongside the dislocation in credit markets and constraints on credit supply, energy prices rose sharply. Ultimately these factors will act as a drag on economic activity. But in the near term, higher energy costs have added to perceived inflationary
pressures. In turn, market participants revised upwards their expectations for future policy rates.(3)
Recent developments in international capital markets Short-term interest rates
Since the previous Bulletin, the US Federal Open Market Committee (FOMC) reduced its target rate by 100 basis points to 2% (75 basis points in March and 25 basis points in April) to support economic activity in the United States. The UK Monetary Policy Committee (MPC) reduced Bank Rate by 25 basis points to 5% while the ECB and the Bank of Japan maintained policy rates at 4% and 0.5% respectively (Chart 1).
These changes occurred against the backdrop of some further expected weakening in economic activity in the major economies, as the ongoing stress in bank credit markets and previous rises in commodity prices acted as a constraint on spending. Consensus forecasts for GDP growth in 2009 for both industrial and emerging economies were revised down further compared with projections made earlier in the year, although the latter remained relatively robust (Chart 2).
This article reviews developments in global financial markets since the 2008 Q1
Quarterly Bulletin
up to the end of May 2008. The article also reviews the Bank’s official operations during this period.
Markets and operations
(1) This article focuses on global capital market developments. The period under review is 22 February (the data cut-off for the previous Quarterly Bulletin) to 23 May. (2) Previously discussed in the April 2008 Bank of England Financial Stability Report. (3) See the Bank of England Inflation Report, May 2008.
0 1 2 3 4 5 6
Jan. Mar. May July Sep. Nov. Jan. Mar. May
2007 08 Sterling US dollar Euro Yen Per cent Previous Bulletin Source: Bloomberg.
Despite the perceived weaker global macroeconomic outlook, market expectations of the future path of official interest rates were revised upwards for sterling and the euro although they were little changed for the dollar (Chart 3).
In part, the shift up in near-term expectations for policy rates reflected concerns about the upside risks to inflation
associated mainly with commodity price pressures (Chart 4). In particular, the cost of oil and other energy commodities increased significantly (the price of Brent crude reached an all-time high of $135.14 on 22 May), although some commodity prices had fallen somewhat from highs reached earlier in the year.
Market contacts suggested that the recent strength in oil prices was linked to robust global demand and some
supply-side capacity constraints. Speculative activity was not widely thought by contacts to have been the primary cause of upward price pressures in energy markets, although it is possible that it played some role in the short run.
Long-term interest rates
At longer horizons, sterling and euro nominal forward interest rates changed little, while dollar rates were slightly lower (Chart 5). US dollar forward rates were volatile over the period, especially in mid-March, which contacts attributed to a ‘flight to liquidity’ associated with heightened market
nervousness surrounding the near failure of US investment bank Bear Stearns.
International long-term real forward rates fell slightly in sterling and dollar, but were broadly unchanged in euro (Chart 6). Consistent with this, given little change in nominal
1.5 2.0 2.5 3.0 3.5
Jan. Feb. Mar. Apr. 3.5
4.0 4.5 5.0 5.5
United States (right-hand scale)
United Kingdom (right-hand scale)
Euro area (right-hand scale)
Per cent
2008 Per cent
Asia/Pacific region(a) (left-hand scale)
0.0 0.0
Source: Consensus Economics Inc. (a) Comprises 16 countries.
Chart 2 Expected real GDP growth for 2009
1 2 3 4 5 6
Feb. Apr. June Aug. Oct. Dec. Per cent 23 May
22 February
Economists’ expectations(a)
Euro(c) Sterling(b) US dollar(d) 2008 Per cent 1 2 3 4 5 6 0 0
Sources: Reuters and Bank calculations.
(a) Derived from the Reuters poll of economists’ expectations taken before 15 May. (b) Derived from sterling overnight index average (SONIA) swaps.
(c) Derived from euro overnight index average (EONIA) swaps. (d) Derived from overnight swaps that settle on the Fed funds effective rate.
Chart 3 International forward implied policy rates and
economists’ expectations 40 60 80 100 120 140 160 180 200
Jan. Mar. May July Sep. Nov. Jan. Mar. May Energy Agriculture Precious metals Industrial metals Livestock Indices: 3 Jan. 2007 = 100 Previous Bulletin 2007 08
Sources: Bloomberg and Bank calculations.
(a) Special Drawing Rights (SDR). These are based on a basket of currencies consisting of the euro, sterling, the US dollar and yen.
(b) The US dollar value of the SDR is calculated as the sum of specific amounts of the four other currencies in the SDR basket valued in US dollars, based on exchange rates quoted at noon each day in the London market. This exchange rate is used to convert the selected commodity prices.
Chart 4 Selected commodity total return indices in
SDR(a)terms(b) 3.0 3.5 4.0 4.5 5.0 5.5 6.0
Jan. Mar. May July Sep. Nov. Jan. Mar. May Per cent 2007 08 Sterling Euro US dollar Previous Bulletin 0.0
(a) Derived from the Bank’s government liability curves.
Chart 5 International five-year nominal interest rates five years forward(a)
forwards, implied sterling forward inflation rates rose (Chart 7). This continued a gradual drift higher in implied sterling inflation forwards since mid-2005.
A model-based decomposition of long-term sterling forward inflation rates indicated that inflation expectations may have picked up a little over recent months. But the level of long-term implied (RPI) inflation expectations remained broadly in line with the MPC’s inflation target(1)(Chart 8). And nominal forward rates at five to ten years have been stable. Had there been a sharp rise in inflation expectations one might have expected these to rise. The model-implied compensation required by investors for bearing uncertainty about future inflation (the risk premia) also increased, perhaps reflecting greater volatility in recent inflation outturns.
While contacts reported some increase in inflation risk premia, they saw limited evidence of long-run inflation expectations having shifted higher. Contacts instead noted that the activity
of hedge funds has had a significant impact on sterling forward inflation rates since the start of 2008, which was manifested in a sharp increase in inflation rates implied by gilts relative to rates implied by inflation swaps (Chart 9).
Specifically, some hedge funds had taken positions anticipating falls in sterling breakeven inflation. But the need to raise funds to meet trade losses or margin calls, forced many to unwind these positions. Contacts also continued to cite pension fund demand, combined with limited supply of inflation-linked securities, as having influenced measured sterling inflation forward rates. 0.0 0.5 1.0 1.5 2.0 2.5 3.0
Jan. Mar. May July Sep. Nov. Jan. Mar. May Per cent 2007 08 Previous Bulletin Sterling Euro US dollar
(a) Sterling and US dollar rates derived from the Bank’s government liability curves. Euro rates derived from inflation swap rates. Sterling rates referenced to RPI, US dollar rates referenced to CPI and euro rates referenced to HICP.
Chart 6 International five-year real interest rates five
years forward(a)
1.5 2.0 2.5 3.0 3.5 4.0 4.5
Jan. Mar. May July Sep. Nov. Jan. Mar. May Per cent 2007 08 Sterling Euro US dollar Previous Bulletin 0.0
(a) Sterling and US dollar rates derived from the Bank’s government liability curves. Euro rates derived from inflation swap rates. Sterling rates referenced to RPI, US dollar rates referenced to CPI and euro rates referenced to HICP.
Chart 7 International implied five-year inflation rates
five years forward(a)
(1) See Joyce, M, Sorensen, S and Weeken, O (2008), ‘Recent advances in extracting policy-relevant information from market interest rates’, on pages 157–66 of this Bulletin, and also the box ‘A model-based decomposition of sterling government yield curves’, on pages 14–15 of the 2008 Q1 Bulletin.
0 1 2 3 4 5
Jan. May Sep. Jan. May Sep. Jan. May Per cent
Actual(b)
Inflation expectations
Inflation risk premium Unexplained
2006 07 08
Previous Bulletin
Source: Bank calculations.
(a) The method for decomposing inflation forward rates is described in the box on pages 14–15 of the 2008 Q1 Bank of England Quarterly Bulletin.
(b) Five-year inflation starting five years forward, derived from the Bank’s government liability curve.
Chart 8 Decomposition of sterling five-year inflation
rates, five years forward(a)
3.0 3.2 3.4 3.6 3.8 4.0
Jan. Mar. May July Sep. Nov. Jan. Mar. May Per cent
2007 08
Five-year inflation, five years forward derived from swaps(a) Five-year inflation, five years forward derived from gilts(b)
Previous Bulletin
0.0
Sources: Citigroup, HM Treasury, YouGov and Bank calculations. (a) RPI inflation forward rates derived from inflation swap rates.
(b) RPI inflation forward rates derived from the Bank’s government liability curve.
Foreign exchange
More generally, uncertainty about the macroeconomic outlook in different countries, and in particular the potential effects of the recent shocks to credit supply and commodity prices, may also have led investors to demand higher risk premia on assets denominated in certain currencies. In particular, other things being equal, higher risk premia could explain the continued depreciation in sterling and US dollar effective exchange rate indices (ERIs), the main counterparts of which were a further appreciation in the value of the euro and the yen (Chart 10). This could also reflect investor worries about the impact of the turmoil in financial markets on returns on sterling and US dollar-denominated assets compared with other currencies.
Estimates of foreign currency risk premia, based on combining information on interest rate differentials and surveys of forecasts for exchange rates, indicated that dollar and sterling risk premia had risen since Summer 2007 (Chart 11).
It is also possible that market participants have revised down their estimates of the long-run equilibrium of sterling and dollar exchange rates.
Equities
Despite the increase in sterling and dollar risk premia, the UK and US equity markets rose broadly in line with other international equity markets over recent months (Chart 12). Specifically, after falling in mid-March around the time of problems at US investment bank Bear Stearns, international equity prices gradually recovered. The main equity indices ended the period at levels broadly comparable with those at the start of the year, although below their averages in 2007. However, the aggregate indices mask divergent trends. Specifically, while oil and gas stocks rose strongly over recent months, the equity prices of financial firms remained lower than levels at the turn of the year (Chart 13).
80 85 90 95 100 105 110 115 120
Jan. Apr. July Oct. Jan. Apr. July Oct. Jan. Apr. Sterling ERI US dollar ERI Euro ERI Yen ERI 2006 07 08 Indices: 2 Jan. 2006 = 100 Previous Bulletin
Sources: Bank of England and Bloomberg.
Chart 10 Exchange rate indices since January 2006
4 3 2 1 0 1 2 3 4
Jan. Apr. July Oct. Jan. Apr. July Oct. Jan. Apr. Sterling ERI Percentage points 2006 07 08 US dollar ERI Euro ERI – + Previous Bulletin Currency preferred
Sources: Bloomberg, Consensus Economics Inc. and Bank calculations.
(a) Risk premia estimate the expected rate of return required by foreign investors to invest in a domestic risk-free asset, over the foreign risk-free rate of return. A positive risk premium implies that the currency is expected to appreciate relative to the path implied by the interest rate differential.
Chart 11 Three to 24-month risk premia estimates for
exchange rate indices(a)
60 70 80 90 100 110 120 130 140 150
Jan. Mar. May July Sep. Nov. Jan. Mar. May FTSE All-Share
S&P 500 Topix DJ Euro Stoxx
MSCI Emerging Markets
Indices: 4 Jan. 2007 = 100
2007 08
Previous Bulletin
Sources: Bank of England and Bloomberg.
(a) The MSCI Emerging Markets index is a capitalisation-weighted index that monitors the performance of stocks in emerging markets.
Chart 12 International equity indices (in US dollars)(a)
70 80 90 100 110 120 130 140 150
Jan. Mar. May July Sep. Nov. Jan. Mar. May
2007 08
Financials sector Oil and gas sector All sectors (excluding
oil and gas and financials)
Indices: 1 Jan. 2007 = 100 Previous Bulletin
Sources: Thomson Datastream and Bank calculations.
(a) ‘All sectors’ is the Datastream world equity index excluding its oil and gas and financials indices.
The recovery in equity prices since mid-March was, according to contacts, supported by a lack of widespread and significant earnings surprises. Indeed, for most companies that report on a quarterly frequency, the most recent results were broadly in line with analysts’ expectations (Chart 14). However, there were some significant negative earnings surprises, the majority of which related to financial institutions.
Looking ahead, analysts’ expectations for company nominal earnings growth over the next few years remained relatively robust, despite lower real GDP growth forecasts (Chart 2). Forecasts for earnings growth in 2008 fell sharply compared with earlier in the year for the S&P and Euro Stoxx, but growth was expected to pick up in 2009 (Chart 15).
Corporate credit
The recent pickup in equity prices was accompanied by some improvement in corporate credit conditions. Corporate bond spreads continued to widen over the first half of March, but have since narrowed somewhat (Chart 16). Similarly, since mid-March, leveraged loan prices have recovered slightly (Chart 17) and spreads on asset-backed securities narrowed further.
According to a model-based decomposition, a significant proportion of the recent narrowing in US dollar-denominated
high-yieldcorporate bond spreads was accounted for by non-credit risk factors (the residual in Chart 18).(1)This possibly reflected, for example, better liquidity conditions, which had reportedly worsened significantly in the second half of last year. In contrast, non-credit risk factors were a
negligible component of the recent narrowing in US
dollar-denominated investment-gradecorporate bond spreads. Compensation for corporate credit risk (both for expected defaults and recovery rates, as well as uncertainty around them) fell slightly for investment-grade and high-yield firms. To some extent this could have reflected some reassessment of the prospects for widespread corporate defaults — information from indices of credit default swaps suggested that implied default correlation fell sharply over recent months (Chart 19).(2) 8 6 4 2 0 2 4 6 8 8 6 4 2 0 2 4 6 8 S&P 500: non-financials S&P 500: financials DJ Euro Stoxx 50 FTSE 100
Actual earnings per share(d)
Expected earnings per share(c)
– +
+ –
Source: Bloomberg.
(a) The data are for the most recent quarterly results from corporates that report on a quarterly cycle only.
(b) Corporates on the 45° line have reported results in line with expectations, above this line indicates results below expectations.
(c) Expected earnings are the mean of Bloomberg surveys of equity analysts’ forecasts in local currency.
(d) Actual earnings are earnings per share as reported by the firms in local currency.
Chart 14 Expected versus actual net earnings by
corporates(a)(b) 0 2 4 6 8 10 12 14 16 18 20
Jan. Mar. May July Sep. Nov. Jan. Mar. May S&P 500 FTSE 100 DJ Euro Stoxx Per cent 2007 08 2009 2008
Source: Thomson Datastream.
(a) Institutional Brokers’ Estimate System (IBES) uses Consensus forecasts of earnings per share growth by sell-side analysts.
(b) 2008 forecasts capture analysts’ forecasts relating to banks’ annual results that have a year end between start-June 2008 and end-May 2009, with 2009 forecasts capturing the period between June 2009 and May 2010.
Chart 15 IBES earnings per share growth forecasts for
2008 and 2009(a)(b) 0 40 80 120 160 200 240 280 320
Jan. Apr. July Oct. Jan. Apr. July Oct. Jan. Apr. Sterling US dollar Euro 08 2006 07 Basis points Previous Bulletin
Source: Merrill Lynch.
(a) Option-adjusted spreads over government bond yields.
Chart 16 Investment-grade corporate bond spreads(a)
(1) For details of the model, see Webber, L and Churm, R (2007), ‘Decomposing corporate bond spreads’, Bank of England Quarterly Bulletin, Vol. 47, No. 4, pages 533–41. (2) For more discussion of credit correlation see Belsham, T, Vause, N and Wells, S (2005),
‘Credit correlation: interpretation and risks’, Bank of EnglandFinancial Stability Review, December, pages 103–15.
However, according to contacts, the credit correlation market has relatively few participants and the market can be prone to bouts of illiquidity. Indeed, the sharp increase in correlation in 2007/08 reportedly reflected unwinds of structured credit products(1)and heightened concerns about counterparty credit risk. These concerns subsided towards the end of the review period.
Moreover, while actual corporate default rates have remained low over recent years, rating agencies expected an increase in default rates given the uncertain macroeconomic backdrop. Moody’s baseline forecast was that speculative-grade default rates may reach around 5% by mid-2009, although this would
be well below the levels during the previous spike in default rates (Chart 20).
Bank long-term debt and capital markets
Increased appetite for financial sector credit assets by some ‘real money’ investors (long-term investors such as asset managers, pension funds and insurance companies) was one factor that supported efforts by banks to rebuild their balance sheets and to extend the maturity profile of their debt. This occurred against a backdrop of additional write-downs on banks’ structured credit portfolios.
The recent round of capital issuance was the latest stage in recapitalisation efforts by banking sectors globally (Chart 21).
86 88 90 92 94 96 98 100 102 2005 06 07 08
S&P/LSTA leveraged loan index
Average bid price Previous Bulletin
0
Source: Reuters Loan Pricing Corporation.
(a) The S&P/LSTA leveraged loan index consists of market prices for US-denominated senior secured term loans, acquisition loans (post drawdown) and bridge loans with a minimum term of one year at inception, minimum spread of Libor + 125 basis points initially and a minimum facility size of $50 million.
Chart 17 Price of US leveraged loans(a)
Change to local peak
Change from local peak
Residual (including compensation for liquidity) Compensation for uncertainty about default loss Compensation for expected default loss
200 100 0 100 200 300 400 500 600 700 Basis points Investment-grade High-yield + – Change to local peak Change from local peak
Sources: Bloomberg, Merrill Lynch, Thomson Datastream and Bank calculations.
(a) For details of the method underlying the decomposition, see Webber, L and Churm, R (2007), ‘Decomposing corporate bond spreads’, Bank of England Quarterly Bulletin, Vol. 47, No. 4, pages 533–41.
(b) The local peak for investment-grade spreads was on 20 March 2008 and for high-yield spreads the local peak was on 17 March 2008.
Chart 18 Decomposition of changes in US dollar
corporate bond spreads between end-June 2007 and May 2008(a)(b) 0 10 20 30 40 50 60 2005 06 07 08 CDX iTraxx
Base correlation, per cent
Previous Bulletin
Source: JPMorgan Chase & Co.
(a) Default correlation implied from a standard CDO pricing model given observed tranche spreads.
Chart 19 Implied default correlation(a)
(1) For example, contacts highlight unwinds of collateralised synthetic obligations (CSOs), leveraged super-senior (LSS) and constant proportion debt obligations (CPDOs) earlier in the year. 0 2 4 6 8 10 12 Global default rate
Global baseline forecast
Per cent
1998 2000 02 04 06 08 Previous Bulletin
Source: Moody’s Investors Service.
Chart 20 Moody’s speculative-grade default rates and
In 2007 Q4, international banks raised capital — largely to offset large marked-to-market write-downs on credit assets — primarily through off-market private placements of mandatory convertible securities to sovereign wealth funds.(1) The focus of capital raising shifted in 2008 Q1 to market-based public issuance of so-called hybrid capital securities by most major banks. Hybrid capital securities are essentially debt
instruments that contain some features of equity (for example, coupon suspension and principal write-down). And in
2008 Q2, banks — particularly in the United Kingdom — sought to raise new common equity through rights issues. Commensurate with this — and following the resolution of Bear Stearns together with central bank actions — some of investors’ near-term concerns about default are likely to have receded and credit spreads across the entire capital structure of banks narrowed (Chart 22). In turn, contacts reported that the lower costs of capital encouraged many banks to issue long-term debt (Chart 23).
Global money markets
Despite an apparent improvement in credit and equity markets, which supported banks obtaining longer-term funding, conditions in shorter-term money markets remained strained.
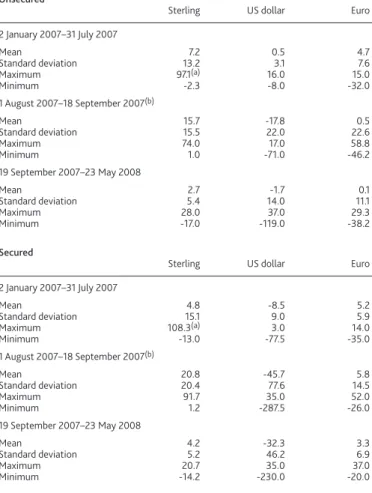
The difficulties were mostly at lending horizons of one month and beyond, as at shorter dates central banks were generally successful at keeping secured and unsecured rates (particularly for overnight rates, eg Table A) stable and close to policy rates. In contrast, while the spreads between term Libors (the most widely used benchmark for interbank rates) and
equivalent-maturity overnight index swap (OIS) rates (which reflect expected future overnight rates) have narrowed from
recent highs, they remained abnormally high and considerably above pre-August 2007 levels (Chart 24).
Going forward, derivatives prices suggested that the Libor-OIS spread should narrow, perhaps indicative of a gradual recovery in conditions. But a narrowing has been priced in to
derivatives markets for some time without materialising, suggesting that the shock to money markets may have been more persistent than market participants had previously expected. 0 10 20 30 40 50 60 70 80 90 100 Hybrid securities(a)
Sovereign wealth funds Rights issue
US$ billions
2007 Q3 2007 Q4 2008 Q1 2008 Q2
Sources: Dealogic, company releases and Bank calculations. (a) Fixed-rate debt instruments with equity-like features.
Chart 21 Major banks’ Tier 1 capital raising by type since
September 2007 0 50 100 150 200 250 300
Jan. Mar. May July Sep. Nov. Jan. Mar. May Senior debt
Lower Tier 2 capital
Tier 1 hybrid capital(c)
2007
Basis points
08 Previous Bulletin
Source: JPMorgan Chase & Co.
(a) US dollar-denominated instruments issued by a range of banks globally at all maturities. (b) Spreads over interest rate swaps.
(c) Fixed-rate debt instruments with equity-like features.
Chart 22 Spreads on banks’ debt and other capital
instruments(a)(b) 0 20 40 60 80 100 120 140
Jan. May Sep. Jan. May Sep. Jan. US$ billions
07 08
2006
Source: Dealogic.
(a) Refers to global issuance of securities by banks. Covers transactions of at least $0.5 billion and with an original maturity of more than one year.
Chart 23 Senior debt issuance by banks(a)
(1) Due to differences in company law, corporates in the United States are not required to give shareholders first rights to new equity capital. This allows US firms to issue new equity capital to (typically institutional) investors, rather than undertaking a rights issue. A rights issue is a lengthy process of asking existing shareholders to provide the new funds, which entails significantly greater execution risk for the firm. However, as it is usually underwritten by a major bank or group of banks, the associated due diligence process can be useful to ensure that the balance sheet is valued appropriately.
Alternative measures of forward Libor-OIS spreads pointed to a slightly different outlook. In particular, an unusually large wedge emerged between forward spreads implied by traded derivatives (forward rate agreements) settling on Libor and those calculated by backing out forward rates (‘bootstrapping’) from spot Libor rates of different maturities (Chart 25).
The wedge suggested that banks wishing to borrow for longer maturities were not benefiting from the expected fall in Libor fixings (as shown in Chart 24). While implied forward spreads from spot Libors suggested an even slower recovery in unsecured money markets than those from forward rate agreements, almost all contacts thought the quicker improvement implied by the latter was more likely.
In principle, this wedge presented profitable opportunities for banks able to borrow at Libor. For example, at the end of the review period, a bank could have borrowed three-month sterling funds and, at the same time, entered into a derivative contract to lock in a borrowing rate for Libor in three months’ time. It could have lent the proceeds at six-month Libor for a profit of around 17 basis points. The persistence of the wedge between forward rates from derivatives and those inferred from longer-maturity Libor rates suggested that a return of as much as 60 basis points was not sufficient to compensate a bank for using its balance sheet in such a manner and was indicative of ongoing balance sheet constraints.
Difficulties in raising unsecured term funding have also been apparent in other measures of interbank funding (Libor is calculated as a truncated average of quotes submitted by a
(1) See the box, ‘An indicative decomposition of Libor spreads’, pages 498–99 of the 2007 Q4 Quarterly Bulletin. 0 20 40 60 80 100 120 Basis points
Jan. Apr. July Oct. Jan. Apr. July Oct. Jan. Sterling US dollar Euro 2007 08 09 Previous Bulletin Forwards from spot Libors(b) Forwards from FRAs(c)
Sources: Bloomberg, British Bankers’ Association and Bank calculations.
(a) Spread of three-month Libor to three-month overnight index swap rates. Forward spreads derived using data as at 23 May.
(b) The circles are implied forward spreads using forward Libors derived from spot Libor rates. (c) The diamonds are implied forward spreads using forward Libors derived from forward rate
agreements (FRAs).
Chart 25Three-month Libor rates relative to expected
policy rates(a)
0 20 40 60 80 100 120
Jan. Apr. July Oct. Jan. Apr. July Oct. Jan. Sterling US dollar Euro Basis points 2007 08 09 Previous Bulletin
Sources: Bloomberg, British Bankers’ Association and Bank calculations.
(a) Spread of three-month Libor to three month overnight index swap rates. Dashed lines show implied forward spreads derived from forward-rate agreements as at 22 February and 23 May.
Chart 24 Three-month Libor rates relative to expected
policy rates(a)
Table A Spread of overnight unsecured and secured rates to
policy rates
Unsecured
Sterling US dollar Euro
2 January 2007–31 July 2007 Mean 7.2 0.5 4.7 Standard deviation 13.2 3.1 7.6 Maximum 97.1(a) 16.0 15.0 Minimum -2.3 -8.0 -32.0 1 August 2007–18 September 2007(b) Mean 15.7 -17.8 0.5 Standard deviation 15.5 22.0 22.6 Maximum 74.0 17.0 58.8 Minimum 1.0 -71.0 -46.2 19 September 2007–23 May 2008 Mean 2.7 -1.7 0.1 Standard deviation 5.4 14.0 11.1 Maximum 28.0 37.0 29.3 Minimum -17.0 -119.0 -38.2 Secured
Sterling US dollar Euro
2 January 2007–31 July 2007 Mean 4.8 -8.5 5.2 Standard deviation 15.1 9.0 5.9 Maximum 108.3(a) 3.0 14.0 Minimum -13.0 -77.5 -35.0 1 August 2007–18 September 2007(b) Mean 20.8 -45.7 5.8 Standard deviation 20.4 77.6 14.5 Maximum 91.7 35.0 52.0 Minimum 1.2 -287.5 -26.0 19 September 2007–23 May 2008 Mean 4.2 -32.3 3.3 Standard deviation 5.2 46.2 6.9 Maximum 20.7 35.0 37.0 Minimum -14.2 -230.0 -20.0
(a) Sterling overnight market rates were impacted by the 28 June 2007 open market operation which was not fully subscribed. For a further discussion about this period, see Bank of England Quarterly BulletinVol. 47, No. 3, pages 356–57.
(b) The announcement of a liquidity support facility to Northern Rock on 14 September provided a disturbance to sterling money markets. Following this the Bank offered, on 18 September, additional reserves in an exceptional fine-tuning open market operation.
panel of highly rated banks).(1) For example, the cost of obtaining funding via foreign exchange swaps has risen relative to expected policy rates (Chart 26). This rise has been particularly pronounced in US dollar which, according to market contacts, reflects some European banks’ ongoing needs to fund US dollar-denominated assets and committed credit lines.
To help ease pressures on the banking system, central banks introduced additional measures.(1) These measures have typically involved supplying cash or other liquid assets for longer periods and against a wider range of assets. For example, the Bank of England launched a Special Liquidity Scheme (SLS) in April. This is discussed in the box on page 142.
Some, but not all, of the supplementary financing measures were implemented as part of a co-ordinated package of central bank measures (announced on both 12 December 2007 and 11 March 2008). Partly reflecting this, interbank spreads were highly correlated across currencies.
One explanation for the continued elevation of international Libor-OIS spreads could be counterparty credit concerns. But the premia on banks’ credit default swaps (CDS) fell markedly through April, which suggests that credit concerns have receded (Chart 27). Consistent with this, an indicative decomposition of Libor-OIS spreads into credit and non-credit
factors, suggests that the proportion of the spread attributed to non-credit factors has risen since March (Chart 28). An alternative explanation, frequently cited by market contacts, is that banks are reluctant to lend to each other because they wish to conserve balance sheet capacity. One reason for this reluctance could be that a number of banks have publicly committed themselves to building up capital buffers, and reducing interbank exposures is one way of achieving this. Indeed, some banks have not only been trying to replenish capital eroded by marked-to-market losses, but have also publicly targeted higher capital ratios relative to assets.
Previous Bulletin(c) Per cent 40 20 0 20 40 60 80 100
Jan. Apr. July Oct. Jan. Apr. July Oct. Jan. Apr. Sterling US dollar Euro 2006 07 08 + –
Sources: Bloomberg, British Bankers’ Association, Markit Group Limited and Bank calculations. (a) Fifteen-day moving average.
(b) The method for decomposing Libor-OIS spreads is described in detail on pages 498–99 of the 2007 Q4 Bank of England Quarterly Bulletin.
(c) The decomposition implies that US dollar non-credit premia was negative in March. That may be because credit premia, inferred using prices of credit default swaps (CDS), may have been overestimated, in part due to illiquidity in CDS markets. Particular caution should be exercised when interpreting decomposition results for this period.
Chart 28 Decomposition of the sterling twelve-month
Libor-OIS spread: non-credit premia as a proportion of the spread(a)(b)
0 50 100 150 200 250 300 Jan. Basis points 2007
Mar. May July Sep. Nov. Jan. Mar. May UK banks
US banks and securities houses
Other banks Previous Bulletin
08
Source: Markit Group Limited. (a) Unweighted averages of five-year premia.
Chart 27 Major international banks’ credit default swap
premia(a)
(1) See Box 6, pages 58–60 of the Financial Stability Report,April 2008. Since publication of the FSR, the Federal Reserve has increased the size of its Term Auction Facility from $50 billion to $75 billion, and the ECB has increased the size of its dollar swap facility from $15 billion to $25 billion.
40 20 0 20 40 60 80 100 120 140
Jan. Mar. May July Sep. Nov. Jan. Mar. May Sterling(c) US dollar Euro 2007 08 Basis points Previous Bulletin + –
Sources: Bloomberg, British Bankers’ Association, Reuters and Bank calculations. (a) Under covered interest parity (CIP), interest rate differentials between currencies should be
perfectly reflected in foreign exchange spot and forward rates, formally: (1 + rd) = F/S(1 + rf)
where
rd= domestic country interest rate
F= foreign exchange forward rate S= foreign exchange spot rate rf= foreign country interest rate
Assuming CIP holds, then the foreign exchange forward-implied domestic cash rate should equal the prevailing domestic cash (Libor) rate. As long as the base currency is funded in unsecured markets, the foreign exchange forward-implied rate should include a comparable risk premium to the domestic cash (Libor) rates. The implied Libor rates are calculated using domestic currencies of Libor panel banks (sterling, US dollar, euro, Canadian dollar, Swiss franc and Japanese yen). Using unsecured rates such as Libor, in combination with foreign exchange forward rates, is broadly consistent with market practice. (b) Spread of three-month Libor (implied by foreign exchange forward rates) to three-month
overnight interest swap rates.
(c) Uses a five-day moving average to account for the additional volatility associated with obtaining the majority of sterling foreign exchange forward rates via US dollar markets.
Chart 26 Three-month Libor rates (implied by foreign
exchange forward rates)(a)relative to expected policy
Contacts reported that banks were also preserving liquidity where they could, owing to the ongoing risk of forced balance sheet expansion. That may result from further
reintermediation of activities previously moved off balance sheet, and/or corporates drawing on committed credit facilities, which may be more likely if macroeconomic conditions deteriorate materially. Indeed, capacity utilisation of these facilities has already increased (Chart 29). Looking ahead, the results from the Bank of England’s most recent quarterly Credit Conditions Surveysuggested lenders expected to reduce corporate credit lines in the three months to June.
In a bid to reposition their credit portfolios, banks have also tightened credit conditions to borrowers (Chart 30). In part this reflected perceptions of increased risk attached to such loans. But it may also have indicated a reduced willingness to lend given ongoing constraints on their balance sheets. Some banks have also reportedly withdrawn certain products in a bid to constrain loan demand. For example, in the United Kingdom most banks have reduced the range of mortgages they offer.
Another explanation for ongoing strains in term money markets could be a change in behaviour of non-bank investors, in particular money market funds, which provide some of the wholesale funding to banks.
Money market fund investors can withdraw their investment at short notice. Given this redemption risk, money funds may have become more risk-averse, prompting them to reduce, and/or shorten the maturity, of lending to banks. In turn, this may have accounted for some of the increased difficulties faced by banks in raising term funding.
Through the period of stressed conditions, money market funds’ assets have generally grown given they were seen as a low-risk, liquid haven. The total assets of US domestic money market funds, which are the largest such funds in gross terms,
grew by 37% between July 2007 and May 2008. Over a similar period, offshore sterling, US dollar and euro funds increased, respectively, by 28%, 37% and 36% (Chart 31).
It is possible that some of the net inflows to money funds came from investors divesting from bank deposits. At the same time, money funds themselves have shifted towards non-bank lending. The holdings of government security by domestic US dollar funds — whose assets under management are around ten times higher than US dollar offshore funds — have increased from 10% to 21% over the past year
(Chart 32). Such a shift has been less evident in offshore money funds, with contacts noting that similar amounts of lending was being provided to banks, albeit increasingly via
0 2 4 6 8 10 12 14 16 18 20 Percentage changes on a year earlier
1999 2000 01 02 03 04 05 06 07 Lending to non-financial corporations
Total facilities granted
(a) Non seasonally adjusted.
Chart 29 UK banks’ lending and facilities granted to UK
corporates(a) 40 20 0 20 40 60 80 Q1 Q3
Net percentage balances
United Kingdom Euro area United States 2003 Q1 Q3 Q1 Q3 Q1 Q3 Q1 Q3 Q1 04 05 06 07 08 + –
Sources: Bank of England Credit Conditions Survey, ECB Bank Lending Surveyand Federal Reserve Senior Loan Officer Opinion Survey on Bank Lending Practices.
(a) Net percentage balances are calculated by weighting together the responses of those lenders who answered the survey questions on the change in the cost of credit. Data points refer to changes in conditions since the previous survey.
(b) The questions in the ECB and Federal Reserve surveys ask how credit standards on lending to large and large and medium corporates has changed, with a positive balance indicating a tightening. The Bank of England question asks how spreads on loans to large PNFCs have changed, and is reported on an inverse scale so a positive balance indicates a widening in spreads.
Chart 30 Survey evidence on cost of bank credit for
corporates(a)(b) 0 50 100 150 200 250 300 350 400 450
Apr. Oct. Apr. Oct. Apr. Offshore US dollar funds (right-hand scale)
Offshore sterling funds (right-hand scale)
Offshore euro funds (right-hand scale) Domestic US dollar funds (left-hand scale) US$ billions 2006 US$ billions 07 08 0 500 1,000 1,500 2,000 2,500 3,000 3,500 4,000
Sources: Bloomberg and iMoneyNet.
certificates of deposit and term deposits rather than commercial paper and floating-rate notes (Chart 33). There is also less evidence that money funds have shortened the maturity of their assets. The weighted average maturities of offshore money funds’ assets have generally recovered from the lows around the 2007 year end (Chart 34). Indeed, some funds have indicated a willingness to take longer-dated paper, but detected some reluctance among certain banks to issue such securities given the relative higher cost compared to short-dated paper, particularly when compared with prior to August 2007.
Developments in market structure
Municipal bond credit default swaps index
An index based on a basket of credit default swaps (CDS) for US municipalities began trading on 6 May. This index —
known as the Municipal Bond CDX index (MCDX) — is the first standardised tradable credit index for which municipal CDS are the underlying referenced assets. The structure of the MCDX is similar to the CDX index for credit default swaps on
investment-grade corporates.
The MCDX will allow existing investors in municipal bonds to hedge better their portfolios. In particular it will allow long and short credit positions to be readily transacted. Moreover, the index may attract new investors to the US municipal securities market by providing a simple product that provides exposure to a diversified portfolio.
Foreign exchange settlement risk
In May 2008 the BIS Committee on Payment and Settlement Systems (CPSS) published a report analysing the progress made in reducing the systemic risk arising from the settlement of foreign exchange trades over the past ten years. The report concludes that while significant progress has been made, some potential FX settlement risk still remains and therefore further action is needed. The CPSS recommends a number of specific actions including for providers of payment versus payment settlement services to extend their currencies and
counterparties. The recent announcement by CLS Bank that the Israeli shekel and Mexican peso will become eligible settlement currencies, with effect of 26 May, and that the Bank of China (Hong Kong) will become their 59th settlement member could be considered as a positive step forward.
Bank of England official operations
The Bank’s balance sheet is managed in accordance with its policy purposes. These relate to the implementation of monetary policy; management of the Bank’s foreign exchange reserves; provision of payment services for the UK financial system and the wider economy; provision of banking services to other central banks; and management of the Bank’s free capital and Cash Ratio Deposits from financial institutions.
0 10 20 30 40 50 60 70 Commercial paper/
floating-rate notes Cash/certificates of deposit Per cent 6 July 2007
23 May 2008
Source: iMoneyNet.
Chart 33 Changes in average portfolio composition of assets held by sterling money market funds
0 5 10 15 20 25 30 35 40 45 50 Days 2006 07 08
Apr. Oct. Apr. Oct. Apr. Offshore
US dollar funds Offshore sterling funds
Offshore euro funds US domestic funds
Source: iMoneyNet.
Chart 34 Money market funds: weighted average
maturities of assets 0 20 40 60 80 100
Jan. May Sep. Jan. May Sep. Jan. Government securities Certificate of deposits and other deposits
Repo agreements
Other
Per cent
2006 07 08
Commercial paper
Source: Haver Analytics.
Chart 32 Composition of US domestic money market
Balance sheet
For the period under review the size of the Bank’s liabilities increased, mainly on account of the increase in aggregate reserves balances (Table B).
Balance sheet developments over the review period largely reflected changes in composition rather than of aggregate size. This included a reduction in the Ways and Means balance. The latter flow reflected a further repayment by HM Treasury of the Ways and Means facility, the UK central government’s overdraft facility at the Bank. On 17 April 2008, HM Treasury repaid £7 billion of this facility. This followed repayments totalling £6 billion in January 2008, which were described on page 20 of the 2008 Q1 Bulletin(Chart 36). These
repayments provide the Bank with additional flexibility in managing its balance sheet. The immediate impact of the repayment was to increase the stock of short-term repo OMOs on the Bank’s balance sheet. In the longer term, the Bank will replace the claim on the government with holdings of bonds that may be routinely utilised to adjust the net supply of reserves to the banking system, for example by repoing them for cash.
Sterling monetary framework
This section reviews three full maintenance periods between 7 February and 7 May.
Reserves targets
The Bank’s operations in the sterling money markets aim to keep overnight market interest rates in line with Bank Rate. They do so by ensuring a net supply of reserves sufficient for the banking system, in aggregate, to meet chosen targets for average reserves balances held at the Bank of England over a maintenance period running from one MPC decision date until the next.
Each month, ahead of the start of a reserves maintenance period, reserves banks in the United Kingdom have the opportunity to set new reserves targets, and the Bank
undertakes to supply the reserves that banks in aggregate need to meet those targets. Thus the monthly resetting of reserves targets provides an opportunity for banks individually, and the banking system as a whole, to obtain extra liquidity from the Bank in the light, inter alia, of their evaluation of the likelihood of payment shocks.
In the first maintenance period under review, reserves banks in aggregate chose targets of £21.1 billion. In the March–April maintenance period, this fell slightly to £20.0 billion before increasing in the subsequent maintenance period to £23.5 billion.
Reserves target ceilings
When it introduced the current framework for sterling monetary operations in 2006, the Bank placed ceilings on the reserves targets individual institutions could choose, in order to ensure that reserves targets could be broadly distributed between reserves banks.(1) These ceilings have been the higher
Table B Simplified version of Bank of England consolidated balance sheet(a)(b)
£ billions
Liabilities 7 May 6 Feb. Assets 7 May 6 Feb.
Banknote issue 42 41 Short-term sterling reverse repo 20 6
Reserves account balances 31 23 Long-term sterling reverse repo 37 32
Standing facility deposits 0 0 Ways and Means advance 0 7
Other sterling deposits, cash ratio deposits and the Bank of England’s capital and reserves 13 14 Standing facility assets 0 0
Foreign currency denominated liabilities 15 18 Other sterling-denominated assets 27 30
Foreign currency denominated assets 17 21
Total(c) 101 96 Total(c) 101 96 (a) The Bank Charter Act 1844 requires the Bank of England to separate the note issue function from its other activities. Accordingly, the Bank has two balance sheets: for Issue Department and Banking Department. See
‘Components of the Bank of England’s balance sheet’ (2003), Bank of England Quarterly Bulletin, Spring, page 18.
(b) Based on published weekly Bank Returns. The Bank also uses currency, foreign exchange and interest rate swaps to hedge and manage currency and non-sterling interest rate exposures — see the Bank’s 2006 Annual Report, pages 36–37.
(c) Figures may not sum to totals due to rounding.
0 5 10 15 20 25 1991 93 95 97 99 2001 03 05 07 £ billions
Sources: BrokerTec and Bank calculations.
Chart 36 Ways and Means facility: outstanding balance
(1) See The Framework for the Bank of England’s Operations in the Sterling Money Markets (the ‘Red Book’) available at www.bankofengland.co.uk/markets/money/ publications/redbookjan08.pdf.
of £1 billion and 2% of the relevant bank’s sterling eligible liabilities as calculated for the calculation of cash ratio deposits.(1)
In view of the increase in the reserves targets set by reserves scheme members and the possibility of future increases, the Bank, with effect from the maintenance period starting on 8 May, increased the reserves target ceiling for each reserves scheme member to the higher of £2.5 billion and 5% of its sterling eligible liabilities. Aggregate reserves targets rose from £23.5 billion to £24.7 billion in the May maintenance period. Since August 2007, aggregate reserves targets have risen by 49% (Chart 37and Chart 38).
Reserves target ranges
Reserves balances are remunerated at Bank Rate within a range around each bank’s individual reserves target. As explained in previous Bulletins, remunerating reserves within a
range about point targets helps to stabilise market interest rates.(2) Between the introduction of the Bank’s reformed framework for its money market operations, in May 2006, and September 2007, this range was set at ±1%. Since then, ranges have been widened and throughout the current review period, the Bank maintained the range at ±30%. This was done in response to feedback from counterparties that a wider range provided useful additional flexibility in market conditions that have continued to be quite difficult compared with before the turmoil.
Short-dated interest rates
During the February–March maintenance period, market interest rates were generally stable and close to Bank Rate (Chart 39and Chart 40).
0 5 10 15 20 25
May Aug. Nov. Feb. May Aug. Nov. Feb. May Maintenance period start month
£ billions
2006 07 08
Chart 37 Aggregate reserves targets
0 10 20 30 40 50
Sep. Oct. Nov. Dec. Jan. Feb. Mar. Apr. May United Kingdom
Europe United States(a)
2007 08
Per cent
Sources: Bank of England, Board of Governors of the Federal Reserve System and European Central Bank.
(a) Required reserves less vault cash used to satisfy reserves plus required clearing balances.
Chart 38 Cumulative increase in aggregate reserves
targets since August 2007
(1) See The Framework for the Bank of England’s Operations in the Sterling Money Markets (the ‘Red Book’) available at www.bankofengland.co.uk/markets/money/ publications/redbookjan08.pdf.
(2) See Mac Gorain, S (2005), ‘Stabilising short-term interest rates’, Bank of England Quarterly Bulletin, Winter, pages 462–70.
20 10 0 10 20 30 40 50 60
July Sep. Nov. Jan. Mar. May Basis points
2007 08
+ –
Sources: BrokerTec and Bank calculations.
Chart 39 Spread to Bank Rate of secured sterling
overnight interest rate
20 0 20 40 60 80
July Sep. Nov. Jan. Mar. May Basis points
2007 08
+
–
Sources: Wholesale Market Brokers’ Association and Bank calculations.
Chart 40 Spread to Bank Rate of unsecured sterling
During March there was a period of renewed pressure in international money markets, particularly in the period surrounding the announcement of the acquisition of Bear Stearns. In sterling, short-dated market interest rates were unusually high relative to Bank Rate and the Bank undertook, on 17 March, an exceptional fine-tuning OMO. The Bank offered, in a three-day repo, additional reserves of £5 billion, equivalent to 25% of the aggregate reserves target. The fine-tuning OMO was oversubscribed, so the additional reserves offered were all supplied.
Following the extraordinary fine-tuning OMO, secured sterling overnight rates fell back (Chart 41). But conditions remained strained and the Bank decided that the additional reserves supplied in the exceptional fine-tuning OMO should be re-offered in the scheduled OMO on 20 March and in the weekly OMOs for the remainder of the March–April maintenance period. These additional reserves were all supplied. The ±30% ranges around reserves targets left sufficient flexibility for the additional reserves to be remunerated, as illustrated in Chart 42.
Since the Bank provided additional reserves during the
maintenance period, there were consequently more reserves in the system than reserves banks had chosen to meet their individual targets. That appears to have exerted some downward pressure on market interest rates, which tended to be a little below Bank Rate for the remainder of the
maintenance period. The remuneration of these additional reserves at Bank Rate might have been expected to act against this downward pressure. Individual reserves banks could have borrowed reserves in the market at below Bank Rate and placed the funds on their reserves account, which would likely draw market rates back towards Bank Rate. However, in view of the wide ranges within which reserves balances would be remunerated and the relatively small spread by which rates, on average, deviated from Bank Rate, there may have been
insufficient incentives for reserves banks in aggregate to undertake such a trade in sufficient quantity.
In April, market interest rates stabilised close to Bank Rate (Chart 39and Chart 40). Reflecting this, the distribution of the spread of secured market interest rates to Bank Rate in the April–May maintenance period was narrower than that in the March–April period (Chart 43).
For the February, March and April maintenance periods combined, sterling secured and unsecured overnight market interest rates tended to be as close to policy rates as
75 50 25 0 25 50 75
6 Mar. 17 Mar. 28 Mar. 7 Apr. Basis points
2008
+
–
Sources: BrokerTec and Bank calculations.
Chart 41 Spread to Bank Rate of intraday secured sterling overnight interest rate
0 5 10 15 20 25 30 35
6 Mar. 11 Mar. 16 Mar. 21 Mar. 26 Mar. 31 Mar. 5 Apr. Range within which reserves remunerated
Additional provision(a)
Reserves provision to meet aggregate targets
£ billions
2008
(a) Additional 25% of aggregate reserves targets provided on 17 March and resupplied for the remainder of the maintenance period.
Chart 42 Cumulative average reserves provision in
March–April maintenance period
0 10 20 30 40 50 1.0 0.8 0.6 0.4 0.2 0.0 0.2 0.4 0.6 0.8 1.0 50 60 70 80 90 100 10 April to 7 May 2008 6 March to 9 April 2008 7 February to 5 March 2008
Cumulative frequency, per cent Cumulative frequency, per cent
+ –
Spread, percentage points
Sources: BrokerTec and Bank calculations.
(a) Distribution of the spread between overnight interest rate at end-of-day and the official interest rate. The distributions are folded at the median so that cumulative probabilities for values above (below) the median are indicated by the right-hand (left-hand) scale.
Chart 43 Folded cumulative distribution(a)of spread of
sterling secured overnight interest rate (trade weighted) to Bank Rate
comparable euro and dollar overnight rates (Chart 44and Chart 45). In dollars, the appropriate distribution against which to compare sterling and euro secured overnight rates is the unsecured overnight rate, since this is the rate explicitly targeted by policy.
In sterling and euros, the spreads of one and two-week overnight index swap (OIS) rates to policy rates have remained
relatively small and stable during the current review period (Chart 46). These OIS rates reflect the expected future unsecured overnight rate. As described in the box on
pages 144–45, the spread to policy rates of one and two-week cash rates have been somewhat wider. This reflected the ongoing pressures in bank funding markets outlined on pages 132–36.
Open market operations
On 11 March, as part of co-ordinated central bank announcements to address liquidity pressures in funding markets, the Bank announced that it would maintain its expanded three-month long-term repo OMOs in its scheduled operations on 18 March and 15 April. The wider range of high-quality collateral was the same as that accepted in the December and January expanded operations. In both
operations, there was a minimum-bid rate at the three-month maturity based on the three-month overnight index swap (OIS) rate. The maximum total size of a counterparty’s bids, across all maturities offered in the long-term repo OMO, was not permitted to be greater than 20% of the total size of the OMO (from 10% in the December and January operations). In its long-term repo OMO on 18 March, the Bank offered £10 billion at the three-month maturity. In the light of the results of March’s operation, the Bank offered £15 billion in the long-term repo OMO on 15 April, bringing the total stock of long-term repo OMOs outstanding to £36.7 billion, of which £25 billion was provided for in the expanded operations (Chart 47). 50 60 70 80 90 100 2.0 1.5 1.0 0.5 0.0 0.5 1.0 1.5 2.0 0 10 20 30 40 50 Sterling Euro US dollar
Cumulative frequency, per cent Cumulative frequency, per cent
+ –
Spread, percentage points
Sources: ICAP and Bank calculations.
(a) Distribution of the spread between overnight interest rate at end-of-day and the official interest rate. The distributions are folded at the median so that cumulative probabilities for values above (below) the median are indicated by the right-hand (left-hand) scale. (b) Chart shows the distribution for period 7 February–7 May 2008. Differences in the median
level of the spread of secured rates to official rates are due to differences in the way official operations are conducted.
Chart 44 Folded cumulative distribution(a)of spread of
international secured overnight interest rates to official interest rates(b) 50 60 70 80 90 100 1.00 0.75 0.50 0.25 0.00 0.25 0.50 0.75 1.00 0 10 20 30 40 50 Sterling Euro US dollar
Cumulative frequency, per cent Cumulative frequency, per cent
+ –
Spread, percentage points
Sources: Wholesale Market Brokers’ Association and Bank calculations.
(a) Distribution of the spread between overnight interest rate at end-of-day and the official interest rate. The distributions are folded at the median so that cumulative probabilities for values above (below) the median are indicated by the right-hand (left-hand) scale. (b) Chart shows the distribution for period 7 February–7 May 2008.
Chart 45 Folded cumulative distribution(a)of spread of
international unsecured overnight interest rates to official interest rates(b)
50 60 70 80 90 100 0.50 0.40 0.30 0.20 0.10 0.00 0.10 0.20 0.30 0.40 0.50 0 10 20 30 40 50 Euro Sterling US dollar
Cumulative frequency, per cent Cumulative frequency, per cent
+ –
Spread, percentage points
Sources: Bloomberg and Bank calculations.
(a) Distribution of the spread between one-week overnight interest swap rates at end-of-day and the official interest rate. The distributions are folded at the median so that cumulative probabilities for values above (below) the median are indicated by the right-hand (left-hand) scale.
(b) Chart shows the distribution for period 7 February–7 May 2008.
(c) When the one-week periods to which the rates apply span a Monetary Policy Committee decision date, expected changes in Bank Rate can influence the level of these rates. To provide a clearer read on risk premia in these rates, these periods have been removed.
Chart 46 Folded cumulative distribution(a)of spread of
international one-week overnight interest rate swaps to official interest rates(b)(c)
All of the long-term repo OMOs held in the review period were fully covered (Table C). Perhaps reflecting the wider range of eligible collateral, the range of successful bid rates in the three-month operations in March and April was wider than in the February operation. But the range of bids accepted in the three-month maturity was greater than in other maturities in the February operation too, despite this OMO being offered against the same collateral as is eligible in the Bank’s regular OMOs.
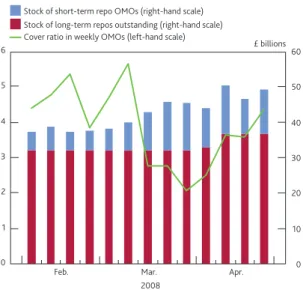
The Bank aims to provide reserves sufficient for banks to meet their aggregate reserves targets over the maintenance period as a whole. The size of short-term repo OMOs therefore reflects the size of aggregate reserves targets, the provision of reserves through other operations and other flows
(autonomous factors) across the Bank’s balance sheet. So, in the absence of offsetting factors, the increase in the stock of long-term repo OMOs outstanding would have required smaller short-term repo OMOs. However, the repayment of the Ways and Means facility described on page 137 offset this flow, resulting in an increase in the size of the weekly OMO in the first half of April (Chart 47). Reflecting chiefly the higher aggregate reserves targets set by reserves banks over the review period, the amounts supplied in the Bank’s weekly OMOs generally rose over the review period as a whole (Chart 48).
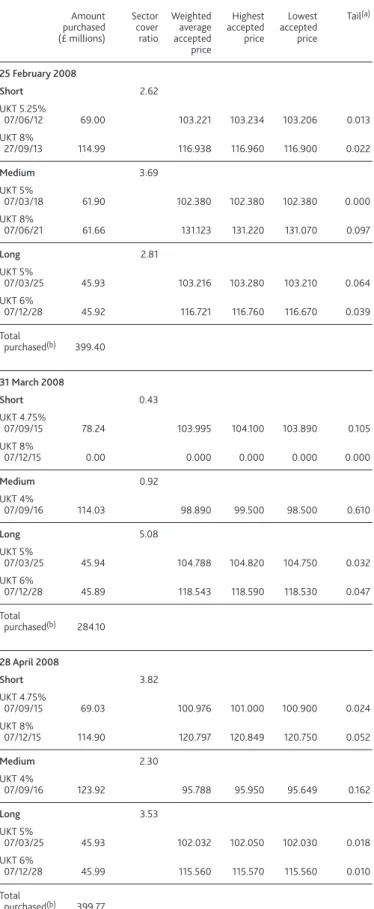
Bond-purchase OMOs
As well as conducting short and long-term repo OMOs the Bank, in January 2008, began to provide reserves for longer periods through bond-purchase OMOs.(1) In February, March and April the Bank conducted OMOs via the outright
purchases of bonds, in accordance with screen announcements made on 2 January and 1 April. The February and April
bond-purchase OMOs were fully covered at all maturities (Table D). The March OMO was uncovered in the short and medium sectors, and the spreads between the highest accepted price and the lowest accepted price were higher in these sectors relative to the long sector. Feedback from counterparties indicated that one possible reason for these sectors of the operation being uncovered was a relative lack of liquidity in the gilt market on the day of the operation, perhaps related to the month and quarter end.
0 1 2 3 4 5 6
Feb. Mar. Apr. 0
10 20 30 40 50 60 Stock of short-term repo OMOs (right-hand scale)
Stock of long-term repos outstanding (right-hand scale) Cover ratio in weekly OMOs (left-hand scale)
£ billions
2008
Chart 47 Liquidity provided in OMOs and short-term
OMO cover ratio
Table C Long-term repo operations
Three-month Six-month Nine-month Twelve-month
19 February 2008
On offer (£ millions) 1,600 750 400 150
Cover 1.34 2.48 2.90 4.27
Weighted average rate(a) 5.139 5.024 4.915 4.800
Highest accepted rate(a) 5.500 5.030 4.915 4.800
Lowest accepted rate(a) 5.010 5.000 4.915 4.800
Tail(b) 12.90 2.44 0.00 0.00
18 March 2008
On offer (£ millions) 10,000(c) 750 400 200
Cover 1.69 5.13 3.93 6.13
Weighted average rate(a) 5.614 4.965 4.850 4.750
Highest accepted rate(a) 6.050 5.000 4.850 4.750
Lowest accepted rate(a) 5.210 4.960 4.850 4.750
Tail(b) 40.44 0.53 0.00 0.00
15 April 2008
On offer (£ millions) 15,000 750 400 200
Cover 1.01 4.46 3.98 5.23
Weighted average rate(a) 5.253 4.845 4.755 4.660
Highest accepted rate(a) 5.835 4.845 4.755 4.660
Lowest accepted rate(a) 4.910 4.845 4.755 4.660
Tail(b) 34.27 0.00 0.00 0.00
(a) Per cent.
(b) The yield tail measures, in basis points, the difference between the weighted average accepted rate and the lowest accepted rate.
(c) March and April long-term repos were held against an expanded range of high-quality collateral.
Jan. Feb. Mar. Apr. May Other (including Northern Rock liquidity facility and gilt purchase) Short-term repo OMOs
Long-term repo OMOs Ways and Means
0 10 20 30 40 50 60 70 80 90 £ billions
Chart 48 Breakdown of sterling market transactions
Special Liquidity Scheme
On 21 April, the Bank announced the launch of the Special Liquidity Scheme (SLS) to allow banks to swap temporarily their high-quality mortgage-backed and other securities for UK Treasury bills. The SLS has no direct impact on the supply of reserves. It is described in the box above.
Foreign currency reserves
The Bank’s foreign currency reserves now comprise around £2 billion equivalent of assets. These are currently funded by two, $2 billion three-year issues, under the Bank’s programme of annual bond issuance which commenced in March 2007. The second issue under the debt issuance programme was announced on 29 February and executed on 10 March. The $2 billion three-year transaction, which was marketed via Barclays Capital, Deutsche Bank, HSBC and JPMorgan priced 30 basis points below Libor. The issue was successful, attracting a broad order book, with orders totalling $2.9 billion. It sold to investors in Europe, Middle East and Africa (50%), Asia (37%) and the Americas (13%). As with the first issue in the programme, central banks and official institutions were the predominant buyers (74%), with bonds also being sold to asset managers (17%), insurance and pension funds (5%) and banks (4%).
The Bank’s reserves are planned to have reached a steady-state level of around £3 billion equivalent by mid-2009.
Facilitating the provision of payment services
In May, the Bank ceased to be a direct member of TARGET. Prior to this, to facilitate UK participation in TARGET, euro-denominated assets had been lent out each day by the Bank to generate the intraday liquidity. These assets were funded by a series of Euro Notes of which the final one, for €3 billion nominal, is due to mature on 27 January 2009. Capital portfolio
The Bank holds an investment portfolio that is approximately the same size as its capital and reserves (net of equity
holdings, eg in the BIS and ECB, and the Bank’s physical assets) together with aggregate cash ratio deposits. The Bank’s ‘free’ capital and cash ratio deposits are invested in a portfolio of sterling-denominated securities. Securities purchased by the Bank for this portfolio are normally held to maturity;
nevertheless, sales may be made from time to time, reflecting for example, risk management, liquidity management or changes in investment policy.
The bond portfolio currently includes around £2 billion of gilts and £1 billion of other debt securities. Purchases are generally made each month with purchase details announced in advance on the Bank’s wire service pages. Over the current review period, gilt purchases were made in accordance with the announcement on 25 March: £20 million each in March and April.
Special Liquidity Scheme
On 21 April, the Bank announced the launch of the Special Liquidity Scheme (SLS) to allow banks to swap temporarily their high-quality, but currently illiquid, mortgage-backed and other securities for UK Treasury bills. The scheme’s aim was to improve the liquidity position of the banking system and increase confidence in financial markets.
The main features of the scheme are as follows:
• The asset swaps will be for long terms. Each swap will be for a period of one year and may be renewed for a total of up to three years.
• The risk of losses on the securities remains with the banks. • It is designed to provide financing for legacy illiquid assets
existing at the end of 2007.
The range of securities that participants can offer as collateral in long-term swaps with the Bank is little different from that eligible for the Bank’s three-month extended collateral long-term open market operations (OMOs) introduced in December.
In return for providing the Bank with adequate securities, scheme members may draw down UK Treasury bills against
this collateral. Banks pay a fee based on the spread between the three-month Libor and the rate for borrowing against government bonds, subject to a floor of 20 basis points. The Treasury bills created as part of the scheme are no different from other Treasury bills issued by the UK Debt Management Office. Banks in receipt of the bills have the option to continue to hold them, to use them in the Bank’s regular OMOs or as intraday liquidity collateral for the Bank’s Real-Time Gross Settlements system or to exchange them for cash with market counterparties, in either a repo transaction or a cash sale.
The major UK banks have agreed to participate in the scheme. Each participating institution must use the scheme for a minimum amount. Drawdowns under the scheme can be undertaken for a period of six months from 21 April 2008. Final usage will depend on market conditions. Discussion with the banks ahead of launch suggested that initial use of the scheme would be around £50 billion. The Bank will publish the total outstanding value of the bills lent under the scheme after the end of the drawdown period.
Feedback on the scheme from market contacts suggested that it has achieved its objective of improving the liquidity position of, and hence confidence in, the UK banking system.
Table D Issue Department gilt-purchase OMO
Amount Sector Weighted Highest Lowest Tail(a) purchased cover average accepted accepted
(£ millions) ratio accepted price price price 25 February 2008 Short 2.62 UKT 5.25% 07/06/12 69.00 103.221 103.234 103.206 0.013 UKT 8% 27/09/13 114.99 116.938 116.960 116.900 0.022 Medium 3.69 UKT 5% 07/03/18 61.90 102.380 102.380 102.380 0.000 UKT 8% 07/06/21 61.66 131.123 131.220 131.070 0.097 Long 2.81 UKT 5% 07/03/25 45.93 103.216 103.280 103.210 0.064 UKT 6% 07/12/28 45.92 116.721 116.760 116.670 0.039 Total purchased(b) 399.40 31 March 2008 Short 0.43 UKT 4.75% 07/09/15 78.24 103.995 104.100 103.890 0.105 UKT 8% 07/12/15 0.00 0.000 0.000 0.000 0.000 Medium 0.92 UKT 4% 07/09/16 114.03 98.890 99.500 98.500 0.610 Long 5.08 UKT 5% 07/03/25 45.94 104.788 104.820 104.750 0.032 UKT 6% 07/12/28 45.89 118.543 118.590 118.530 0.047 Total purchased(b) 284.10 28 April 2008 Short 3.82 UKT 4.75% 07/09/15 69.03 100.976 101.000 100.900 0.024 UKT 8% 07/12/15 114.90 120.797 120.849 120.750 0.052 Medium 2.30 UKT 4% 07/09/16 123.92 95.788 95.950 95.649 0.162 Long 3.53 UKT 5% 07/03/25 45.93 102.032 102.050 102.030 0.018 UKT 6% 07/12/28 45.99 115.560 115.570 115.560 0.010 Total purchased(b) 399.77
(a) The tail measures the difference between the highest accepted price and the weighted average accepted price.