Z
ÁPADO ˇ
CESKÁ UNIVERZITA V
PLZNI
F
AKULTA APLIKOVANÝCH V ˇED
K
ATEDRA MATEMATIKY
Heston ˚uv model stochastické
volatility
Mgr. Milan Mrázek
rigorózní práce
k získání akademického titulu doktor pˇrírodních vˇed
V souladu s pravidly rigorózního ˇrízení na Fakultˇe aplikovaných vˇed byla podána žádost o uznání diplomové práce za rigorózní práci.
ˇ
Cestnˇe prohlašuji, že text rigorózní práce je shodný s textem diplomové práce, která byla obhájena dne 19. ˇcervna 2013.
datum podpis
U
NIVERSITY OF
WEST
BOHEMIA IN
PILSEN
FACULTY OF
APPLIED
SCIENCES
D
EPARTMENT OF
M
ATHEMATICS
Heston stochastic volatility model
Mgr. Milan Mrázek
Doctoral thesis for the award of the degree
of Doctor of Natural Sciences (RNDr.)
The request for the recognition of my diploma thesis as a doctoral (RNDr.) thesis was submitted to the Rigorous Examination Board, in accordance with the rigorous examination procedure at the Faculty of Applied Sciences, on July 24th, 2013.
I hereby declare that the text of the doctoral (RNDr.) thesis is identical with the text of my diploma thesis, which I defended on June 19th, 2013.
Date Signature
DECLARATION
I do hereby declare that this diploma thesis is solely my own work and that I have used only the cited sources.
In Plze ˇn
Preface
The subject of the diploma thesis is the Heston model. One part of the thesis illustrates the complexity of the calibration process of the model. This is done using synthetic op-tion prices, where the model implied parameters are known. Calibraop-tion of the model to the data obtained from the market is then carried out using approach combining local and global optimizers. Results are presented for two consecutive days.
Another part of the thesis deals with the various Monte Carlo schemes for simula-tion of the Heston processes. Introducsimula-tion is given to the known schemes - log-Euler, Milstein, QE, Exact scheme, IJK scheme and also a scheme combining the higher order Milstein scheme with an approximation to the Exact scheme is suggested. Parameters obtained from the market are used to test the schemes while also the range of options available on market is mimicked.
Hereby I would like to thank my supervisor, Ing. Jan Pospíšil Ph.D., for his sug-gestions, remarks and patient guidance throughout the time of developing this thesis. Also I would like to thank Mgr. Ondˇrej Pokora, Ph.D., Faculty of Science, Masaryk University in Brno, for his insights and help generously offered as part of his partici-pation in project A-Math-Net. My one week internship at Masaryk University in Brno was supported by the project A-Math-Net - knowledge transfer network in applied mathematics (project no. CZ.1.07/2.4.00/17.0100). This project is co-financed by the European Social Fund and the state budget of the Czech Republic.
Last but not least, I would like to thank my parents for their continuous support. Plze ˇn, May, 2013.
Contents
1 Introduction 1
2 Preliminaries 3
2.1 Brownian motion . . . 4
2.2 Stochastic integral and SDE . . . 7
2.3 Numerical solution for SDE . . . 9
2.3.1 Euler scheme . . . 9 2.3.2 Milstein scheme. . . 11 3 Options 13 3.1 Option markets . . . 15 3.2 Option prices . . . 16 3.3 Option valuation . . . 17 3.3.1 Volatility smile . . . 18 3.3.2 Historical volatility . . . 19 3.3.3 Other models . . . 21 4 Heston model 23 4.1 Model dynamics. . . 23 4.2 Option valuation . . . 24
4.3 Valuation under risk-neutral measure . . . 26
4.4 The Little Heston Trap . . . 27
5 Simulation 29 5.1 Heston simulation schemes . . . 29
5.1.1 Dynamics of the model . . . 29
5.1.2 Euler scheme . . . 29
5.1.3 Milstein scheme. . . 31
5.1.4 Kahl-Jäckel scheme . . . 31
5.1.5 Haastrecht and Pelsser [34] revised. . . 32
5.1.6 Exact scheme . . . 33
5.1.7 QE scheme. . . 34
5.2 MC simulations . . . 36 5.3 MC test . . . 38 5.4 MC test results. . . 39 6 Calibration 43 6.1 Calibration in progress . . . 44 6.1.1 Data generated . . . 44 6.1.2 Measured errors . . . 45 6.1.3 Considered weights . . . 45 6.2 Genetic algorithm . . . 46 6.3 modSQP . . . 49 6.4 Excel’s Solver . . . 50
6.5 Adaptive Simulated Annealing . . . 52
6.6 MATLAB’slsqnonlin . . . 54
6.7 SA . . . 56
6.8 Conclusion . . . 56
7 Calibration to real market 59 7.1 March 18, 2013 . . . 59
7.1.1 GA . . . 59
7.1.2 ASA . . . 62
7.1.3 Deterministic grid forlsqnonlin . . . 64
7.1.4 Excel’s Solver . . . 65 7.1.5 lsqnonlin . . . 69 7.1.6 Conclusion . . . 72 7.2 March 19, 2013 . . . 74 7.2.1 GA . . . 74 7.2.2 ASA . . . 76
7.2.3 Deterministic grid forlsqnonlin . . . 78
7.2.4 MS Excel’s Solver . . . 79 7.2.5 lsqnonlin . . . 80 7.2.6 Conclusion . . . 82 8 Conclusion 85 A Risk-Neutral Valuation 87 B Content of the CD 93 Bibliography 96
Chapter 1
Introduction
Financial models are an essential tool in today’s world of finance and economics. They are needed to estimate fair values of various securities, to estimate their risks and to show how to control these risks. However, the world changes as well as the market does and in response to that newer models always become necessary. As pointed out
on Paul Wilmott’s Blog 1, the most important question about any financial model is
how wrong it is likely to be, and how useful it is despite its assumptions.
Since the introduction of the Black Scholes model [5] a number of complex models
have been proposed to reflect the behavior of markets and the derivatives. Particu-larly, the Black Scholes model of option valuation relied on constant volatility, which does not represent the dynamics in the financial markets sufficiently anymore. Relax-ing this assumption led to the models called stochastic volatility models. Among the
first publications on the class of stochastic volatility models were Hull and White [16]
in 1987, Scott [31] in 1987, Stein and Stein [33] in 1991 and Heston [14] in 1993.
Hes-ton model was the first model that allowed reasonable calibration to the market option
data together with semi-closed2form solution for European call/put option prices.
He-ston model also allows correlation between the asset price and the volatility process as
opposed to Stein and Stein [33]. We discuss the Heston model in Chapter 4, whereas
the particular drawbacks of the Black Scholes model and motivation for more complex models is given as a part of Chapter 3.
Heston model is one of the most popular models for option pricing. It can be cal-ibrated using the vanilla option prices and then used to price exotic derivatives for which there is no closed form valuation formula. For this purpose a method for sim-ulating the evolution of variable of interest is necessary. Although the Heston model was already introduced in 1993, the research on discretization methods of its dynamics appeared only very recently. Different Euler schemes implementations were examined and various ways how to deal with negative values of the variance process were
sug-gested, for example Higham and Mao [15] in 2005 or Lord et. al. [24] in 2010. An
exact scheme was developed by Broadie and Kaya [6] in 2006, which simulates the
He-1http://www.wilmott.com/blogs/paul/ 2It involves numerical integral.
ston processes from its exact distributions. This topic is covered in detail in Chapter 5, where we also discuss higher order Milstein schemes and QE scheme, which is the
most popular one right now. It was introduced by Andersen [2] in 2008.
Most of the tests for pricing using Monte Carlo in the papers omit certain schemes and also choose their parameters and discretization rather wisely when comparing the schemes or showing their performance. We aimed to eliminate this phenomenon by calibrating the Heston model to real market data and obtaining a set of parameters which explained the prices of European call options on the real market. We used them afterwards in the Monte Carlo simulations in Chapter 5 and compared the Monte Carlo results with the prices implied by the Heston model.
The calibration of the model is a crucial process and a price to pay with more com-plex model is the increased comcom-plexity of the calibration process. The industry stan-dard approach is to minimize the difference between the observed prices and the model
prices. We can follow for example Nögel and Mikhailov [29], they used the method of
Adaptive Simulated Annealing and weights of their fine choice. Unfortunately it is quite common in the literature that only few data and mostly at the money options are used to demonstrate the calibration process, which of course leads to small errors, it makes the calibration problem easy to solve. Also synthetic option prices with simple parameters are often calculated and used for the calibration. See for example Kienitz
and Wetterau [22], where synthetic option prices are calculated and the model
param-eters are recovered from the calibration process. A significant role is played by the optimizer, because local optimizers heavily depend on the initial guess and thus the distance between the model prices and the market prices does not necessarily be be-cause of the model but it can be due to the calibration process.
Chapter 6 demonstrates the complexity of the calibration process and employs va-riety of optimizers. We used the newest available version of Adaptive Simulated An-nealing, we also tested the Genetic algorithm from the MATLAB’s Optimization Tool-box. In Chapter 7 we use the different optimizers with a specific approach to calibrate the model to data obtained from the real market, namely we used daily data for DAX
Options obtained using the Bloomberg Terminal3. We presented the results of the
cali-bration for two consecutive days.
The structure of the thesis is as follows. We start with addressing mathematical preliminaires in Chapter 2. In Chapter 3 we define option contract and give theoretical and graphical motivation for stochastic volatility models. Chapter 4 introduces the Heston model. In Chapter 5 we present various simulation schemes and results of their test. Chapter 6 discusses the calibration problem and introduces the used optimizers. Chapter 7 contains the results of calibration to real market data. The final conclusion is given in Chapter 8.
3Computer system provided by Bloomberg L.P. enabling access to the Bloomberg Professional service for the purpose of monitoring and analyzing real-time financial market data.
Chapter 2
Preliminaries
The purpose of this section is to introduce basic definitions and concepts that will be used throughout the thesis. This is not intended to be a complete comprehensive
overview of the stochastic theory with proofs. We will follow Steven E. Shreve [32],
Paul Glasserman [12] and Bohdan Maslowski [26].
We will start with defining the Brownian motion1, that is the most common
stochas-tic building block used for random walks in finance. At first, let us define a probability space and a stochastic process.
Definition 1. Let Ωbe a nonempty set, and letF be aσ-algebra of subsets of Ω. A
proba-bility measurePis a function that, to every set A ∈ F, assigns a number in[0, 1], called the probability of A and writtenP(A). We require
(i) P(Ω) =1, (ii) P(∅) =0, and
(iii) whenever A1, A2,... is a sequence of disjoint sets inF, then
P ∞ [ n=1 An = ∞
∑
n=1 P(An).The triple(Ω,F,P)is called a probability space.
Having the probability space (Ω,F,P) we will now proceed to the definition of
stochastic process.
Definition 2. Let (Ω,F,P) be a probability space. A stochastic process is a collection of random variables X = {X(t,ω],t ∈ [0,T],ω ∈ Ω}on(Ω,F,P)that takes values inR. By
sample path (or trajectory) of the process we understand the function t→X(t,ω)for each givenω∈ Ω, 1Also called Wiener process.
alternatively the process X can be viewed as a random variable
ω→X(t,ω)for for any fixed parameter t∈[0,T].
In what follows we use the notation X = (t,ω) = X(t), i.e. for simplicity we omit
writing the dependence onω∈ Ω.
2.1
Brownian motion
Definition 3. Let (Ω,F,P) be a probability space. For each ω ∈ Ω, suppose there is a
continuous function W(t)of t≥0that satisfies W(0) =0and that depends onω. Then W(t),
t ≥0, is a Brownian motion if for all0=t0<t1 <...<tmthe increments
W(t1) =W(t1)−W(t0),W(t2)−W(t1), ...,W(tm)−W(tm−1)
are independent and each of these increments is normally distributed with
E[W(ti+1)−W(ti)] =0,
Var[W(ti+1)−W(ti)] =ti+1−ti,
whereEdenotes mathematical expectation (mean value) andVardenotes variance.
Remark 1. We can think of ω as one particular Brownian motion path, as an outcome of a
random experiment, which value at time t is W(t). Thus, the sample spaceΩis the set of all possible outcomes of this random experiment,F is theσ-algebra of subsets ofΩand their
prob-abilities are defined byP, which is a probability measure. For each A ∈ F, the probability of A is a number in[0, 1].
Simulation of the Brownian motion can be done in the following way. We use the fact that the increments are normally distributed with mean zero and variance equal to
ti+1−ti. Settingt0 =0 and starting withW(0) =0, subsequent values of one Brownian
motion path can be obtained as follows W(ti+1) =W(ti) +
p
ti+1−tiZi+1, i=0, ...,n−1, (2.1)
whereZiis a sequence of standard normal variables.
Definition 4. Let X be a random variable defined on a nonempty sample spaceΩ. LetG be a
σ-algebra of subsets ofΩ. If every set inσ(X)is also inG, we say that X isG-measurable.
A random variable X isG-measurable if and only if the information in G is
suffi-cient to determine the value ofX. Our next aim is to define the filtration for Brownian
motion. The termfiltrationrepresents the increasing collection ofσ-algebrasF(t),t ≥0
Definition 5. Let(Ω,F,P)be a probability space on which a Brownian motion W(t)is de-fined, t≥0.A filtration for the Brownian motion is a collection ofσ-algebrasF(t)⊂ F, t ≥0,
satisfying:
(i) For0≤s<t, every set inF(s)is also inF(t).
(ii) For each t≥0, the Brownian motion W(t)at time t isF(t)-measurable (the information at time t is sufficient enough to evaluate the the Brownian motion W(t)at time t). (iii) For0≤t≤ u, the increment W(u)−W(t)is independent ofF(t).
In the view of the previous definition we will also define a stochastic process adapted to a filtration.
Definition 6. Let us consider a stochastic process X(t), t≥0. We say that X(t)is adapted to the filtrationF(t)if for each t≥0the random variable X(t)isF(t)-measurable.
If it is obvious to what filtrationF(t)the process X(t)is adapted, we may simply
write thatX(t)is adapted. Next we give a definition of martingale and then show that
Brownian motion is a martingale.
Definition 7. Let (Ω,F,P)be a probability space, let T be a fixed positive number, and let
F(t), 0 ≤ t ≤ T, be a filtration of sub-σ-algebras of F. Consider an adapted process M(t),
0≤t ≤T. We say M(t)is a martinglale if
E[M(t)|F(s)] =M(s)for all0≤s≤t ≤T, whereE[M(t)|F(s)]denotes condional expectation of M(t)givenF(s).
In other words, a martingale has no tendency to rise or fall.
Lemma 1. Brownian motion is a martingale, i.e. for0≤s<t we have that
E[W(t)|F(s)] =W(s). Proof. Let 0 ≤s<tbe given. Then
E[W(t)|F(s)] =E[(W(t)−W(s)) +W(s)|F(s)] =E[W(t)−W(s)|F(s)] +E[W(s)|F(s)] =E[W(t)−W(s)] +W(s)
When simulating the paths of financial assets later in the thesis, we will need to con-struct two correlated Brownian motions. We will do this by Cholesky decomposition of the correlation matrix.
Definition 8. The correlation matrix of m random variables X1, ..., Xmis the m×m symmetric
matrix whose i,j entry isρ(Xi,Xj)defined as
ρ(Xi,Yj) = Cov (Xi,Xj) σ(Xi)σ(Xj) = E[(Xi−µi)(Xj−µj)] σ(Xi)σ(Xj) , whereσ(Xi)stands for standard deviation,Covfor covariance and
µi =E[Xi].
Remark 2. In our case we will deal with standard normal variables X and Y, hence standard deviations will be 1 for both X and Y andCov(X,Y) =ρ(X,Y).
We would like to simulate two correlated Brownian motionsW(t)(1) andW(t)(2),
with correlation ρ. We showed how to simulate one Brownian motion, thus we will
now need to generate two correlated random numbers Z(1) and Z(2). A correlation
matrixCfor two random variables is according to the definition above given by
C= 1 ρ ρ 1 , (2.2)
whereρis the correlation betweenW(t)(1)andW(t)(2).
Lemma 2. Letρ∈[−1, 1]and C be given by2.2. Then there exists an upper triangular matrix
U such that C=UTU, (2.3) namely U= 1 ρ 0 p1−ρ2 . Proof. UTU= 1 0 ρ p1−ρ2 · 1 ρ 0 p1−ρ2 = 1 ρ ρ ρ2+ (1−ρ2) =C.
Remark 3. The matrix U can be found using the Cholesky decomposition, if C is positive definite. It is satisfied forρ∈(−1, 1). Forρ=±1the assertion (2.3) is also true.
Two correlated random numbersZ(1),Z(2)with correlationρare then generated by
transforming two uncorrelated independent random numbersz1,z2by
Z(1) Z(2) = z1 z2 1 ρ 0 p1−ρ2 ,
thus we arrive toZ(1) =z1andZ(2)= ρz1+
p
1−ρ2z2.
2.2
Stochastic integral and SDE
We have already defined the Brownian motion and a filtration for the Brownian motion, these are necessary for the forthcoming definition of the stochastic integral, which will be followed by the definition of the stochastic differential equation in this section.
Definition 9. Let W(t), t ≥ 0, be a Brownin motion andφ(t),t ≥ 0, be a stochastic process
adapted to the filtrationF(t), t≥0, such that
EZ T
0 φ
2(t)dt<∞.
We define the Itô stochastic integral ofφ(t)with the driving process W(t)by the formula Z T 0 φ (u)dW(u) = lim ||Dn||→0 n−1
∑
i=0 φ(ti) W(ti+1)−W(ti) , (2.4)where Dn={0=t0<t <...<tn= T}is the partition of the interval[0,T]and
||Dn||= max
j∈{0,...,n−1}|tj+1−tj|.
Some of the properties properties of Itô stochastic integral are given in the following theorem.
Theorem 1. Let I(t) = Rt
0φ(u)dW(u)be a random variable as defined above. The stochastic
integral I(t)has the following properties (i) For each t, I(t)isF(t)-measurable. (ii) Var[I(t)] =E[I(t)2] =ERt 0φ2(u)dW(u). (iii) Rt 0(aφ(u) +bφ(u))dW(u) = a Rt 0φ(u)dW(u) +b Rt 0 φ(u)dW(u),
where a and b are constants. (iv) I(t) is a martingale.
Theorem1is provided without a proof, reader is referred to section 3.2.A and 3.2.B
of Karatzas and Shreve [21] or 4.2 and 4.3 of Shreve [32]. Itô stochastic integral is first
constructed for so called simple processes (also step functions). For such integrands it is not too difficult to verify the above properties of Itô stochastic integral. General
integrandsφare then approximated using a sequence of simple processes converging
to φ. The properties of I(t) are then inherited from the properties of Itô stochastic
integral for simple integrands as pointed out in Theorem 4.3.1 by Shreve in [32].
Definition 10. Let(Ω,F,P)be a probability space and let W(t)be a Brownian motion onΩ with respect toF(t). Also let a : [0,T]×R → Rand b : [0,T]×R → R be measurable functions and X(0)beF(0)-measurable random variable. The stochastic differential equation is a stochastic differential:
dX(t) =a(t,X(t))dt+b(t,X(t))dW(t),t∈ (0,T) (2.5)
with an initial condition
X(0) =x0 ∈R, (2.6)
which may be random. A solution to the equation is a continuous stochastic process X(t)with respect toF(t)satisfying X(t) =x0+ Z t 0 a (s,X(s))ds+ Z t 0 b (s,X(s))dW(s),t∈ [0,T],
where the first integral is Lebesgue integral and the second one is an Ito stochastic integral. Theˆ solution is also called strong solution.
The existence of the solution for the above defined stochastic diferential equation and its uniqueness is provided by the following Existence and uniqueness of solutions theorem for stochastic differential equations.
Theorem 2. Let a : [0,T]×R → R and b : [0,T]×R → R be measurable functions satisfying
|a(t,x)|+|b(t,x)| ≤C(1+|x|),x∈R;t ∈[0,T], for some constant C and
|a(t,x)−a(t,y)|+|b(t,x)−b(t,y)| ≤D|x−y|;x,y∈R,t∈[0,T]
for some constant D. Then the equation (2.5) - (2.6), where X(0)isF(0)-measurable random variable satisfyingE|X(0)|2 < ∞ has a continous and unique solution X(t)with respect to F(t).
The first linear growth condition ensures that the solution process X(t) does not
explode, i.e. thatX(t)does not tend to go to infinity in finite time. The second,Lipschitz
condition guarantees that equation has a unique solution. Here uniqueness means that
ifX(t)andY(t)are two continuous processes satisfying the differential equation (2.5)
-(2.6) then
X(t) =Y(t),t∈[0,T], almost surely.
Such processes asX(t)andY(t)are called indistinguishable.
Lemma 3. Itô formula. Let V be a twice continuously differentiable function and let X(t), t ≥0, be a process defined in Definition10, whereσand b satisfy the conditions from Theorem 2. Then the process Y(t) =V(t,X(t))has a stochastic differential
dY(t) = ∂V ∂t +a t,X(t) ∂V ∂x + 1 2b 2 t,X(t)∂2V ∂x2 dt+a t,X(t)∂V ∂XdW(t). (2.7)
Proof 2. The proof of Itô formula can be found for example in Karatzas and Shreve [21] as Theorem 3.3.
2.3
Numerical solution for SDE
2.3.1 Euler schemeOne of the simplest time discrete approximations of a stochastic differential equation is the Euler approximation, also known as Euler-Maruyama approximation. We consider
stochastic processX= X(t), 0≤t ≤Tfollowing stochastical differential equation
dX(t) =a(t,X(t))dt+b(t,X(t))dW(t) (2.8)
on 0≤t ≤Twith initial value
X(0) =X0. (2.9)
Taking time discretization 0 = τ0 < τ1 < ... < τn < ... < τN = Tof the interval
[t0,T], an explicit Euler approximation is a continuous time stochastic process Y =
{Y(t),t0≤ t≤T}following the iterative scheme
Yn+1=Yn+a(τn,Yn)(τn+1−τn) +b(τn,Yn)(Wτn+1−Wτn), (2.10)
wheren=0, 1, 2...,N−1 with initial value
Y0= X0, (2.11)
and whereYndenotes the value of approximation at the time of discretizationτn
We will denote
∆n=τn+1−τn (2.13)
the nth time increment. Note that forb ≡ 0, the equation (2.10) reduces to
deter-ministic Euler scheme.
In order to compute the sequenceYn,n=0, 1, ...Nof values of the Euler approximation
we need to generate the random increments
∆Wn=Wτn+1−Wτn, (2.14)
forn=0, 1, ..,N−1 of the Brownian motionW(t),t≥0. As described earlier these
increments are independent Gaussian random variables with
E[Wn] =0 (2.15) and E (∆Wn)2 = ∆n. (2.16)
For this purpose we can use a sequence of independent Gaussian pseudo-random
numbers and we can simulate∆Wnby
∆Wn= Zn
p
∆n, (2.17)
where Znis a sequence of standard normal random variables,Zn ∼ N(0, 1)2. We
will shorten the scheme and from now on use the following form Yn+1=Yn+a∆n+bZ
p
∆n, (2.18)
for n = 0, 1, ...,N−1, where Z is a sample generated from the standard normal
distribution.
To measure the convergence of the approximations we shall define the following criterions. Let
δ=max
n ∆n (2.19)
and call it the time step. Yδ denotes the discrete time approximation with time
stepδ.
Definition 11. We say that the time discrete approximation Yδ converges weakly with order
β>0to X at time T if for any polynomial g there exists a constant C>0such that |E(g(X(T))−E(g(YN))| ≤Cδβ,
for eachδ,0<δ <T.
Definition 12. We say that the time discrete approximation Yδ converges strongly with order
γ>0to X at time T if there exists a constant C >0, such that
E(|X(T)−Yδ
N|)≤Cδγ,
for eachδ,0<δ <T.
The Euler approximations (2.18) converge in the strong sense with order γ = 0.5
and in the weak sense with orderβ=1, the proof can be found in Kloeden and Platen
[23].
2.3.2 Milstein scheme
Refining the Euler scheme (2.18) by adding an extra term using Itô lemma, see for
ex-ample [12], results in Yn+1=Yn+a∆n+bZ p ∆n+ 1 2b 0b(Z2−1)∆ n. (2.20)
The above scheme was derived by Milstein [28] and thus is referred to as Milstein
scheme. Milstein approximations (2.20) converge in strong orderγ=1 and weak order
Chapter 3
Options
Before we get to the point and define an option, let us describe what is an asset. We will use the asset to describe any financial object whose value is known at the present time but subject to changes in the future. We would mention following examples, which would qualify as an asset
• shares in company,
• commodities such as gold, oil or wheat,
• currencies, for example, the value of $1 ine.
Definition 13. A European call option gives its holder the right, but not the obligation to purchase from the writer a prescribed asset for a prescribed price at a prescribed time in the future.
The right, but not the obligation is what distinguishes options from other
deriva-tives1 such as forwards and futures, where the holder is obligated to buy or sell the
underlying asset. We will further refer to the prescribed purchase price as the strike price and the prescribed time in the future as the expiry date (also maturity).
The opposite of a European call option is a European put option.
Definition 14. A European put option gives its holder the right, but not the obligation to sell to the writer a prescribed asset for a prescribed price at a prescribed time in the future.
Options are very popular, sometimes more money is invested in the options and other than in the underlying assets. There are at least two good reasons to do so
(i) Options are attractive to investors for both speculation and hedging.
(ii) There is a particular way to determine how much they are worth, and thus they can be bought and sold with some confidence.
1By derivative we understand a financial instrument whose value depends on the price of an underly-ing asset.
Hedgers use derivatives to reduce risk they face from future movements on the market, whereas speculators use them to bet on the future direction of the market. For
more on types of trading, see for example Hull [17].
Let K denote the strike price andS(T)denote the asset price at the expiry date T.
S(t)is then the asset price at a general timet. We say that the value of the European
call option at the expiry date, denoted byc, is
c= (S(T)−K)+, (3.1)
which means, that at expiry date, if S(T) > K, then the holder can buy the asset
forK and sell it on the market forS(T), making profitS(T)−K. On the other hand,
if S(T) ≤ K, then the holder gains nothing. We can see this illustrated on the payoff
diagrams in Figure3.1, the piecewise linear payoff curves are sometimes called (ice)
hockey sticks. The value of the European put option, denoted aspis then
p= (K−S(T))+. (3.2)
We will consider data on index options, where settlement is always in cash, rather than by delivering the portfolio underlying the index. Also one contract is usually to buy or sell 100 times the index at specified strike price. These are called contract
multipliers. Consider for example one call contract with a strike price of K. If it is
exercised when the value of the index isS, the writer of the contract pays the holder
(S−K)∗100 in cash. S(T) c K 0 (a) S(T) p K K 0 (b)
Figure 3.1: Payoff diagram for a European call option (a) according to formula (3.1) and
3.1
Option markets
Options are traded on a number of official exchanges. First of them, Chicago Board Options Exchange (CBOE), was established by Chicago Board of Trade in 1973. Most exchanges work through the use of market makers, individuals, who are obliged to buy or sell options at any time they are asked to do so. Market makers will quote two prices, the bid and the ask. They will buy the option for the bid price and they will sell it for the ask price. Bid-ask spread is the difference between the ask and bid price and that is how the market makers make their profit, they do not speculate on the market.
Options are also traded directly between financial institutions, fund managers or corporations, these are called counter (OTC) deals. The trades in the over-the-counter market are typically much larger than trades in the exchange-trade market.
Another derivatives exchange is Eurex, established in 1998. One of the products it offers are the options on DAX (Deutscher Aktien IndeX). DAX is a stock market index consisting of the 30 major German companies trading on the Frankfurt Stock Exchange.
The following Figure 3.2 is a snapshot of Bloomberg Option Monitor (OMON)2
list-ing the bid and ask prices for the European Call options on DAX with expire date on September 20, 2013. Picture was taken on March 19, 2013 (185 days before expiry date).
Figure 3.2: DAX index Call Option Price Quotations. Source: Bloomberg Finance L.P.
3.2
Option prices
Option prices are available for a range of strike prices and expiry dates. Figure 3.2
shows prices only for a particular expiry date. The next Figure3.3shows market values
for S&P500 index call and put options, that were calculated as
Mid= (Bid+Ask)
2 (3.3)
and for various strike prices and expiry dates3. We can see that for a given expiry
date, the call option decreases as the strike price increases. Increasing the strike price has a negative effect on the payoff and hence it reduces the call option’s worthiness. Similarly with the price of the put option, where the put price increases with increasing strike price. 15000 1520 1540 1560 1580 1600 1620 10 20 30 40 50 60 70 80 90 100
Asset price now
Strike Call value Expiry in 30 days Expiry in 93 days Expiry in 184 days (a) 15000 1520 1540 1560 1580 1600 1620 20 40 60 80 100 120
Asset price now
Strike Put value Expiry in 30 days Expiry in 93 days Expiry in 184 days (b)
Figure 3.3: Market values for S&P500 Index call (a) and put (b) options for a range of strike prices and expiry dates from March 21, 2013.
Another observation can be made from the figures above. For a given strike price, both the call and the put option prices increase with time increasing to expiry date.
We will now introduce more financial jargon. At time t, a European call option is
said to be
• In the money (ITM) ifS(t)>K
• out of the money (OTM) ifS(t)<K, and
• at the money (ATM) ifS(t) =K.
Together, this concept is called "Moneyness of Options". In general, in the money means that there will be a positive payoff if the asset price stays as it is. Out of the
money means the asset must change by significant amount in order for a positive pay-off. The interval between in and out of the money is then defined as at the money.
3.3
Option valuation
In the early 1970s, Merton tackled a problem that had been partially solved by two other economists, Fischer Black and Myron S. Scholes: deriving a formula for the ‘correct’ price of a stock option. Grasping the intimate relation between an option and the underlying stock, Mer-ton completed the puzzle with an elegantly mathematical flourish. Then he graciously waited to publish until after his peers did; thus the formula would ever be known as the Black–Scholes model. Few people would have cared given that no active market for options existed. But coinci-dentally, a month before the formula appeared, the Chicago Board Options Exchange had begun to list stock options for trading. Soon, Texas Instruments was advertising in The Wall Street Journal, ‘Now you can find the Black–Scholes value using our . . . calculator.’ This was the true beginning of the derivatives revolution. Never before had professors made such an impact on Wall Street.
- Roger Lowenstein [25]. In this section we will briefly discuss the drawbacks and broken assumptions of the Black-Scholes-Merton model. But first we will give a very brief introduction to the Black Scholes model. In 1973 Fischer Black and Myron Scholes published their paper
called "The Pricing of Options and Corporate Liabilities" [5]. Price of a call optionc(S,t)
follows the Black-Scholes-Merton4partial differential equation
∂c ∂t + 1 2σ 2S2∂2c ∂S2 +rS ∂c ∂S−rc=0, (3.4)
where r is the risk free interest rate, σ is volatility, both constant parameters, t is
time andSis the stock price, satisfying terminal condition
c(S,T) = (S−K)+ (3.5)
and boundary conditions
c(0,t) =0, for 0≤t≤ T (3.6)
and
c(S,t)→S, asS→∞. (3.7)
4It is well documented that the three men cooperated on development of the option-pricing formula and in recognition of this Scholes and Merton were awarded by the 1997 Nobel Prize in Economics and it is widely accepted that Fischer Black, who died in 1995, would have also shared the prize if he had been still alive.
Analytical solution to the value of a European call option at timetis C(S,t) =SN(d+)−Ke−r(T−t)N(d−), (3.8) where d±= 1 σ √ T−t lnS K + r± σ 2 2 (T−t) , (3.9)
and N is the cumulative distribution function for the standard normal variable
N(0; 1). (T−t)is the time to expiry date,Kis the strike price as previously defined.
Sis the stock price at timetand the formula assumes it follows a geometric Brownian
motion
dS(t) =rS(t)dt+σS(t)dW(t), (3.10)
whererandσare constant defined as above.W(t)is Brownian motion. We will be
particularly interested in the constant volatility assumption, which is listed in Willmot
[35] as first assumption or as ideal condition (b) in Black and Scholes [5], since the
volatility parameter does not need to be constant as stated in Willmot [35] and still we
can find solution. We will give some arguments to break this assumption in the next
parts of this chapter. Paul Willmot discusses some more assumptions in [35] as well as
the consequences of dropping them.
Despite the forthcoming arguments, the formula (3.8) is still very popular among
option traders because it is simple and easy to use, with very few parameters. Also its drawbacks are quite well understood.
3.3.1 Volatility smile
The Black–Scholes call and put values depend on S, K, r , T−t and σ. Of all these
parameters, only the asset volatility σ can not be observed directly. One approach is
to extract the volatility from the observed market data. Knowing a quoted option call
valuec, and based on observed S,t,K,r and T , we can find suchσ that leads to this
value. Aσcomputed this way is known as an implied volatility (σis implied by data
on the market). To find suchσwe can use for example MATLAB function
sigma = blsimpv(S, K, r, tau, c) %tau=T-t
Let us use the following quote as a bridge to the definition of the phenomenon men-tioned in the name of the section.
"A smiley implied volatility is the wrong number to put in the wrong formula to obtain the right price."
Volatility smile is the pattern we can observe on a graph of implied volatility vs. strike price for a given expiry date. It will form an upturned curve similar to the shape of a smile, because in the money and out of the money options are observed to have higher implied volatilities than at the money options. However, as mentioned in Hull
[17] equity options traded in American markets did not show a volatility smile
be-fore the Crash of 1987 but began showing one afterwards. Despite the disparities, the Black–Scholes theory continues to be highly regarded by both academics and market traders. It is common among traders for option values to be quoted in terms of volatil-ity rather than price, because the implied volatilvolatil-ity tends to be less variable than the option price.
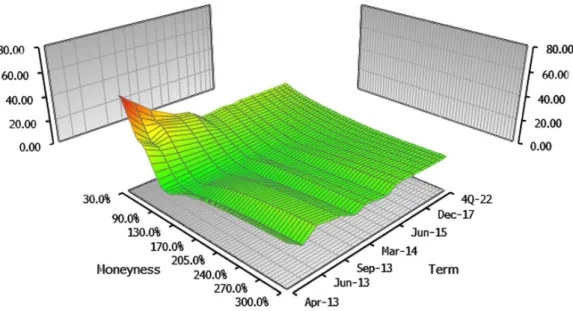
A related concept is that of term structure of volatility. It describes how (implied)
volatility differs for related options with different maturities. The next Figure3.4shows
an implied volatility surface 3D plot that plots volatility smile and term structure of volatility in a three-dimensional surface for DAX call options.
Figure 3.4: Graph of the DAX-implied volatility surface on March 21, 2013. Source: Bloomberg Finance L.P.
3.3.2 Historical volatility
Another approach to obtain the volatility parameterσfor the Black-Scholes model is to
use the historical data. But as we can see in Figure3.5 the volatility in real life is not
2004 2005 2006 2007 2008 2009 2010 2011 2012 2013 0 20 40 60 80 100 Years Volatilities % Hist Vol (10D) Hist Vol (30D) Hist Vol (50D)
Figure 3.5: 10/30/50-day historical volatilities for S&P 500 Index.
Whatsmore, fall in the stock price is often accompanied by a rise in volatility. It is
easy to observe this in the second half of 2008 in Figure3.6and especially in the weeks
following the bankruptcy of Lehman Brothers (September 15, 2008) and problems of other financial companies.
2004 2005 2006 2007 2008 2009 2010 2011 2012 2013 600 800 1000 1200 1400 1600
S&P 500 Index quote
Years
Figure 3.6: Historical quotes for S&P 500 Index.
Another valid point against using historical volatility is that we should be estimat-ing volatility for the time period that is about to come, but measurestimat-ing volatility from a
stock price series only yields an estimate for the volatility over the past time period.
3.3.3 Other models
Last but not least the Black-Scholes stochastic differential equation results in a
lognor-mal distribution of the random variableS(t)(its log is normally distributed). This is not
the case for the real market data, fat tails and the high central peaks can be observed
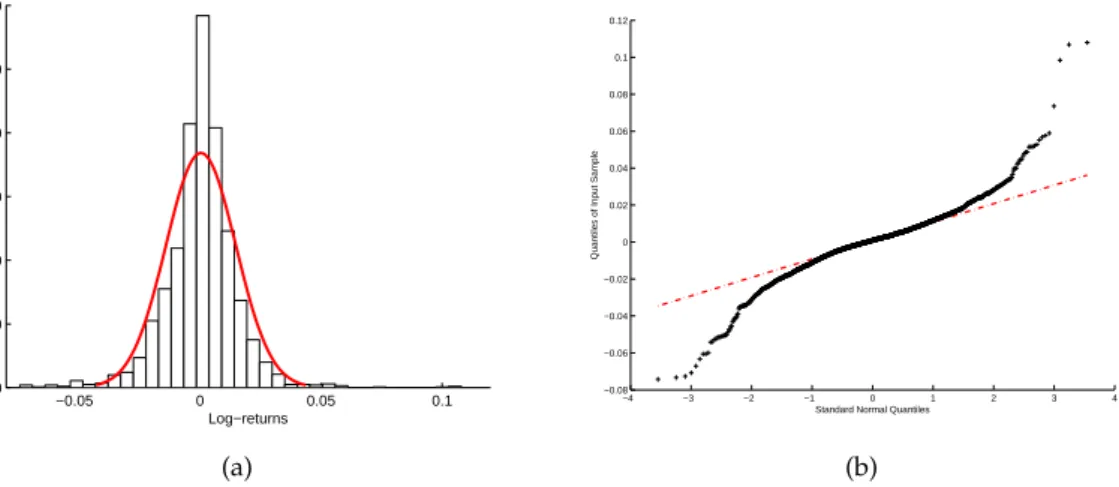
and are characteristics of mixtures of distributions with different variances [11]. We can
see the fat tails and highly skewed central peak in the following Figure3.7, extreme
events indeed occur more frequently than a model based on normal random variables would predict. −0.05 0 0.05 0.1 0 100 200 300 400 500 600 Frequency Log−returns (a) −4 −3 −2 −1 0 1 2 3 4 −0.08 −0.06 −0.04 −0.02 0 0.02 0.04 0.06 0.08 0.1 0.12
Standard Normal Quantiles
Quantiles of Input Sample
(b)
Figure 3.7: DAX daily log-returns vs. the normal distribution in red. Frequency distri-bution of 10 years in picture (a) and Q-Q plot in (b).
There have been numerous attempts to develop generalizations or alternatives to the lognormal asset price model. Many of these were motivated by the observations of the real market data. One known approach is to allow the volatility to be stochastic, another is to allow the asset to undergo ‘jumps’. In the next section we will introduce the Heston model, which allows the volatility to be stochastic.
Chapter 4
Heston model
4.1
Model dynamics
In this chapter we focus on stochastic volatility model introduced by Steven Heston in
[14]. The spot assetSat timetfollows the stochastic differential equation
dS(t) =rS(t)dt+
q
v(t)S(t)dWS(t), (4.1)
whereWS(t)is a Wiener process. The parameter rstands for the interest rate and
for simplicity it is assumed to be a constant. The square root ofv(t)is assumed to be an
Ornstein-Uhlenbeck process satisfying d
q
v(t) =−β
q
v(t)dt+δdWv(t), (4.2)
whereβ> 0 andδare real constants andWv(t)is another Wiener process, that has
a correlationρwithWS(t), i.e.
dWS(t)dWv(t) =ρdt. (4.3)
We can show that v(t) is the CIR process named after its creators John C. Cox,
Jonathan E. Ingersoll, and Stephen A. Ross [8]. Supposing X(t) = pv(t) and using
Itô’s lemma we can calculate the differential ofv(t) =X2(t)
dv(t) =2X(t)dX(t) + (dX(t))2 =2 q v(t)[−β q v(t)dt+δdWv(t)] +δ2dt, = [δ2−2βv(t)]dt+2δ q v(t)dWv(t),
this can be rewritten as
dv(t) =κ[θ−v(t)]dt+σ
q
which is the square-root mean reverting process with the long run varianceθ, mean
reversion rateκand with parameterσ, which is referred to as the volatility of the
vari-ance. It was described by Cox, Ingersoll and Ross in [8]. The variance process is always
positive and can not reach zero if 2κθ > σ2, this is often referred to as the Feller
condi-tion [10].
4.2
Option valuation
Using the standard arbitrage arguments from Merton [27] and Black-Scholes [5], the
value of any asset assetc(S,v,t)must satisfy the partial differential equation
1 2S 2v∂2c ∂S2 +ρσSv ∂2c ∂Sv+ 1 2σ 2v∂2c ∂v2 +rS ∂c ∂S +{κ[θ−v(t)]−λ(S,v,t)} ∂c ∂v −rc+ ∂c ∂t =0, (4.5)
where ρ, σ,κ are as above and the term λ(S,v,t)represents the price of volatility
risk and must be independent of the particular asset. Heston [14] assumed the risk is
proportional tov
λ(S,v,t) =λv. (4.6)
A European call option maturing at timeTwith strike priceKsatisfies the PDE (4.5)
subject to the boundary conditions:
c(S,v,T) = (S−K)+ (4.7) c(0,v,t) =0 (4.8) cS(∞,v,t) =1 (4.9) rS∂c ∂S (S, 0,t) +κθ∂c ∂v (S, 0,t)−rc(S, 0,t) + ∂c ∂t (S, 0,t) =0 (4.10) c(S,∞,t) =S (4.11)
Heston was looking for the solution of (4.5) in the form corresponding to
Black-Scholes formula
c(S,v,t) =SP1−KP(t,T)P2, (4.12)
where the first term represents the present value of the spot asset upon optimal exercise and the second term is the present value of the strike price payment
"P1 is the delta of the European call option and P2 is the conditional risk neutral
probability that the asset price will be greater then K at the maturity." Both of these
terms must satisfy the original PDE. Heston wrote them in terms of the logarithm of the spot price
x=lnS. (4.14)
When we substitute the solution (4.12) to the original equation (4.5), it shows that
P1andP2must satisfy
1 2v ∂2Pj ∂x2 +ρσv∂ 2P j ∂x∂v +1 2σ 2v∂2Pj ∂v2 + (r+ujv) ∂Pj ∂x + (a−bjv) ∂Pj ∂v +∂Pj ∂t =0, (4.15)
for bothj=1, 2, where the parametersuj,aj andbjare defined as follows
u1=
1
2, u2 =−
1
2, a=κθ, b1=κ+λ−ρσ, b2 =κ+λ. (4.16)
For the option price to satisfy the boundary conditions (4.7) - (4.11), the partial
dif-ferential equations (4.15) are subject to the terminal condition
Pj(x,v,T; ln[K]) =I{x≥ln[K]}, (4.17)
whereIis an indicator function. As explained in the Appendix of Heston [14], when
xis the stochastic process satisfying
dx(t) =[r+ujv(t)]dt+ q v(t)dWS(t), dv(t) =[a−bjv(t)]dt+σ q v(t)dWv(t),
where the parametersuj,a andbj remain as defined in (4.16), thenPj is the
condi-tional probability that the option expires in-the-money
Pj(x,v,T; ln[K]) =P[x(T)≥ln[K]|x(t) =x,v(t) =v]. (4.18)
Appendix of Heston [14] shows that the characteristic functions of these
probabili-ties satisfy the same partial differential equations (4.15), subject to the terminal
condi-tion
fj(x,v,T;φ) =eiφx. (4.19)
The characteristic function solution takes the form
where C(τ;φ) =rφiτ+ a σ2 (bj−ρσφi+d)τ−2ln 1−gedr 1−g , (4.21) D(τ;φ) = bj −ρσφi+d σ2 1−edr 1−gedr , (4.22) and g= bj−ρσφi+d bj−ρσφi−d, (4.23) d= q (ρσφi−bj)2−σ2(2ujφi−φ2), (4.24) forj=1, 2.
The termsP1,P2are defined via the inverse Fourier transformation, forj=1, 2
Pj(x,v,T; ln[K]) = 1 2+ 1 π Z ∞ 0 Re e−iφln[K]f j(x,v,T;φ) iφ dφ. (4.25)
The equations (4.12), (4.25) and (4.20) give the solution for European call options as
first introduced by Heston in [14]. The integrand in equation (4.25) is a smooth function
that decays rapidly and presents no difficulties as was pointed out also in [14].
4.3
Valuation under risk-neutral measure
In order to eliminate the parameterλwe define the risk-adjusted parameters
κ∗ =κ+λ
and
θ∗ = κθ
κ+λ,
thus substituting into equation (4.5) gives under the risk-neutral measure Pe, also
called equivalent1martingale measure (more on this topic can be found for example in
Chapter 5 of Shreve [32]) 1 2S 2v∂2c ∂S2 +ρσSv ∂2c ∂Sv+ 1 2σ 2v∂2c ∂v2 +rS ∂c ∂S +{κ ∗[ θ∗−v(t)]}∂c ∂v−rc+ ∂c ∂t =0. (4.26)
Since we are interested in pricing, we will assume that the Heston process with parameters fitted to option prices generates the risk-neutral measure so that the market
price of volatility riskλin the general valuation equation (4.5) is set to zero in equation
(4.26). Derivation of (4.26) can be found in Appendix. Under the risk neutral measure
we have now
a=κ∗θ∗, b1= κ∗−ρσ, b2 =κ∗.
In what follows, we will assume that the SDEs forSandvare in risk-neutral terms
because we are interested in fitting the Heston model to option prices. Effectively, we assume that we are imputing the risk-neutral measure directly by fitting the parameters
of the process that we are imposing, see Gatheral [11].
4.4
The Little Heston Trap
The Characteristic function solution is (4.20) as presented by Heston in [14], however
this formulation of the Heston characteristic function was later the subject of the paper
called "The Little Heston Trap" [1] by Albrecher et al., who investigated in detail the
properties and relations between the original formulation given by Heston and other
formulation presented for example in Gatheral [11], which is identical to the Heston
formulation, but causes fewer numerical problems in the implementation of the model.
Change of term (4.23) is desired and the new form is
g0 = bj−ρσφi−d
bj−ρσφi+d
, (4.27)
which is in fact
g0 =g−1, (4.28)
as well as change of formulation of termsC(τ;φ)given by (4.21) andD(τ;φ)given
by (4.22). The new formulations read
C(τ;φ) =rφiτ+ a σ2 (bj−ρσφi−d)τ−2ln 1−gedr 1−g , (4.29) D(τ;φ) = bj−ρσφi−d σ2 1−edr 1−gedr . (4.30)
These changes produce an equivalent formulation to the original Heston
formu-lation, but regarding properties of both formulations Albrecher et al. in [1] provided
proofs that the Heston formulation is unstable under certain conditions and the alter-native formulation is stable under the full parameter space. They also established a threshold maturity from which the Heston formulation suffers from instability. When the Feller condition is exactly satisfied, they encountered no problems in any of both
use the rotation count algorithm to overcome the discontinuities in the original Heston formulation.
Chapter 5
Simulation
5.1
Heston simulation schemes
Monte Carlo approach is a popular and flexible pricing alternative. As computational power still increases it may result in even wider application of Monte Carlo techniques in the near future. Especially for certain derivatives which can not be priced in a closed form.
5.1.1 Dynamics of the model
Let us consider the system dS(t) =rS(t)dt+ q v(t)S(t)dWeS(t), S(0):= S0≥0, (5.1) dv(t) =κ(θ−v(t))dt+σ q v(t)dWSe v(t) v(0):=v0 ≥0, (5.2)
where r, κ, θ andσ are as in previous chapter and(WeS,Wev)is a two-dimensional
Brownian motion under the risk-neutral measure Pe with instantaneous correlation ρ,
i.e.
dWeS(t)dWev(t) =ρdt. (5.3)
5.1.2 Euler scheme
Let us now apply the Euler scheme (2.18) to the variance process (5.2), a naive Euler
discretization of the variance process reads
vn+1= vn+κ(θ−vn)∆n+σ √
vnZv
p
∆n (5.4)
where Zv is standard normal random variable. The main problem when using the
above scheme is the fact, that the scheme does not preserve the positivity of the process.
P(vn+1<0) =P(Zv < −vn−κ(θ−vn)∆n σ√vn √ ∆n ) =Φ(−vn−κ(θ−vn)∆n σ√vn √ ∆n ),
asZvis standard normal variable,Φdenotes the standard normal cumulative
distri-bution function. This makes the computation of√vnimpossible and the time-stepping
scheme fails. To avoid this, the practitioners adopted two ways of fixing it. First ap-proach is referred to as the absorption. This apap-proach follows the rule that process equals to zero whenever it attains a negative value. The other approach is called
reflec-tion. The process is being reflected by its origin. i.e. : ifv<0 thenv= −v. [11]
The various schemes can be unified in the following framework vn+1 = f1(vn) +κ(θ− f2(vn))∆n+σ
q
f3(vn)Zv
p
∆n, (5.5)
where fi(x) =xforx≤0 andi=1, 2, 3 and f3(x)≤0 for allx ∈R.
The particular choices for the "fixing" functions fi(x)in the literature are the
iden-tity function (f(x) = x), for the absorption(f(x) = x+), wherex+ = max(x, 0)and
(f(x) = |x|) for reflection. In the paper by Higham and Mao [15] the scheme uses
the following configuration f1(x) = f2(x):= xand f3(x) := |x|, whereas for example
in paper by Deelstra and Delbaen [9] f3(x) := x+ is used. All schemes coincide and
are to be bias-free as ∆n → 0 and so the choice of the fix functions may seem almost
indifferent, but the contrary is true. While some schemes are extremely biased for prac-tical sizes of the time step, others turn out to be almost bias-free for not "too extreme
parameter configurations" as pointed out in [34] by Van Haastrecht and Pelsser.
According to the paper by Lord et al. [24] scheme called the full truncation scheme
produces the smallest bias, closely followed by the moment-matching, Euler scheme
using log-normal approximation by Andersen and Brotherton-Ratcliffe [3] and the
par-tial truncation scheme by Deelstra and Delbaen in [9].
The full truncation scheme uses f1(x):= xand f2(x) = f3(x):= x+. The resulting
Euler scheme reads
vn+1=vn+κ(θ−v+n)∆n+σ q v+nZv p ∆n, (5.6) wherex+=max(x; 0).
The simulation schemes of the corresponding asset price process (5.1) is then
Sn+1= Sn+rSn∆n+Sn
q v+nZS
p
∆n, (5.7)
where ZS is standard normal random variable with correlation ρ to Zv. This pair
of correlated standard normal random variables Zv andZS with a correlation ofρ
be-tween the driving Brownian motions using Cholesky decomposition can be simulated by setting
and
ZS :=ρZv+
q
1−ρ2Z2, (5.9)
whereZ1andZ2are two independent draws from the standard normal distribution.
Alternatively, the process for logS(t)can be simulated, and then exponentiated. If
we discretize log-stock priceSrather than the stock priceS, there are no higher order
corrections to the Euler discretization for details, see [11]. The log-Euler scheme
log(Sn+1) =log(Sn) + [r− 1 2v + n]∆n+ q v+nZS p ∆n. (5.10)
as noted in [34] does not entail any discretization error in the stock price direction,
on the other hand the scheme usually shows biases in the Euler discretization of the variance process (and thus in resulting stock prices).
5.1.3 Milstein scheme
Now we consider the scheme (2.20), which is a refinement to the Euler scheme
pro-duced by adding an extra term using Itô lemma. As pointed out by Gatheral in [11],
applying this scheme to the variance process yields reduced frequency with which the process goes negative relative to the Euler scheme. Nevertheless, negative values still
appear and we have to adopt similar fixes. Asa=κ(θ−vn)andb=σ√vnthe scheme
reads vn+1=vn+κ(θ−v+n)∆n+σ q v+nZv p ∆n+ 1 4σ 2(Z2 v−1)∆n, (5.11)
whereZv stands for standard normal random variable. Similarly we can apply the
scheme (2.20) to the the processS(t), as this timea=rS(t)andb=S(t)√vtproduces
Sn+1=Sn+rSn∆n+Sn q v+nZS p ∆n+ 1 2Snv + n(Z2S−1)∆n, (5.12)
where ZSis standard normal random variable with correlationρ toZv. This
how-ever is not a refinement to the log-Euler scheme for the log-stock priceS introduced
earlier as (5.10).
5.1.4 Kahl-Jäckel scheme
Introduced in Kahl and Jäckel [20] as IJK scheme, it follows
vn+1 =
vn+κθ∆t+σ√vnZv
√
∆t+14σ2∆t(Zv2−1)
log(Sn+1) =logSn+r∆n− 1 4(Vn+1+Vn)∆n+ρ √ Vn p ∆nZv+ 1 2( √ vn+ +√vn+1)(ZS−ρZv) p ∆n+ 1 4σρ(Z 2 v−1)∆n.
This scheme was developed as adrop-inreplacement for the standard log-Euler
pro-cedure since it requires no additional random numbers per step or any adaptive
refine-ment. Authors Kahl and Jäckel [20] claim the IJK scheme is not superior in convergence
order to the log-Euler scheme, but they praise the fact that it excels over other equally simple methods by showing a superior convergence behaviour that is faster by a mul-tiplicative factor.
5.1.5 Haastrecht and Pelsser [34] revised
Haaserecht and Pelser commented on Kahl-Jäckel scheme implemented in the
follow-ing way. Conditional on timesa discretization of the log Stock price processSfort>s
(withδt:=t−s) reads exactly
log(S(t)) =log(S(s)) + [r− v(s) +v(t) 4 ]∆t+ρ q v(s)ZV √ ∆t+ + 1 2( q v(s) + q v(t))(ZS+ρZV) √ ∆t+ ρξ∆t 2 (Z 2 V−1)
We left the original notation as well. This however does not match our
implementa-tion of the scheme. The Heston log priceScomes from the formula by Kahl and Jäckel
[20], which is exactly lnStn+1 =lnStn+µ∆tn− 1 4(V 2p tn +V 2p tn+1)∆tn+ρV p tn∆Zn+ 1 2(V p tn+V p tn+1)(∆Wn−ρ∆Zn) + 1 2ρpV p−1 tn bn·(∆Z 2 n−∆tn).
For Heston model we have parameter p= 12. Also note that∆W = ZS
√
∆tand∆Z
isZV
√
∆tto match the notation a bit as well.
Clearly the sign in the term (ZS+ρZV)is wrong and should be (ZS−ρZV)instead.
What appears not to be a typo is the the mistake in the last term, where there is 12
in-stead of 14 compared to our equation. bn is ξvnp for Heston in the original article by
Kahl and Jäckel [20]. This implies b(s) = ξv(s)1/2, which cancels out with v(s)−1/2
and leavesξin the notation of Haastrecht and Pelsser. This is probably due to the fact
that the IJK scheme in Kahl-Jäckel [20] was not stated explicitly for Heston model. The
wrongly interpreted scheme published in [34] can be found in some other papers as
5.1.6 Exact scheme
In Broadie and Kaya [6] an exact simulation algorithm has been devised for the Heston
model. In numerical comparisons of their algorithm to an Euler discretisation with the absorption fix, they find that for the pricing of European options in the Heston model and variations thereof, the exact algorithm compares favourably in terms of
root-mean-squared (RMS) error. According to Broadie and Kaya [6] the volatility at timet, given
the values ofvuand foru<t, can be written as
vt =vu+κθ(t−u)−κ Z t u vsds +σ Z t u √ vsdWs(1) (5.13)
and similarly the stock price at time t, given the values ofSuandvuforu < t, can
be written as log(St) =log(Su) +r(t−u)−1 2 Z t u vsds +ρ Z t u √ vsdWs(1)+ q 1−ρ2 Z t u √ vsdWs(2), (5.14)
whereW(1)andW(2)are uncorrelated Brownian motions. SubstitutingRt
u
√
vsdWs(1)
from (5.13) into (5.14) yields
log(St) =log(Su) +r(t−u) + κρ σ − 1 2 Z t u vsds + ρ σ (vt−vu−κθ(t−u)) + q 1−ρ2 Z t u √ vsdW (2) s . (5.15)
The exact simulation method uses sampling exactly from the distribution ofvt. This
can be done givenvufor someu<tby using sampling from the noncentral chi-squared
distribution. The next step havingvtand sample fromvuis generating a sample from
the distribution of the integralRt
uvsds.
This is done by inverting the characteristic function. Broadie and Kaya uses this
ap-proach to obtain the probability function of the random variableV(u,t), which has the
same distribution as the integralRutvsdsconditional onvuandvt. They use the
trape-zoidal rule to compute the probability distribution. The value of the integral is then simulated by the inverse transform method. By first generating a uniform standard
normal variableUand then looking for the value ofxfor which the Pr{V(u,t)≤ x}is
equal toU.
Knowing all the terms in (5.13) except forσRut
√
vsdWs(1), the value ofσRut
√
vsdWs(1)
can be easily obtained from (5.13). Furthermore they use the fact thatvtis independent
of the Brownian motionW(t)(2)and therefore the distribution ofRt
u
√
vsdWs(2)given the
path generated byvtis normal with mean 0 and varianceRut
√
vs. This scheme gives an
The algorithm is however very time-consuming, because of the application of the numerical inversion of a cumulative distribution using the characteristic function in-volving modified Bessel function of the first kind. Also we found out that with finer discretization the modified Bessel function of the first kind takes too large values (in particular - unrepresentable values). Therefore it is not recommended for the pricing of options when requiring the value of the asset price on a larger number of time instants.
Nonetheless, (5.15) will be used in the next sections.
5.1.7 QE scheme
The Quadratic Exponential scheme, also known as QE was introduced by Andersen [2].
It exploits the fact that the valuevn+1conditional on valuevnfollows a non-central
chi-square distribution. It uses two different approximations to the non-central chi-chi-square distribution, depending on the values of the variance.
The non-centrality paramater of the distribution forvn+1is proportional tovnand
for sufficiently large values ofvnthe scheme uses a power function applied to a
stan-dard normal variableZvto approximatevn+1. Thus a critical levelψC ∈ [1, 2]is
intro-duced and compared toψ, which is given by
ψ=s2/m2, where givenvn s2 = vnσ 2e−κ∆n κ (1−e −κ∆) +θσ 2 2κ (1−e −κ∆)2 and m=θ+ (vn−θ)e−κ∆n.
The algorithm usesUv, which is a uniform random number.
1. Ifψ≤ψCwe set vn+1 =a(b+Zv)2, where a = m 1+b2, b2 =2ψ−1−1+ q 2ψ−1 q 2ψ−1−1≥0 and Zv=Φ−1(Uv). 2. Ifψ>ψCwe set
vn+1=Ψ−1(Uv;p,β), where Ψ−1(u) =Ψ−1(u;p, β) = ( 0 for 0≤u≤ p β−1log 11−−up forp< u≤1, p= ψ−1 ψ+1, and β= 1−p m .
As stated above the value of ψC indicates which approximation to use. The first
approximation can be only used forψ ≤ 2. For higher values ofψ, that correspond to
low values ofvn, the scheme will fail. Forψ≥1 the second one can be used. Therefore
ψC ∈[1, 2]. Andersen in [2] states that the exact choice forψCappears to have relatively
small effects on the quality of the overall simulation scheme and proposesψC =1.5.
This scheme can not be used with the Euler discretization of S(t), since it would
result in too feeble effective correlation and, consequently, paths of S with poor
dis-tribution tails. Instead Andersen used the exact scheme from Broadie and Kaya (5.15)
and tried to preserve the key driver of the correlation betweenSn+1andvn+1, which is
ρ
σvn+1. Instead of sampling the integral
Rt
uvsdshe used an approximation
Z t
u vsds
≈∆n[γ1vn+γ2vn+1],
where setting γ1 = 1, γ2 = 0 yields Euler like setting. For the last integral same
approach as in (5.14) is applied, thus
Z t u √ vsdWs(2) ≈ √ γ1vn+γ2vn+1ZS p ∆n,
where ZS is standard normal random variable. This leads to the following
dis-cretization scheme forS(t)
log(Sn+1) =log(Sn) +K0+K1vn+K2vn+1+
p
K3vn+K4vn+1·ZS, (5.16)
whereK0, ...,K4are given by:
K0= − ρκθ σ ∆n, K1 =γ1∆n κρ σ − 1 2 − ρ σ, K2 =γ2∆n κρ σ − 1 2 + ρ σ, K3 =γ1∆n(1−ρ2), K4=γ2∆n(1−ρ2).
andγ1 = γ2 = 0.5 for a central discretization of the time integral ofvin the exact
scheme.
Equation (5.16) is the exact proposal as can be found in Andersen [2]. However, we
will also include the drift, thus the resulting scheme we will use forS(t)reads
log(Sn+1) =log(Sn) +r∆n+K0+K1vn+K2vn+1+
p
K3vn+K4vn+1·ZS. (5.17)
5.1.8 E+M scheme
We will also consider a combination of the exact scheme for the underlying asset pro-cess with Milstein scheme for the volatility propro-cess. The motivation for this is the fact that the frequency of negative values of the variance process decreases for the Milstein
scheme (5.11) compared to Euler as pointed out for example in Gatheral [11]. The
mo-tivation behind the use of the exact scheme by Broadie and Kaya (5.15) is that it can be
used for discretizations on a larger number of time instants when not trying to sample the integral, but using an approximation instead.
Thus, we expect this scheme to perform better than Milstein and log-Euler scheme. The question is whether it can outperform the QE scheme, because QE scheme ap-proximates the non-central chi-square distribution and therefore does not suffer from negative values for the variance process. However, the proposed scheme does not in-clude switching between different approximations, which makes it easier to implement and quite possibly faster compared to the QE scheme.
5.2
MC simulations
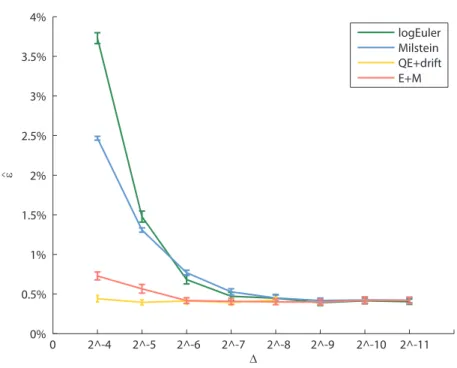
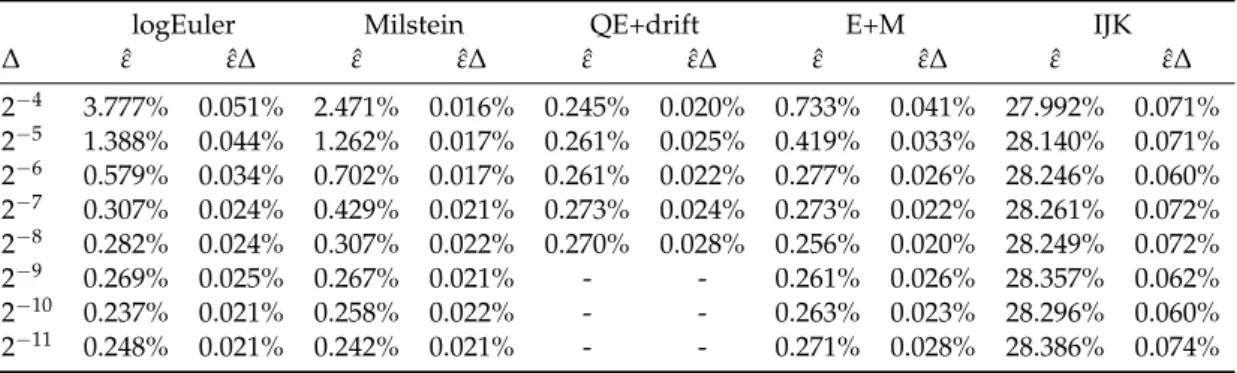
Most of the tests done in previous literature are quite easy to pass, they typically involve at-the-money options and model parameters are not similar to what we we are about to obtain in the Chapter 7. Thus we aim to test the schemes using parameters obtained from real market and for range of Strikes, that is also similar to market range.
Table 5.1: Set of used parameters from March 19, 2013.
Parameter Value v0 0.02497 kappa 1.22136 theta 0.06442 sigma 0.55993 rho -0.66255 S0 7962.31 r 0.00207
We use the set of parameters listed in Table5.1. The model implied parameters were obtained by Genetic algorithm and then refined using nonlinear least-squares method. Using the model with this set of parameters we were able to obtain prices with mean absolute relative error of 0.65% and maximum absolute relative error of 2.22%. For details, see Chapter 7.
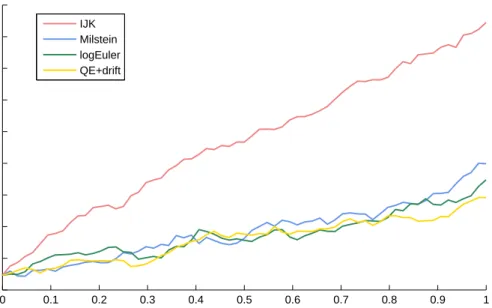
However, as we stated above the choice of the parameters can cause problems. The
following Figure 5.1 shows the mean path of the underlying asset for the examined
schemes. We used∆=2−6andT=1. Number of simulations was nPaths=100 000.
0 0.1 0.2 0.3 0.4 0.5 0.6 0.7 0.8 0.9 1 7960 7965 7970 7975 7980 7985 7990 7995 8000 8005 t S(t) IJK Milstein logEuler QE+drift
Figure 5.1: Mean of 100000 paths using parameters from Table5.1,∆=2−6andT=1.
It is clear in Figure5.1 that the paths simulated by IJK scheme differ significantly.
This behaviour is invariable over changing number of simulation and the step size ∆
and results in great errors when trying to price the options using Monte-Carlo method. IJK scheme clearly does not work for this set of parameters and thus we will consider it as a competing scheme. Nonetheless the results for IJK scheme will be presented for illustration.
It is arguable whether the IJK scheme is of any practical use, since even with so to speak friendlier set of parameters the IJK scheme seems to be outperformed by the other schemes presented here.
5.3
MC test
We designed the following test for measuring performance of pricing the options using the previous schemes.
We have four maturities at times T=0.25, 0.5, 0.75 and 1. We will be pricing 28 options for each maturity with strikes
7100, 7200, ..., 7500, 7550, 7600, ..., 8350, 8400, 8500, ..., 9000
We can compute the price of the options at time 0 denoted asC(0)with the
param-eters from Table5.1using the pricing formula from the previous chapter for all values
ofKand for each maturity. Resulting in 4*28=112 option prices.
Similarly we can use the Monte-Carlo method and compute the approximate value ˆ
C(0)by computing the expectation
ˆ
C(0) =e−rTE[(Sˆ(T)−K)+], (5.18)
where we will be using the introduced schemes to approximate the value of S(T)
by ˆS(T). In particular, for each scheme for ˆS(T)we will draw nPaths independent
samples of ˆS(1)(T), ˆS(2)(T),... ˆS(nPaths)(T), where nPaths=100 000, 250 000 and 500 000
using time grid with step∆=2−6, ..., 2−11. Thus ˆC(0)will be estimated as
ˆ C(0)≈e−rT 1 nPaths nPaths
∑
i=1 (Cˆ(i)(T)−K)+. (5.19)This will lead to error
e =C(0)−Cˆ(0). (5.20)
We will be measuring errors for different steps ∆and also number of simulations
used in terms of mean absolute relative error, thus
ˆ εj = 1 N N
∑
n=1 |C(0)−Cˆ(0)| C(0) , (5.21)where N is the number of options, in our case N = 112. However ˆεj will be a
random variable taking different value in different batch j= 1, ..,M. We will estimate
the variance σε2 of ˆεby arranging the nPaths simulations into M batches and use it to
construct a confidence interval for the absolute errorε. In particular we will estimate
the mean of the batch averages
ˆ ε= 1 M M