Poverty in Australia 2016
The fifth edition of ‘Poverty in Australia’, part of the ‘Poverty and Inequality
in Australia’ series from the Australian Council of Social Service and the Social Policy
Research Centre.
Poverty in Australia was published in 2016 by the Australian Council of Social Service: Locked Bag 4777
Strawberry Hills, NSW, 2012 Australia Email: [email protected]
Website: www.acoss.org.au ISSN: 1326 7124
© Australian Council of Social Service
This publication is copyright. Apart from fair dealing for the purpose of private study, research, criticism, or review, as permitted under the Copyright Act, no part may be reproduced by any process without written permission. Enquiries should be addressed to the Publications Officer, Australian Council of Social Service. Copies are available from the address above.
This edition of Poverty in Australia has been prepared by Penny Dorsch, Jacqueline Phillips and Charmaine Crowe for the Australian Council of Social Service with research conducted by Professor Peter Saunders, Bruce Bradbury and Melissa Wong from the Social Policy Research Centre at the University of New South Wales.
Who we are
ACOSS is the peak body of the community and social service sector and the national voice for the needs of people affected by poverty and inequality. Our vision is for a fair, inclusive and sustainable Australia where all individuals and communities can participate in and benefit from social and economic life.
The Social Policy Research Centre (SPRC) is a research centre at UNSW Australia. Since 1980, we have been a centre for innovative applied research concerned with the social policies which affect all our lives. Our research is designed to be both academically rigorous and to be useful to those developing social policy and those using it.
What we do
ACOSS leads and supports initiatives within the community and social service sector and acts as an independent non-party political voice. By drawing on the direct experiences of people affected by poverty and inequality and the expertise of its diverse member base, ACOSS develops and promotes socially and economically responsible public policy and action by government, community and business. Find out more on our website at http://www.acoss.org.au
The SPRC is a multidisciplinary centre undertaking research across a wide range of social policy areas. On the basis of our research we seek to influence existing policies, to inform the development of new policies, and to identify good practice.
Thanks to our partners:
Contents
Forewords 5
Executive Summary 7
Snapshot of poverty in Australia in 2014 8
About this Report 9
Poverty lines 11
The rate and profile of poverty 11
Poverty trends: 2003-4 to 2013-14 17
Headline trends 17
Lone parent households 19
People who are unemployed 19
Over 65’s 20
Poverty levels in 2013-14 22
Family Type 22
Child poverty 22
Labour Force Status 24
Main Income Source 26
Poverty among people receiving Income Support Payments 27
Comparison of payment rates and poverty lines 29
Payment indexation 29
Housing Tenure 30
Gender 32
Age 33
People with a disability 34
Aboriginal and Torres Strait Islander People 36
International Comparison 37
APPENDIX 38
Other Measures of Hardship 38
Financial Stress 38
Deprivation 38
Housing Stress 39
Food Insecurity 39
List of Figures
Figure 1: Poverty trend (50% of median, after housing costs) 17
Figure 2: Child poverty trend (50% of median, after housing costs) 18
Figure 3: Lone parent households poverty trends (after housing costs) 19
Figure 4: Unemployed households poverty trends, after housing costs 20
Figure 5: People aged 65+ poverty trends (after housing costs) 21
Figure 6: People aged 65+ poverty trends (before housing costs) 21
Figure 8: Rate of child poverty 23
Figure 9: Profile of child poverty, 50% median 24
Figure 10: Profile of child poverty, 60% median 24
Figure 11: Rate of poverty by labour force status 25
Figure 12: Profile of poverty by labour force status, 50% median 26
Figure 13: Profile of poverty by labour force status, 60% median 26
Figure 14: Rate of poverty by main income source 26
Figure 15: Profile of poverty by main income source, 50% median 27
Figure 16: Profile of poverty by main income source, 60% median 27
Figure 17 Difference betwen pension and allowance payments, December 2013 28
Figure 18: Trends in payment rates compared with average wages 30
Figure 19: Rate of poverty by housing tenure 31
Figure 20: Profile of poverty by housing tenure, 50% median 31
Figure 21: Profile of poverty by housing tenure, 60% median 31
Figure 22: Rate of poverty by gender 32
Figure 23: Profile of poverty by gender, 50% median 32
Figure 24: Profile of poverty by gender, 60% median 32
Figure 26: Profile of poverty by age, 50% median 34
Figure 27: Profile of poverty by age, 60% median 34
Figure 28: Rate of poverty for people with a disability (core activity limitation), 2013-14 35 Figure 29: Profile of poverty for people with a disability (core activity limitation), 50% median income 35
Figure 30: Rate of poverty by location 36
Figure 31: Ratio of poverty in OECD countries, 2014 (or nearest year) 38
List of Tables
Table 1: Poverty Lines by family type, 2013-14 ($/week after tax, including social security payments, before and after
housing costs) 10
Table 2: Poverty lines by family type, 2013-14 ($ / week after tax, including social security payments) 11 Table 3: Number and proportion of people below the 50% and 60% of median poverty lines 11 Table 4: Rate of poverty - proportion of people from different groups living below poverty lines in 2013-14 12 Table 5: Profile of poverty - proportion and numbers of people from different groups living below poverty lines in
2013-14 (%) , 14
Table 6:. Comparison of poverty lines for family types with selected social security payments by family type ($ per
week) - before housing costs 28
Table 7:. Average gap between the total income of those below the poverty line and the relevant poverty line, 2013-14
(dollars per week) - after housing costs 29
Foreword
Dr Cassandra Goldie - Chief Executive Officer, ACOSS
This is the fifth Poverty Report ACOSS has published in partnership with the Social Policy Research Centre (SPRC) at the University of New South Wales. I am proud that we are continuing to work together to produce a stable, independent evidence base on poverty and inequality in Australia.
I want to particularly acknowledge the invaluable expertise of Professor Peter Saunders and colleagues at the SPRC, Associate Professor Bruce Bradbury and Dr Melissa Wong. Peter’s work is internationally renowned and his academic leadership has given this series consistency and authority, and greatly contributed to the standing of these reports in the field.
This report has also been made possible thanks to the generous support of the Australian Communities Foundation (Social Justice Fund), St Vincent de Paul Society, Mission Australia, and the Salvation Army.
This latest Poverty Report 2016 finds that Australia has failed to reduce the level of overall poverty in our community over the 10 years to 2014, with 13.3% of the population (2.99 million people) living below the poverty line in 2013-14. Alarmingly, there has in fact been a 2 percentage point rise in the number of children living in poverty in the period, now 17.4% (731 300 children).
The majority of people living in poverty receive social security payments as their main source of income, underscoring the Government’s direct role in preventing poverty through ensuring adequate income support payments. At the same time, a third of people living in poverty rely on wages as their main source of income. The evidence is clear that a job does not guarantee an adequate income and we must look at both social security settings, labour market policies and jobs growth if we are to successfully address poverty.
Unfortunately, our political leaders often seem more concerned with providing the next tax cut than with reducing poverty and inequality. Successive budgets have cut income support payments to those with the least, including low-income families despite persistent and increasing child poverty in Australia. The low level of unemployment payments is broadly recognised as acting as a direct barrier to securing stable work. And although we have committed to the Sustainable Development Goals, which list eradicating poverty as goal number one, we are yet to set a national poverty benchmark.
We need to shift the mindset that poverty is a reflection of the individual and instead view eradicating poverty as a shared responsibility.
We should all be able to feel secure in the knowledge that, regardless of what life throws at us, including the ability to get a job, we will have enough income to afford shelter, food and other essentials. Such security strengthens communities and boosts opportunities for all. We can change lives if we are bold enough to eradicate poverty but we need to think big, show leadership and work together across community, academic, government and business sectors if we are to succeed. I hope these reports, and the partnership that underpins them, contribute to that effort; may the findings be a call to action to our national leaders to set a national poverty target and develop a national poverty reduction plan which includes a long overdue increase to the unemployment payment.
“
We need to
shift
the mindset that poverty
is a reflection of the individual, and instead
view
eradicating poverty
as a
shared
Professor Peter Saunders - Social Policy Research Centre, UNSW
This is the latest in the series of Poverty Reports prepared by the Social Policy Research Centre (SPRC) for ACOSS. It fulfils a long-term personal ambition that we would have regular, authoritative reporting on how Australia is faring in terms of poverty and is complemented by a companion series focusing on the broader issue of economic inequality. Both topics are important to large numbers of Australians and these reports allow us to take stock of the situation, understand who is affected, monitor progress, raise awareness, develop appropriate responses and pressure governments to take action.
We learnt recently that Australia has outperformed other OECD economies by achieving 25 consecutive years of positive economic growth. That is a formidable achievement and one that is justifiably a source of collective pride. It means that someone born in 1991 now lives in a country where household disposable income is about twice the level it was when they were born, even after taking account of rising prices and population growth. The economic pie has grown substantially over the period, but many are still missing out, as the figures in this report indicate.
The after housing costs ‘headline’ poverty rate in 2013-14 stands at 13.3 per cent – down slightly from its level in 2011-12 and down more from the peak of 14.4 per cent in 2007-08. The recent trend is thus heading in the right direction, but the rate is still above what it was a decade before, in 2003-04. The figures thus provide some comfort but there are certainly no grounds for complacency. Almost 731,300 children are living in families below the poverty line after taking account of housing costs and many will bear the scars of unmet need, exclusion and limited opportunities into their youth and adulthood.
Despite its strong economic performance, Australia’s 2014 poverty rate ranks 14th highest out of 36 OECD countries – well below that in the United States which is second-highest at 17.5% but way above that in Denmark, which is second-lowest at 5.4%. The fact that there are 6 countries with a poverty rate of 8% or less shows that it is possible to make substantial in-roads, even in countries that we have consistently outperformed economically.
Poverty is, of course, about far more than statistics and dollars and the case for eradication rests on the human misery and suffering it brings and the opportunities denied to its victims. We need to address poverty not only because it is bad for those it affects, but also because it leads to other things that are bad – bad for individuals and families, bad for society and bad for the economy. Poor health is often a consequence of poverty. It prevents people from realising their potential to contribute economically, thus reducing economic output and placing extra demands on our health care system. Tackling poverty will thus lead to better overall health, a more productive workforce and fewer demands on a health system that is already stretched to the limit: a win-win situation.
We need as a society to commit to tackling poverty in all its forms so that every Australian faces the same level playing field of opportunity. This report reveals that much of what is involved in achieving this simple but inspiring goal still lies ahead. We have proven adept at generating the economic resources needed to reach that goal, now we need to use them wisely to help get us there. We can do better, and we should.
“
We need as a society to commit to
tackling poverty
in all its forms so that every
Australian faces the same level playing field
of
opportunity.
”
The majority of people below the poverty line relied on social security as their main source of income (57.3%), but a significant proportion received wages as their main income (32%). This division has not changed significantly from the previous reports, with wage earners comprising about a third of those in poverty in 2010 (29%) and 2012 (33%).
While an overall minority of people receiving social security payments fell under the poverty line in 2014 (36.1%), a majority of Newstart (55%) and Parenting Payment (51.5%) recipients were in this category. A number of social security payments fell significantly below the poverty line, including most notably the unemployment payment. For a single person with no children, Newstart in 2013-14 fell $109.55 per week below the poverty line. Youth Allowance was even further below: for a single person with no children it fell $158.63 per week below the poverty line. These figures take Rent Assistance into account, so the gaps were even higher for households not eligible for this supplementary payment.
Unemployed households experienced poverty at the highest rate of all the population groups analysed at 63.2%, a 2% increase since 2012. People of working age not in the labour force had a poverty rate of 43.9% and lone parent families 33.2%.
Analysis by housing tenure shows that the vast majority of people below the poverty line were in rental housing in 2014 (59.7%), with most in private rental housing (44.2%) compared with 11.4% in public. Only 15.5% of people living below the poverty line were homeowners, with a slightly higher proportion being mortgagees than outright owners.
Executive Summary
In 2014, the 50% of median income poverty line for a single adult was $426.30 a week (or $343.00 for income after housing costs). For a couple with children it was $895.22 a week (or $720.22 after housing). Using the after-housing poverty line, the headline poverty rate in 2014 is 13.3%, slightly lower than the 2012 rate (13.9%).1 Long term analysis indicates an overall trend of
persistent and entrenched poverty over the decade. Of most concern, there was a 2% increase in child poverty from 2004 to 2014, with the trend most pronounced for children in lone parent families.
Internationally, Australia’s poverty rate remains above the OECD average, despite our relative prosperity. In population terms, there were 2.99 million people living below the poverty line after taking account of housing costs in 2014.2 The poverty rate for children remained significantly higher than for adults at 17.4%, affecting 731,000 children. This was little changed from 2012 when the child poverty rate was 17.7%. Of concern, the child poverty rate for children in lone parent families increased from 36.8% in 2012 to 40.6% in 2014. By family type, lone parents experience the highest poverty rates at 33.2% and this has been a consistent trend throughout the decade. The rate of poverty for lone parents has increased since 2012, a year in which 80,000 sole parents were moved from pension to (much lower) allowance payments. Children in lone families are more than three times more likely to be living in poverty than their counterparts in couple families, with a poverty rate of 40.6% compared to 12.5%.
1 This change was not statistically significant, and is likely largely due to stagnant wage growth between 2012-2014 constraining growth in the median income, resulting in a lower poverty line and rate than would otherwise have been the case.
2 Population numbers are not directly comparable with previous reports due to a change in methodology, and the inclusion of self-employed households. For more information, see the Methodology Paper.
Snapshot of poverty in Australia – in 2014:
• The poverty line (50% of median income) for a single adult was $426.30 a week. For a couple with 2 children, it was $895.22 a week.
• 2.99 million people (13.3% of the population), were living below the poverty line, after taking account of their housing costs.
• 731,300 children under the age of 15 (17.4% of all children) were living below the poverty line.
• The proportion of people in poverty was slightly lower than in 2012, a decrease of 0.6%, from 13.9% in 2012. However, the 2014 headline poverty rate reflects persistent and entrenched poverty over the decade. • Child poverty in Australia increased by 2 percentage points over the decade 2003-04 to 2013-14.
• 36.1% of people receiving social security payments were living below the poverty line, including 55% of those receiving Newstart Allowance, 51.5% receiving Parenting Payment, 36.2% of those receiving Disability Support Pension, 24.3% receiving Carer Payment, and 13.9% of those on the Age Pension.
• 57.3% of people below the poverty line relied upon social security as their main income and 32.1% relied upon wages as their main income.
• Between 2012 and 2014, poverty rates increased for: children in lone parent families (36.8 to 40.6%), those receiving Youth Allowance (50.6 to 51.8% and those receiving Parenting Payment (47.2 to 51.5%). They remained very high (61.4% to 59.9%) from 2007 to 2014 for unemployed households.
CASE STUDY: RHIMA (LONE PARENT)
Rhima has two children aged 7 and 9, and struggles to pay all the bills. Rhima’s son has frequent sinus and ear infections, which the doctor assures her will improve as he grows up. She accesses foodbank and other supports available from her local community services.
“My son has a lot of time off school due to sickness and I need to be here at home to look after him. I have been looking for work but I can’t find anything that fits around school hours and is flexible for days off to look after my boy.
“Next year they will put me on Newstart and I don’t know what I am going to do, I can’t survive on what I get now let alone anything less.
“I have no savings, my children have never been on a holiday and I have nightmares about what’s going to happen to us.”
In 2014,
2.99 million
people
(
13.3%
of the
population), were living below the poverty
line, after taking account of their housing
costs.
About this Report
The Poverty in Australia 2016 Report is the latest in the Poverty and Inequality series, a partnership between ACOSS and the Social Policy Research Centre (SPRC) at the University of New South Wales.
The first report was released in 2007 and highlighted the number of people living below the poverty line and which groups were most at risk of poverty. Poverty in Australia 2016 is the fifth report on poverty in the series and updates earlier reports. Each of the reports has focused on the measurement of poverty for the purpose of analysing
changes in poverty rates. The information provides a better understanding of the circumstances and opportunities of vulnerable and disadvantaged people in Australia.
The analysis is based on the Australian Bureau of Statistics (ABS) Survey of Income and Housing (SIH)3 and specifically data on the basic Confidentialised Unit Record File (CURF). The SIH is conducted every two years. The data presented in this report covers the latest survey (2013-14) and comparisons are made going back to 2003-04.4
Information on country of birth and specific data on Aboriginal and Torres Strait Islander peoples is not available in the latest SIH 2013-14 basic confidential unit record file (CURF) data. While it has been possible to include other relevant data on income and deprivation for Aboriginal and Torres Strait Islander peoples, this was not possible for people born overseas. Unlike previous reports, this report also does not include a breakdown of poverty rates by location.
The ABS has implemented changes over the years to some of the data measurements to improve the quality of data. Researchers at SPRC have applied various treatments to ensure the data is as consistent as possible but caution should be taken in making any comparisons across the different data set years. Caution should also be used in interpreting certain results due to the limited sample size of certain groups in the surveys. Further detail is contained in the Methodology paper that accompanies this report.5
Each of the five Poverty in Australia reports has consistently adopted the commonly used poverty line set at 50% of median household disposable income in line with the OECD measure. A second poverty line set at 60% of median household income is also included for comparison; this measure is commonly used to measure poverty in the European Union.
How poverty is defined and measured in this report
Poverty is defined to exist when a household’s income is so inadequate as to preclude them from having an acceptable standard of living. In practice, it is often identified when people are unable to afford socially perceived necessities - things that a majority in the community agrees that no-one should have to go without. It is separate, but closely related, to other measures of financial disadvantage.
In wealthy countries the internationally accepted practice for measuring poverty is to set a poverty line for a single adult living alone as a fraction of the median after-tax household income of all people. To calculate the median, the household incomes of all people are adjusted for family size using an ‘equivalence scale’, then ranked in order of adjusted income and the income of the middle-ranked person is chosen. As per this report, commonly chosen poverty line thresholds are either 50% or 60% of this median income.
Poverty lines for other types of household (such as a lone parent with two children) are then derived from this poverty line by applying the same ‘equivalence scale’ to estimate how much they need to achieve the same standard of living as the single person.
This approach means that the poverty lines rise or fall in accordance with changes in the income (including wages and any government benefits) of the median household. That is, the poverty lines aim to measure living standards relative to those enjoyed by ‘middle Australia’. This is appropriate, given that the cost of achieving an acceptable standard of living varies over time and between countries as living standards rise or fall. An example is the ability of families to afford such things as normal school outings and sporting activities for their children. Similarly, the quality of housing that we regard as ‘essential’ has changed over time – for example access to an indoor toilet.
3 Australian Bureau of Statistics (ABS) Survey of Income and Housing (SIH) ABS Catalogue No. 6541.0.30.001 (microdata user guide), and No. 6523 SIH general user guide.
4 References in this report to 2014 data are for the 2013-14 year.
In addition to comparing the incomes of different households, this report takes account of the major fixed cost of low-income households: housing. This adjustment is frequently made in poverty research (including the landmark study by Professor Henderson for the National Poverty Inquiry which reported in 1975).6 Housing costs vary considerably among owners, purchasers and tenants living in different parts of the country. For example, for a particular level of income, outright homeowners can achieve a much higher standard of living than most tenants or mortgagees because their housing costs are lower.
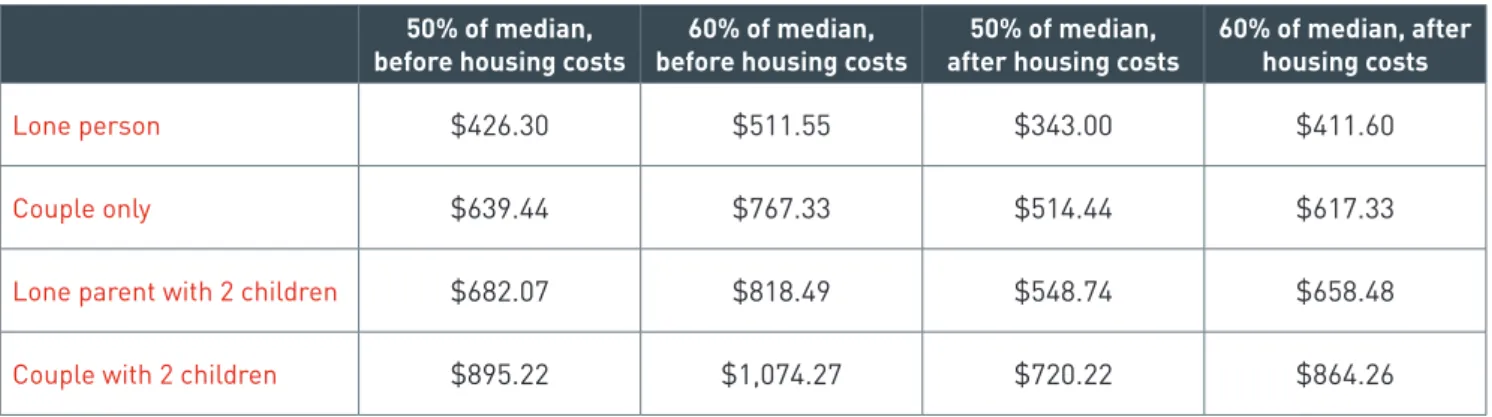
To take housing costs into account, a separate set of ‘after housing costs’ poverty lines is used. These are derived by subtracting housing costs from after-tax income before calculating the median. In 2014 the poverty line for a single adult ‘before housing costs’ was $426.30 per week. When an allowance for housing costs of $83.30 per week is subtracted, this gives us an ‘after housing costs’ poverty line of $343 per week (19.5% less) for a single adult living alone. So the after-housing cost poverty line is the amount of money remaining to buy all other essentials after paying for housing. Poverty status is then established by comparing household income after deducting housing costs with the after housing costs poverty line.
Table 1: Poverty Lines by family type, 2013-14 ($/week after tax, including social security payments, before and after housing costs)
50% of median,
before housing costs before housing costs60% of median, after housing costs50% of median, 60% of median, after housing costs
Lone person $426.30 $511.55 $343.00 $411.60
Couple only $639.44 $767.33 $514.44 $617.33
Lone parent with 2 children $682.07 $818.49 $548.74 $658.48
Couple with 2 children $895.22 $1,074.27 $720.22 $864.26
The data presented in this report are estimates of the number of individuals living in households with incomes below the relevant poverty line. As noted, estimates are presented for both the 50% and 60% of median income poverty lines. In addition, estimates have been calculated using three different methods:
1. Comparisons of total household incomes with the higher ‘before housing’ poverty lines;
2. The above approach but with households reporting zero or negative incomes and self-employed households excluded; and
3. Comparisons of household incomes minus housing costs with the lower ‘after housing’ poverty lines, with the same exclusions as above.
The third method is considered the most valid and robust, and this report is based on that approach unless otherwise noted. Further detail is contained in the Methodology paper that accompanies this report.7 Estimates of the number of people who are below the poverty line (as opposed to the poverty rate) compensate for the exclusions in methods 2 and 3 by inflating the estimates by the ratio of the total population to the non-excluded population. For the overall estimate of poverty numbers, this is equivalent to assuming that the excluded households (e.g. self-employed households, which have been previously excluded from analysis) have the same poverty rate as those not excluded. This is a change from the methods used in the previous reports in this series (though it does not affect the estimated rates of poverty) and is further detailed in the Methodology Paper. Poverty analysis is just one measure of financial hardship. Other useful measures and indicators are outlined in the Appendix.
6 Henderson, R.F. (Chairman) (1975), Poverty in Australia First Main Report April 1975, Commission of Inquiry into Poverty, AGPS, Canberra 7 See Footnote 5
Poverty lines
Poverty lines for different households are presented below in Table 2 which shows the poverty line in dollar terms for four types of household: Lone adult and Couple without children and Lone parent and Couple with 2 children. The table presents ‘before housing’ poverty lines (before the deduction of housing costs) since these are more readily understood and compared with actual household incomes, for example, those provided by the maximum rates of social security payments.
Table 2: Poverty lines by family type, 2013-14 ($ / week after tax, including social security payments)
50% of median 60% of median
Lone person $426.30 $511.55
Couple only $639.44 $767.33
Couple with 2 children $895.22 $1,074.27
Lone parent with 2 children $682.07 $818.49
Note: These are the poverty lines before housing costs are taken into account.
The rate and profile of poverty
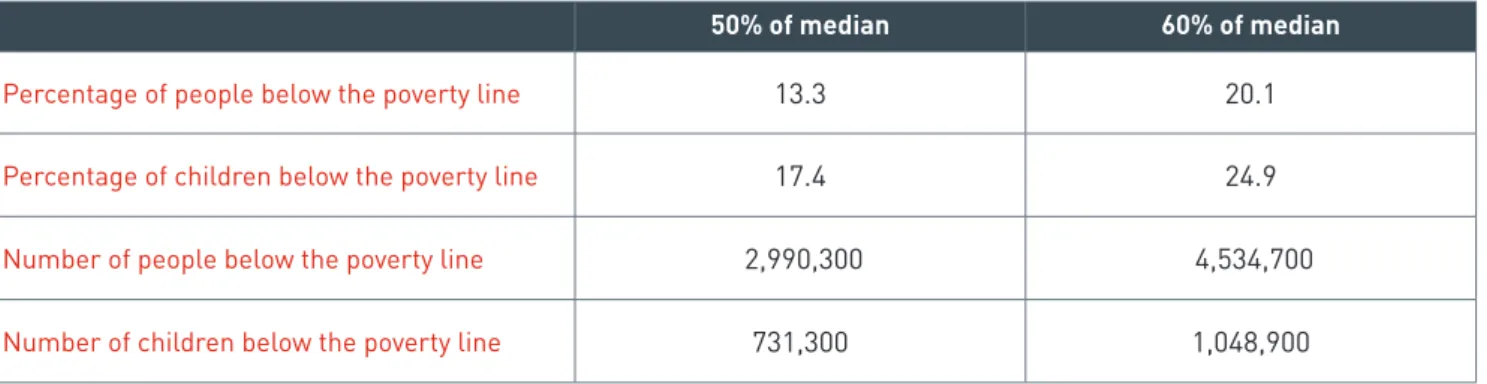
There were 2.99 million people living below the 50% of median income poverty line in 2014, or 13.3% of the population. Of these, 731,300 were children, or 17.4% of all children. This is little changed from poverty rates in 2012, which were 13.9% and 17.7% for the general and child poverty rate respectively.
Table 3: Number and proportion of people below the 50% and 60% of median poverty lines
50% of median 60% of median
Percentage of people below the poverty line 13.3 20.1
Percentage of children below the poverty line 17.4 24.9
Number of people below the poverty line 2,990,300 4,534,700
Number of children below the poverty line 731,300 1,048,900
In this section of the report, we look beyond the overall numbers at both the rate and the profile of poverty. This approach allows us to identify particular groups most affected by poverty and to form a deeper understanding of the issues facing people living below the poverty line and how they are changing.
First we show the rate of poverty faced by different groups and family types (table 4). Second we profile the population of people living below the poverty line (table 5).
Looking at poverty from these two perspectives yields different results. For example the rate of poverty is higher for lone parent families at 33.2% than for couples with children at 11.3%. There are however more couples with children than lone parents, so a higher proportion of people below the poverty line come from partnered families: 33.9% for couples with children compared with 18.6% for lone parent families when using the 50% poverty line.
Table 4 shows the rate of poverty faced by different groups and family types, highlighting the factors that contribute to a person’s risk of living below the poverty line.
Table 4: Rate of poverty - proportion of people from different groups living below poverty lines in 2013-14
By gender (2) 50% of median 60% of median
Male 12.8 19.2
Female 13.8 21.0
All people 13.3 20.1
By age (2) 50% of median 60% of median
Under 15 17.4 24.9
15 - 24 13.0 18.1
25 - 64 12.0 17.1
65+ 13.0 26.5
All people 13.3 20.1
By main income source (3) 50% of median 60% of median
Wage and salary 6.0 9.7
Social security payment 36.1 54.7
Other income 18.4 21.9
All people 13.3 20.1
By family type (3) 50% of median 60% of median
Single, no children 24.6 38.6 Lone parent 33.2 45.6 Couple, no children 10.1 17.3 Couple, children 11.3 16.5 Other 7.7 11.8 All people 13.3 20.1
Children (2) 50% of median 60% of median
Children in sole parent households 40.6 54.5
Children in couple households 12.5 18.7
Children in other households 14.7 20.9
All children 17.4 24.9
By labour force status (1) 50% of median 60% of median
Employed full-time 4.7 7.9
Employed part-time 15.5 24.1
Unemployed 63.2 73.6
Not in labour force aged 65 and over 14.4 28.8
Not in labour force aged under 65 43.9 57.1
All people 13.3 20.1
By social security payment type (2) 50% of median 60% of median
Newstart Allowance 55.0 71.3
Youth Allowance 51.8 64.4
Parenting Payment 51.5 67.7
Carer Payment 24.3 37.3
Disability Support Pension 36.2 54.6
Age Pension 13.9 30.2
Total 27.8 44.0
Note: (1) Refers to the characteristic of the reference person in the household, (2) Refers to all persons in the survey with that particular characteristic (3) Refers to households. Table 5 (below) shows the profile of people living below the two poverty lines, that is to say the percentage of people below each poverty line with particular characteristics.
Table 5 shows the profile of people living below the two poverty lines, that is to say the percentage of people below each poverty line with particular characteristics.
• By gender: 52.6% are female • By age: 47.9% are aged 25-64
• By main income source: 57.3% are on income support
The table also provides details of the total number of people in each of the groupings and characteristics.
Table 5: Profile of poverty - proportion and numbers of people from different groups living below poverty lines in 2013-14 (%) 8,9
PROFILE OF POVERTY (%) NUMBERS IN POVERTY
By gender (2) 50% of median 60% of median 50% of median 60% of median
Male 47.4 47.0 1,417,300 2,131,500
Female 52.6 53.0 1,573,000 2,403,200
All people 100.0 100.0 2,990,300 4,534,700
By age (2) 50% of median 60% of median 50% of median 60% of median
Under 15 24.5 23.1 731,300 1,048,900
15 - 24 12.5 11.5 374,900 521,500
25 - 64 47.9 45.0 1,430,900 2,042,000
65+ 15.2 20.3 453,300 922,300
All people 100.0 100.0 2,990,300 4,534,700
By main income source (3) 50% of median 60% of median 50% of median 60% of median
Wage and salary 32.1 34.4 959,800 1,560,800
Social security payments 57.3 57.3 1,714,100 2,596,400
Other income 10.6 8.3 316,400 377,500
All people 100.0 100.0 2,990,300 4,534,700
8 Note that some groups are defined by the status of the Household Reference Person
9 Note that estimates of numbers in poverty in this report adjust for the exclusion of the self-employed and people with zero or negative income and so are not comparable with the numbers in the 2014 and previous reports. Poverty rates are not affected by this change
PROFILE OF POVERTY (%) NUMBERS IN POVERTY
By family type (3) 50% of median 60% of median 50% of median 60% of median
Single, no children 19.4 20.1 580,300 909,300 Lone parent 18.6 16.8 555,600 763,900 Couple, no children 15.7 17.7 469,500 803,200 Couple, children 33.9 32.7 1,012,600 1,482,200 Other 12.5 12.7 372,300 576,000 All people 100.0 100.0 2,990,300 4,534,700
Children (2) 50% of median 60% of median 50% of median 60% of median
Children in lone parent households 39.8 37.2 291,200 390,200
Children in couple households 55.9 58.5 408,500 613,600
Children in other households 4.3 4.3 31,600 45,100
All children 100.0 100.0 731,300 1,048,900
By labour force status (1) 50% of median 60% of median 50% of median 60% of median
Employed full-time 20.8 23.2 622,700 1,051,100
Employed part-time 13.8 14.2 412,900 643,100
Unemployed 9.7 7.5 291,000 338,700
Not in labour force aged 65 and over 16.0 21.2 479,700 961,300
Not in labour force aged under 65 39.6 34.0 1,184,1006 1,540,500
All people 100.0 100.0 2,990,300 4,534,700
By social security payment type (1) 50% of median 60% of median 50% of median 60% of median
Newstart Allowance 21.5 17.6 321,300 415,900
Youth Allowance 2.3 1.8 34,300 42,700
Parenting Payment 23.3 19.3 347,200 456,300
PROFILE OF POVERTY (%) NUMBERS IN POVERTY
By social security payment type (cont) (1) 50% of median 60% of median 50% of median 60% of median
Disability Support Pension 19.1 18.1 284,500 429,000
Age Pension 25.7 35.3 383,200 835,400
Total 100.0 100.0 1,492,500 2,366,500
Note: (1) Refers to the characteristic of the reference person in the household, (2) Refers to all persons in the survey with that particular characteristic (3) Refers to households.
In the next section, we look at the trends over a 10 year period for a number of groups.
CASE STUDY: TUNG (23 - UNEMPLOYED)
Tung left school at 16 without any qualifications. At 19 his mother threw him out of home because he was not working or studying. Tung moves around a lot, as he can’t find secure housing that he can afford. “I was very lazy, got into a bit of trouble and upset my Mum a lot but I have grown up a lot and now and I really want to work but I cant get anyone to give me a go.
“I apply for hundreds of jobs and just can’t get anything, most don’t even reply, they just ignore me. I don’t have experience or qualifications so no one wants me.
“I stay with friends mostly, but I have spent some nights on the street and that’s really bad, I don’t want to live like this, I need someone to give me a chance.”
“
This report highlights the urgent need to
redouble our efforts to tackle
entrenched
poverty.
We know that for so many of our
service users the crippling
cost of rent
is
a significant proportion of their income.
Addressing the affordable and social
housing crisis is one way we can start to
break the cycle
of poverty.”
Poverty trends: 2003-4 to 2013-14
Headline trends
The section looks at the trends in poverty from a ten-year perspective. Data has been prepared for the overall population and divided into children and adults. Three population groups have also been analysed: lone parent households, unemployed people and older people aged 65 and over to allow a more considered analysis of the longer-term situation of poverty in Australia for different groups.
Longer-term trend analysis enables the variables of certain peak and trough years to be levelled out and therefore show the improvements or otherwise in the rate of poverty. There are some challenges to this approach due to data collection adjustments in measurement and definitions at various points over the ten-year period. We have approached this by adjusting figures, where necessary, to enable comparisons over time. This means that comparable figures for 2013-14 are different from the headline figures reported in the previous section.
As can be seen in figures 1 and 2 the changes in measurement and definition over the years has impacted the reportable rates. Over this period, the ABS has used three different income definitions in its surveys. The results presented in other sections of this report for 2013-14 use the most recent (and most comprehensive) definition, denoted here as the ‘2007-08 income definition’. This has only been collected since 2007-08 and so results for the earlier definitions are also presented to permit comparisons over a longer time period. The current definition of income introduced in 2007-08 includes factors such as irregular overtime and bonuses, and as such leads to a much higher median income and therefore higher poverty line.
Figure 1: Poverty trend (50% of median, after housing costs)
8 14 20 2013-14 2011-12 2009-10 2007-08 2005-06 2003-04
2005-06 income basis 2007-08 income basis
2003-04 income basis
On a comparable basis (2005-06 basis), the overall picture on a ten-year trend basis is one of a persistent and entrenched poverty rate around 12%. In 2003-04 the overall poverty rate was 11.8% rising to 12.6% in 2013-14, using
the 2005-06 basis of measurement.10 On this basis, when looking at the ten-year trend data, the overall poverty rate was similar in 2003-04 and 2013-14, however there have been some notable peaks and troughs as is evident in figures 1 and 2.
The most concerning population group over the period were children for whom the rate increased by over 2 percentage points from 14.8% in 2003-04 to 17% in 2013-14 on a comparable basis (17.4% using the updated ABS measure).
Figure 2: Child poverty trend (50% of median, after housing costs)
2005-06 income basis 2007-08 income basis
2003-04 income basis
2003-04 2005-06 2007-08 2009-10 2011-12 2013-14 8
14 20
The main reason for the increase in poverty from 2003 to 2007 is likely to be that median incomes rose strongly during that period but a growing minority of people (those below the poverty line) fell behind. For example, the real incomes of people on some income support payments fell behind because their payments were only indexed to the CPI and not to wages. Over this period, the impact of the rise in overall incomes on poverty levels was greater than the poverty reducing impact of the fall in unemployment. For more on payment indexation, see page 29.
The dip in poverty after 2007 is likely due, in part, to the economic downturn in 2008-09, which depressed median incomes without substantially increasing unemployment. The increases in pension payments for single people in 2009 combined with the one-off payments that were introduced after the Global Financial Crisis will also have had a positive impact.
LONE PARENT HOUSEHOLDS
Over the decade there has been an increase in poverty for lone parent households. On a comparable basis, poverty in lone parent households has increased from 25.7% in 2003-04 to 29.1% in 2013-14.11
Some issues that may have contributed to this pattern of lone parent household poverty include the 2006 Welfare to Work legislation and successive changes to eligibility for payments. The 2006 legislation resulted in approximately 20,000 lone parents being moved from Parenting Payment to the lower Newstart Allowance12. In 2013 all remaining lone parents whose youngest child had turned eight were also moved from the Parenting Payment to the lower Newstart Allowance. This resulted in a typical loss of income for the poorest lone parent families of $60 per week and affected 80,000 lone parents.
Figure 3: Lone parent households poverty trends (after housing costs)
0 10 20 30 40 50 2013-14 2011-12 2009-10 2007-08 2005-06 2003-04 60% median 50% median
PEOPLE WHO ARE UNEMPLOYED
Due to a change in ABS methodology, we can only measure poverty trends at the 50% of median income line for households headed by unemployed people since 2007-08. In that year, 61.4% of people who were unemployed were living below the poverty line, compared with 59.9% in 2013-14. As the graph below shows, the poverty rate for this group has remained fairly entrenched and persistent throughout the period, at around 60%. A major reason for this, discussed later, is that the maximum rate of the main unemployment payment (Newstart Allowance) has remained well below the poverty line throughout the period. Only the minority of unemployed people with other sources of income (e.g. from paid work or superannuation) escaped poverty.
Figure 4: Unemployed households poverty trends, after housing costs 0 20 40 60 80 100 2013-14 2011-12 2009-10 2007-08 2005-06 2003-04 60% median 50% median OVER 65’S
For those over 65 years of age the ten-year trend has shown an improvement in the incidence of poverty. Like the other population trends there was an increase in poverty rates from 2003-04 to 2007-08 and a decline thereafter. The pension increase in 2009 (discussed later in this report) has had a marked impact on the situation for older Australians since then. On a comparable basis, the peak of 19.4% in after housing rates of poverty at the 50% poverty line has fallen to 11.3% in 14. Over the decade, the rate has reduced from 12.1% in 2003-04 to 11.3% in 2013-14. This would indicate that, as with other population groups, there is an entrenched level of poverty over the decade. A comparison between the trends in ‘before’ and ‘after’ housing poverty indicates that housing costs are a major obstacle preventing a fall in poverty for people over 6513.
There has also been a significant decline in the rate of older people living between the 50% and 60% poverty lines, demonstrating that fewer older people are living only marginally above the 50% poverty line.
Figure 5: People aged 65+ poverty trends (after housing costs) 0 10 20 30 40 50 2013-14 2011-12 2009-10 2007-08 2005-06 2003-04 60% median 50% median
Figure 6: People aged 65+ poverty trends (before housing costs)
0 10 20 30 40 50 2013-14 2011-12 2009-10 2007-08 2005-06 2003-04 60% median 50% median
Poverty levels in 2013-14
This section of the report examines the circumstances of different groups in 2013-14 in more depth.
Family Type
Over the decade, lone parents have had a consistently higher prevalence of poverty compared to all other family types, with a third of lone parent families living below the poverty line in 2013-14 (33.2% below the 50% poverty line and 45.6% below the 60% poverty line) as can be seen from the Child Poverty section below.
Single people with and without children generally experience a higher rate of poverty than couples. The poverty rates in 2013-14 were 33.2% with children and 24.6% without children for singles compared to couples at 11.3% and 10.1% respectively. This is because single adult households have only a single income (generally lower in the case of those with caring responsibilities), but still have the fixed costs of running a household, with or without children.
As noted above, couple households make up a larger proportion of households in poverty than lone parent or single person households (50.4% and 36.9% respectively), due to a higher number of couple than single households. Figure 7: Rate of poverty by family type
0 10 20 30 40 50 All people Single, no children Lone parent Couple, no children Couple, children 60% of median 50% of median 11.3% 10.1% 33.2% 24.6% 13.3% 16.5% 17.3% 45.6% 38.6% 20.1%
Child poverty
In 2013-14, 17.4% of all children were living in households experiencing poverty, with the corresponding figures being 40.6% for children in lone parent households and 12.5% for children in couple households when using the 50% poverty rate. There has been an increase in both the rate and profile of poverty for children in lone parent families since 2011-12.
• 50% poverty line: 36.8% to 40.6% • 60% poverty line: 50.4% to 54.5%
Children in lone parent households are more than three times likely to be living in poverty (40.6%) than children in couple households (12.5%).
As we have seen in the ten-year trend data presented earlier in this report, lone parents have experienced an increase in their rates of poverty from 25.7% in 2003-04 to 29.1% in 2013-1414.
Lone parents experience a higher risk of poverty due in part to lower levels of employment. The responsibilities of being the lone parent of a child can severely restrict choices and options for lone parents. This, combined with the level of Parenting Payment for a single parent with young children or Newstart for those with older children, make life difficult for this family group. The social security system does not take proper account of the extra costs of raising a child alone. For example, the rates of payment for sole parents were not increased along with single pension payments in 2009.
The high rate of poverty experienced by children in lone parent households is a result of high rates of poverty among lone parent households overall. We have already shown that 33.2% of all lone parent households are living below the poverty line. This shows that the risk of a child living in poverty rises if their parents separate.
Figure 8: Rate of child poverty
0 10 20 30 40 50 60
All children Children in other households Children in couple households Children in sole parent households
60% of median 50% of median 40.6% 12.5% 14.7% 17.4% 54.5% 18.7% 20.9% 24.9%
“More than 730,000 children
live in poverty
(one child in six). In single-parent families,
four children in ten now live in poverty.
After 25 years of
uninterrupted
economic
growth, we can
do better
than this!”
Figure 9: Profile of child poverty, 50% median Children in lone parent households 39.8% Children in couple households 55.9% Children in other households 4.3%
Figure 10: Profile of child poverty, 60% median
Private renter 39.5% Children in other households 4.3% Children in lone parent households 37.2% Children in couple households 58.5%
Labour Force Status
This section of the report provides an analysis of poverty amongst demographic groups to assess the impact of labour market experiences and income types on the rate and profile of poverty. The following tables show, not surprisingly that those most likely to experience situations of poverty are those who are unemployed and rely on income support payments, most particularly those on Newstart Allowance and Youth Allowance.
In 2013-14, 63.2% of households, where the reference person was unemployed, were living below the poverty line. This contrasts with a lower incidence of poverty for those who work full time (4.7%). For part time workers the rate is 15.5% which is higher than the overall poverty rate of 13.3% but significantly below the rate for those who were unemployed. Being unemployed is the strongest overall predictor of poverty, with higher rates of poverty amongst this group than any other group. The high rate of poverty among unemployed people partly reflects the level of the Newstart Allowance, which in December 2013 – the mid point of the SIH survey – was $316.75 per week for a single person with no children (including rent assistance). When comparing this payment level with the 50% of median income poverty line we can see that it is $109.55 per week less. In December 2013 the minimum wage was $622.20 for a person employed full time, which is nearly double the level of Newstart Allowance.
CASE STUDY: PATRICIA (72)
Patricia worked all her life with breaks from paid work when she had children. The combined impacts of working part time, divorce and time off for child rearing have resulted in a very low level of superannuation which, after 12 years in retirement has already run out, and she is now fully dependent on the age pension. “I do OK, but I can’t do a lot of the things I used to do as I can’t afford them. There are no treats. I loved going to the pictures when I was younger but I can’t afford that anymore.
“My two big worries are health and my home. My health is holding up but I live in a private rental and I worry that the owners will decide to sell and I will have to move, I am too old to move.”
Figure 11: Rate of poverty by labour force status
0 10 20 30 40 50 60 70 80
All people Not in labour force (post retirement age, 65+) Not in labour force (working age, <65) Unemployed Employed part time Employed full time
60% of median 50% of median 4.7% 15.5% 63.2% 43.9% 14.4% 7.9% 24.1% 73.6% 57.1% 28.8% 13.3% 20.1%
People outside the labour force, often due to disability or caring roles, are another key group with high rates of poverty. This group are usually reliant upon the Disability Support Pension, Parenting Payment or Carer payments. This group are more likely to be in rental housing and less likely to own their own home, meaning that their housing costs have a significant impact on their circumstance and likelihood of experiencing poverty.
Among older people not in the labour force (those over the age of 65), the rate of poverty is higher than the overall rate at 14.4%. This is above the rate for those employed, but considerably below the rate for unemployed people. This reflects the higher rate of the Age Pension compared to Newstart Allowance, the increasing number of people retiring with at least some superannuation, and the lower housing costs of those who own their homes outright, which includes many older people.
The ‘profile’ of poverty charts show a different picture. Although workers in paid employment have a lower rate of poverty, they form one third (34.6%) of all people below the 50% poverty line (37.4% when using the 60% rate), due to the much higher number of people in paid employment overall. Since the minimum fulltime wage is above the 50% poverty line for a single adult, it is likely that most employed workers without children living below that poverty line are either employed part time or in casual or intermittent employment.
Figure 12: Profile of poverty by labour force status, 50% median Employed full time 20.8% Not in labour force (post retirement age, 65+) 16.0%
Not in labour force (working age, <65) 39.6% Unemployed 9.7% Employed part time 13.8%
Figure 13: Profile of poverty by labour force status, 60% median
Private renter 39.5% Not in labour force
(working age, <65) 34% Not in labour force
(post retirement age, 65+) 21.0% Unemployed 7.5% Employed part time 14.2% Employed full time 23.2%
Main Income Source
People receiving income support payments are six times more likely to experience poverty (36.1%) compared with salary and wage earners (6%). This is predominantly because many income support payments are set below the poverty line, resulting in a situation where any household with no additional income lives below the poverty line. Figure 14: Rate of poverty by main income source
0 10 20 30 40 50 60
All people Other income Social Security
Wage and salary 6%
36.1% 18.4% 13.3% 9.7% 54.7% 21.96% 20.1% 60% of median 50% of median
Figure 15: Profile of poverty by main income source, 50% median
Wages and salary 32.1% Social security 57.3% Other income 10.6%
Figure 16: Profile of poverty by main income source, 60% median
Private renter 39.5%
Wages and salary 34.4% Social security 57.3% Other income 8.3%
Poverty among people receiving Income Support Payments
One way to explain the high levels of poverty among those on social security payments is to look at the maximum rate of payment compared with poverty lines. Table 6 compares the standard maximum rates15 of major social security payments with poverty lines for the relevant family types and shows how far above or below the poverty line income falls for people relying fully on these payments (assuming no other source of income).
There is a large gap between the Newstart Allowance and Youth Allowance and the poverty line (of $109.55 or 25.7% and $158.63 or 18.9% respectively). As a result, people receiving these payments experience high poverty rates and those below the poverty line experience ‘deep’ poverty16.
Almost half of people in households receiving Parenting Payment (most of whom are lone parents) are below the poverty line. This group is more likely than the average household to rent their housing, and around one in three has earnings from employment. Along with Newstart recipients, people on Parenting Payment did not receive the September 2009 pension increase, so their maximum rate of payment is significantly lower than other pensions. Lone parents ineligible for the Parenting Payment (once the youngest child turns 8) rely on the lower Newstart rate, leaving a $71.47 gap between the Newstart Allowance and the poverty line for a single parent family with two children. In 2009, most single pension rates were increased by $32 per week (above inflation), placing it closer to the 50% poverty line.
Social security payments for couples were generally below the 50% line, though closer to it in proportional terms. The Newstart Allowance for a couple without children was $121.14 (or 18.9%) per week below the 50% poverty line, and $100.26 (or 11.2%) below that poverty line for those with 2 children. The pension rate for a couple without children was $16.04 below the 50% poverty line
Table 6:. Comparison of poverty lines for family types with selected social security payments by family type ($ per week) - before housing costs
Maximum rate of payment (December 2013) Poverty line 50% median income Poverty line 60% median income Gap (50% of median income) Gap (60% of median income) NEWSTART ALLOWANCE Single, no children $316.75 $426.30 $511.55 $109.55 $194.80 Single, 2 children $610.60 $682.07 $818.49 $71.47 $207.89 Couple, no children $518.30 $639.44 $767.33 $121.14 $249.03 Couple, 2 children $794.96 $895.22 $1,074.27 $100.26 $279.31 YOUTH ALLOWANCE Single, no children $267.67 $426.30 $511.55 $158.63 $243.88
PARENTING PAYMENT SINGLE
Single, 2 children $690.76 $682.07 $818.49 ($8.69) $127.73
PENSION PAYMENT
Single, no children $413.55 $426.30 $511.55 $12.75 $98.00
Couple, no children $623.40 $639.44 $767.33 $16.04 $143.93
NOTES: All cameos include the Energy Supplement and the maximum rate of Rent Assistance (except for pension households), and relevant supplements, including Family Tax Benefit where there are children. Poverty lines are before housing costs are deducted.
Figure 17 Difference betwen pension and allowance payments, December 2013
Youth Allowance Newstart Lone parent (Newstart) Lone parent (parenting payment) Pension $413.45 $355.80 $275.70 $254.75 $209.60 $57.65 $137.75 $158.70 $203.85
Gap between payment amount and 50% median income Payment amount
NOTES: All payment rates include Energy Supplement. Pension and Parenting Payments include Pension Supplement. Youth Allowance for single person aged over 18 living away from home. Newstart and Pension for single person without children. No Rental Assistance has been included
COMPARISON OF PAYMENT RATES AND POVERTY LINES
Table 7 below shows the ‘poverty gaps’ reported in the ABS survey for the recipients of major payments. Unlike Table 6, these estimates take into account the actual amount of social security and other income (as opposed to maximum payment rates) that people reported receiving, as well as their housing costs, hence the larger poverty gaps. The ‘poverty gap’ is the average gap between the after-housing income of households that live below the poverty line and the poverty line. A large poverty gap indicates that most of those who are in poverty are likely to be living a long way below the poverty line.
People in households receiving certain payments may be living below the poverty line, but only a small distance below it; while for other payments, a majority live much further below it. The table shows that average poverty gaps are greatest for recipients of Youth Allowance ($309 a week), Newstart Allowance ($222), Parenting Payment Single ($223) and Carer payment ($214) than for the other pension payments.
Table 7: Average gap between the total income of those below the poverty line and the relevant poverty line, 2013-14 (dollars per week) - after housing costs
50% median income
poverty line 60% median income poverty line
Newstart Allowance $222 $276
Youth Allowance $309 $359
Parenting Payment single $223 $291
Carer Payment $214 $264
Disability Support Pension $126 $177
Age pension $118 $119
PAYMENT INDEXATION
This report finds that 57.3% of all people who live in households below the 50% poverty line received social security payments as their main source of income. As noted in the previous section, a major cause of this is that many social security payments fall below the poverty line. This is due to the low rate of social security payments, but also to indexation arrangements for all payments other than pensions. Notably, allowances and family payments are now only indexed to price inflation, not wages.
The Newstart Allowance has not increased in real terms (above the Consumer Price Index - CPI) since 1994. This means that people who are unemployed have not shared in increases in living standards received by the rest of the community for more than 20 years. There were two exceptions: the introduction of the (soon to be abolished) Income Support Bonus in 2011 and the Energy Supplement from March 2013.17
Since poverty is generally measured relative to community living standards, including in this study, the indexation of payments to CPI only is likely to result in higher poverty levels over time than would otherwise be the case (in recent decades average wages rose by around 2% more than the CPI each year).
The figure below compares the single maximum rate of Newstart Allowance and the Pension payment with wages (average weekly ordinary time earnings, or AWOTE). The figure shows that the gap between the Newstart Allowance 17 The Energy Supplement was introduced to compensate for the introduction of a price on carbon. CPI indexation of social security payments was adjusted
on 20 March 2013 to prevent people from being compensated twice; the regular CPI indexation was reduced by the amount the carbon price was expected to increase CPI (0.7%), and payment recipients were then compensated through the Energy Supplement (0.7% + 1%). As a result of recent legislative change, the
and Pension payment (as well as average wages) has increased over time, as the Pension was indexed to wages allowing it to rise with community living standards, while the Newstart Allowance was indexed to CPI only. Figure 18: Trends in payment rates compared with average wages
0 $300 $600 $900 $1200 $1500 Age Pension
Newstart Allowance AWOTE
2003 2004 2005 2006 2007 2008 2009 2010 2011 2012 2013 $192.50 $231.00 $921.20 $1438.00 $414.00 $250.50
Until 2009, family payments were indexed to wage movements but they have been indexed only to CPI since that time. This is resulting in the gradual erosion of the adequacy of the payments and is likely to contribute to increasing child poverty rates over time.
Housing Tenure
Housing is the largest fixed cost of most family budgets, meaning that those with lower housing costs, such as people who own their homes outright, are able to achieve a higher standard of living than those on the same income but with higher housing costs. Therefore housing tenure is a key factor in assessing the experience of poverty. This is the first of the poverty report series where we present housing tenure data for people living below the poverty line.
While a minority of all people were living in rental housing nationally, (31%) in 2013-1418, the majority of people living below the poverty line were renters (59.7%), including 44.2% in private rental and 11.4% renting publicly. While public tenants are a smaller group than private tenants, their high risk of poverty (48.4%), compared with 21.9% for pivate renters, indicates that they are deeply financially disadvantaged.
On the other hand just 15.5% of people living below the poverty line were homeowners, of which 7.9% had a mortgage against their property and 7.6% owned their home outright. This compares with the broader population where 67% were homeowners, comprising of 36% with a mortgage and 31% who owned their home without a mortgage19. Home ownership provides significant protection against poverty particularly for many older people who are likely to 18 Australian Bureau of Statistics, Housing Occupancy and Costs, 2013-14 Cat No 4130.0 http://www.abs.gov.au/ausstats/[email protected]/mf/4130.0
have lower housing costs and can therefore use their income for other non-housing living costs. Conversely for those who are in a rental situation in retirement, housing cost can be a significant component of living costs.
Figure 19: Rate of poverty by housing tenure
0 10 20 30 40 50 60 70 80
All people Other tenure type Other renter Public renter Private renter Owner with a mortgage
Owner without a mortgage 7.6% 15.9%
7.9% 12.1% 21.96% 29.7% 48.4% 67.8% 31.3% 42.8% 12.3% 16.2% 13.3% 20.1% 60% of median 50% of median
Figure 20: Profile of poverty by housing tenure, 50% median
Other tenure type 1.3% Other renter 4.1% Public renter 11.4% Private renter 44.2%
Owner with a mortgage 24.2% Owner without
a mortgage 14.9%
Figure 21: Profile of poverty by housing tenure, 60% median
Other tenure type 1.1% Other renter 3.7% Owner without a mortgage 20.7%
Owner with a mortgage 24.4% Private renter
39.5% Public renter
Gender
As with previous reports women continue to be more likely to live below the poverty line regardless of which poverty line is used. This outcome is due to women tending to have lower employment rates and lower wages than men and a greater caring role both for children and for other family members.
The data for 2014 in figure 22 shows the rate of poverty for women is at 13.8%, which is higher than the headline rate of 13.3% and higher than the rate for men of 12.8%.
Figure 22: Rate of poverty by gender
0 5 10 15 20 25 60% of median 50% of median Total Female Male 13.8% 13.3% 19.2% 21% 20.1% 12.8%
Figure 23: Profile of poverty by gender, 50% median
Male
47.4% Female
52.6%
Figure 24: Profile of poverty by gender, 60% median e
Male 47.0%
Female 53.0%
Age
The rate of poverty is highest for those under 15 and over 65 but the profile shows greater numbers of people in the 25-65 category are experiencing poverty, due to the overall larger numbers of people in this category.
When we compare the various age groups, households with children show much higher rates of living below the poverty line than other groups. In 2013-14, 17.4% of children were living in households below the 50% poverty line and 20.9% were below the 60% poverty line. This in part reflects the higher housing costs associated in households with children and the impact of caring responsibilities on employment participation.
People over 65 are less likely to experience poverty when compared to children but are more likely to experience poverty than the rest of the population. There was a significant difference between the 50% and 60% poverty lines of 13% and 26.5% respectively. This indicates that a large number of older people have a small amount of income in addition to their age pension payments, placing them marginally above the 50% poverty line (though their number has fallen in recent years as discussed previously).
As discussed in the section dealing with poverty trends, the pension increase in 2009 lifted the single rate of pension by $32.50 per week, representing an historic increase that greatly assisted those with no other source of income to cover the cost of living. This increase can be seen in the data to have improved the situation for this group over time. The increase highlights the core role of Government in preventing poverty by ensuring the adequacy of income support payments.
Figure 25: Rate of poverty by age
0 5 10 15 20 25 30 Under 15 15-24 25-64 65+ All people 17.4% 13% 12% 13% 13.3% 25.9% 18.1% 17.1% 26.5% 20.1% 60% of median 50% of median
Figure 26: Profile of poverty by age, 50% median Under 15 24.5% 15-24 12.5% 25-64 47.9% 65+ 15.2%
Figure 27: Profile of poverty by age, 60% median
Under 15 23.1% 15-24 25-64 45% 65+ 20.3%
People with a disability
In 2013-14, 510,900 adults with a disability (or 15.8%) and a further 328,100 with a disability that included a core activity limitation (or 17.8%) were living below the poverty line. The definition for core activity limitation is a person who has a disability or long-term health condition and also has a profound, severe or moderate limitation with core activities, which are defined as communication, mobility or self-care20.
CASE STUDY: ROB (DSP)
Rob has experienced a lot of trauma, abuse and discrimination in his life and lives with both mental and physical ill health.
“I am looking to the future, I will not allow the past to destroy me.
“Living on the Disability Support Pension can be a bit tough, I can’t go on outings or visit friends if they are too far away, I only go to the shops and appointments. I am very frugal, I spend the winter in one room wrapped in blankets to save on heating, I get all my clothes and household goods from the op-shop and I never buy meat.
‘I have spent ten months trying to get a work support package, I have skills but need assistance to get a job and it’s just not there. I deliver leaflets to make some money, that works out to about five dollars per hour.”
20 Note that these poverty rates and numbers are for all persons with a disablity as defined above. These are compared to the adult poverty rates and numbers as there is no information on children and disability.
Figure 28: Rate of poverty for people with a disability (core activity limitation) Private renter 39.5% 0 5 10 15 20 25 30 35 All adults No disability or long-term health condition Have a disability without core activity limitation Have a disability with core activity limitation
17.8% 15.8% 10.7% 12.3% 31.6% 26.1% 15.6% 19.0% 60% of median 50% of median
This research does not take account of the extra costs of a disability when assessing whether people are living below the poverty line. The costs incurred by those with a disability can include adjustments to the home or workplace, costs of care, additional transportation costs such as taxis and medical and pharmaceutical costs.
The higher than average risk of poverty for people with a disability is likely to be due, in part, to their weaker employment outcomes. Many people with disabilities have difficulty finding employment and must therefore rely on income support payments, especially the Disability Support Pension and Newstart Allowance as their main income source.
Since the introduction of Welfare to Work policies in 2006, an increasing number of people assessed as having a ‘partial work capacity’ (at least 15 hours or more per week) have been placed on the lower Newstart Allowance rather than the Disability Support Pension. The ‘partial work capacity’ definition is those unable to work or be retrained for work for 15 hours or more per week at or above the relevant minimum wage within the next two years because of impairment.
In December 2013 the difference between these two payment types, Disability Support Pension and Newstart Allowance was $158.70 (including energy and pension supplement). When taking into account the additional costs associated with disability as mentioned above, a drop of this magnitude has a significant impact on quality of life.