Using Visualization to Debug Visualization Software
Robert S Laramee
∗Visual and Interactive Computing Group Computer Science Department
Swansea University Swansea, UK
ABSTRACT
Developing visualization applications is non-trivial and poses special challenges. This is due to the fact that typi-cal visualization software processes a large amount of data resulting in large and sometimes very complex data struc-tures. Traditional tools for debugging are of limited use be-cause they de-couple the information they report from the spatio-temporal domain in which unexpected problems oc-cur. We present a set of guidelines targeted specifically at de-bugging visualization software. The guidelines are inspired by experience in developing applications in both industry and research. Specific examples where the guidelines are ap-plied are given throughout. In general, the key is to exploit the strengths of computer graphics and visualization itself in combination with some more well–known good practices.
Index Terms: I.3.6 [Computing Methodologies]: Com-puter Graphics—Methodology and Techniques I.3.8 [Com-puting Methodologies]: Computer Graphics—Applications
1 INTRODUCTION
An experienced software engineer knows that developing visualization software can be very difficult. One of the first challenges lies simply in the understanding of the algo-rithm(s) itself. The implementation of visualization software poses special challenges due to both algorithm complexity and the large size of the data sets processed. Oftentimes, a bug(s) will arise during the development of a visualization algorithm. Finding and resolving an error in visualization software can be especially difficult if the bug only appears when large data sets are investigated or a large number of iterations are involved in the computation.
Since visualization software usually involves a very large number of loops, e.g., thousands, millions, or billions of computations for gigabyte size data sets, then traditional methods for finding bugs become much less useful. For ex-ample, attempting to print out (and read) the state of mil-lions of visualization primitives is not feasible. More ad-vanced IDEs (Integrated Development Environment) offer better support for debugging, such as setting break points and reporting the state of user-specified variables at run time. But again, these tools might not be very useful when of
∗e-mail: [email protected]
the order of processing iterations involved is in the thou-sands, millions, or more. Programmers would like to see precisely where and when in the space-time domain errors occur–features that IDEs cannot offer.
We offer a set of general guidelines for resolving errors during the development of visualization algorithms and soft-ware. The guidelines are based on experience gained during several years of implementing scientific (volume and flow) visualization software as well as helping others resolve their bugs. In general, the key to resolving bugs in visualization software is to use the computer graphics and visualization itself. In other words, the very value of visualization [22], namely, the ability to summarize and convey large amounts of information to the viewer quickly, is exploited to find and fix problems that arise during the implementation of visu-alization techniques. This is coupled with traditional good development practices.
2 RELATEDWORK
To our knowledge, no general guidelines exist for debugging visualization software.
Wong et al. [25] present an interesting tool that uses vi-sualization in order to debug mobile object-based distributed programs. Laffra and Ashok describe a generic visual ap-proach to debugging C++ programs which incorporates the use of bar charts [6]. Guidelines on debugging vertex and fragment shaders are given by Rost [20] (Chapter 8.3 of the “Orange Book”).
Crossno and Angel [1] describe some debugging tools in-corporated in their particle visualization system. Although there are previous papers on the topic of algorithm visual-ization and animation itself, this is the only previous work we found directly on the subject of debugging visualization. Crossno and Angel describe how they map different proper-ties of dynamic particles to color. However, their description is system specific and they do not provide general guidelines. What they describe is covered here by Guideline 3.3: Clas-sify and Color-map.
This manuscript, together with three others: (1) How to Write a Visualization Research Paper [10, 11] (1) How to Read a Visualization Research Paper [12] and (2) Bob’s Con-cise Coding Conventions [8] form what we call,Bob’s PhD in Visualization Starter Kit. They are intended to be useful tools targeted at Phd students in visualization and the visual-ization scientist in general.
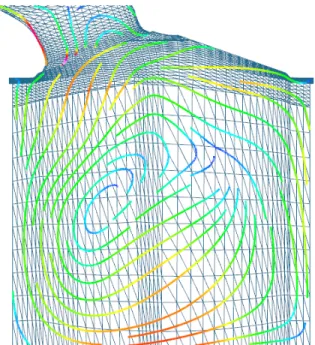
Figure 1: An example from Guideline 3.1 Visualize Test and Comparisons: Streamlines traced on an unstructured, adaptive resolution grid. Color is mapped to velocity magnitude [19].Image courtesy of Zhenmin Peng.
3 DEBUGGING VISUALIZATION SOFTWARE GUIDE -LINES
Here we offer our general guidelines on searching, finding, and resolving errors during the development of visualization software.
3.1 Visualize Tests and Comparisons
The vast majority of visualization algorithms involve tests and comparisons between two or more visualization prim-itives. By visualization primitives, we mean the basic ele-ments to which data is mapped, e.g., points, lines, polygons, voxels, texels, tetrahedra, etc. A general technique for find-ing errors in visualization software is to visualize a test or a comparison made between two or more primitive objects at run time. This often involves highlighting a given object,oa
(the current primitive) in one color whilst highlighting an-other object,obagainst whichoais compared (in an iterative
process). This strategy informs the developer of two things: (1) ifoaandobare, in fact, the expected primitives to test
and compare and (2) if the test yields the correct result. For example, we implemented a streamline tracing algo-rithm on boundary meshes from CFD [3, 9] (as in Figure 1). This type of algorithm poses challenges because the meshes are unstructured and adaptive resolution. Streamline trac-ing involves three basic computations: (1) point location, (2) interpolation, and (3) integration, evaluated for each point along the curve. The more difficult step is point location be-cause the meshes are unstructured and streamlines can inter-sect vertices in the mesh. During point location, it is useful to track where a streamline exits one polygon and enters the next. This involves a line segment intersection test.
The bug we encountered was that some of the streamlines
terminated too early, at what appeared to be random times. So we implemented a debugging feature that highlighted both (1) the newly computed (current) streamline segment, sa, and (2) the triangle segment, sb against which sa was
tested for intersection. An efficient line segment intersec-tion test will first test if the line segments are parallel to one another (in which case they do not intersect) [18]. As soon as we added our highlighting feature it became clear that our test for parallelism was not stringent enough. In other words, whensaandsbwere very close to parallel but not quite, some
streamlines terminated too early (since no intersection was found).
3.2 Visualize Data Structure Traversal and Evolu-tion
Almost all visualization techniques use at least one data structure in their implementation. One guideline we recom-mend when debugging visualization software is to visualize both the (1) traversal of and (2) evolution of the data struc-ture as it evolves over time, in other words, as it’s being built. Visualization of traversal should also include identifying and showing neighbors, either implicit or explicit.
Figure 2: An example of Guideline 3.2 Visualizing data structure traversal and evolution: The current cluster (middle of image) is highlighted bright green while current neighbors are highlighted in a shade of red. Previously processed clusters are also shown.Image courtesy of Zhenmin Peng.
For example, we implemented a vector field clustering al-gorithm which builds a binary-tree hierarchy from the bot-tom up. Each leaf of the tree represents a cluster, which at the finest resolution maps to a single pixel in image space. In order to debug the algorithm, we added a feature that visu-alizes the clustering algorithm as it evolves at run time. The visualization highlights: (1) the current cluster, ca (2) the
northern, southern, east, and west neighbors ofca, (3) the
neighbor chosen to merge withcaand (4) the previous
clus-ters formed. A snapshot is shown in Figure 2. This is very informative in terms of verifying that the algorithm behaves as expected, e.g., the data structure is traversed in the correct order, neighbors are located and compared properly, and new clusters form as expected.
Another example in Figure 3 visualizes the quadtree used to store adaptive resolution data from a height field together with a coastal land map.
Figure 3: Another example of Guideline 3.2 Visualizing data structure traversal and evolution: This image shows the quadtree and coastline used to store adaptive resolution height map data.Image courtesy of Edward Grundy.
3.3 Classify and Color Map
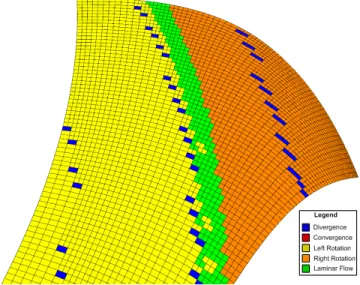
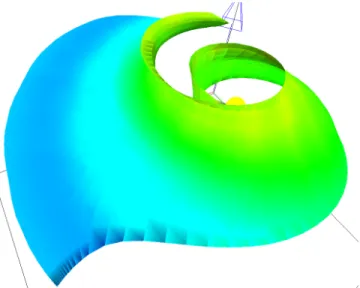
Classify and color map the visualization primitives in your visualization. Data objects fall into different categories and have different values and attributes. Their characteristics can be color mapped and provide useful debugging information. For example, we used this strategy while implementing an integral surface construction algorithm [14] (Figure 4). The surfaces are composed of dynamic quad meshes. During surface construction, quads can split due to divergent flow, merge in convergent flow, and warp in shear flow. Thus one option we implemented was to color code the quads accord-ing to divergence, convergence, and shear. This proved not only to be a useful debugging tool, but also a nice visualiza-tion of surface characteristics.
Another example, given in detail by Crossno and An-gel [1], describes debugging strategies for a particle visu-alization system. Their debugging options include mapping particle color to: (1) energy level, (2) type, (3) amount of repulsion, (4) number of neighboring links, and (5) age.
Figure 4: An example of Guideline 3.3 Classify and Color Map: Each quad in the stream surface mesh is classified and color-mapped to reflect the charac-teristics of the flow field. This helps us to visualize the behavior of the individual mesh elements.Image courtesy of Tony McLoughlin.
3.4 Incorporate Algorithm Parameters into User
Interface
Any new algorithm inevitably introduces new parameters, e.g., threshold values, alpha values, special distances, mini-mum and maximini-mum values, etc. Identifying, discussing, and visualizing these new parameters is an effective debugging strategy. Not only that, illustrating the effect of setting these parameters to a range of different values is instructive and helps the reader gain an understanding of the algorithm or method being presented. During any implementation, the best value of any new parameter is generally unknown. Thus it is best to implement them as user options since their value may change depending on the data set being evaluated. After a thorough testing phase, the new parameter may be given an optimal default value.
Jobard et al. [5] introduce two new algorithm parame-ters: (1) dsep–the separating distance between streamlines
and (2)dtest–the distance that determines when a streamline
is terminated. They’re both presented as user options. The effects of each are illustrated.
See Jobard et al. [5, 4], and Van Wijk [23], for further good example discussions of new algorithm parameters and their effects.
3.5 Run Simple Error Checks
Don’t forget to run simple, sanity checks on your visualiza-tion primitives and data structures. A simple, generic error checking procedure, e.g.,checkState(), can run through your data objects and check for very basic properties, e.g., point locations, edge lengths, minimum, average, and maxi-mum data values, and boundary conditions–testing to see if all of an object’s attributes are within reasonable, expected bounds. A general error checking function can then be in-voked at any time through the visualization pipeline in an effort to catch updates that cause unexpected changes.
For example, while working on an isosurfacing algo-rithm for adaptive resolution data [13] we encountered a bug that caused cracks in the surfaces. The algorithm uses an adaptive resolution space-partitioning octree where internal nodes store the minimum and maximum data values of their children. The difficult aspect of this error was that it only oc-curred at data resolutions of 1283or greater (and not at 643or smaller). To track down the error, we implemented a simple, generic, error-checking procedure that examined: (1) loca-tions of triangle vertices–testing to see if they fell outside of their associated cube and (2) the maximum and minimum data values of each node in the octree to ensure that all child values fell within this range. Values were re-computed and compared to stored values. This function traversed the en-tire octree and could be called at any time. By invoking the function at every stage of our visualization algorithm, we were able to quickly track down the procedures in our code that were causing surface discontinuities.
Figure 5: An example from Guideline 3.5 Run Simple Error Checks: A shad-ing bug appears around the edges of this surface. In this case, the bug was caused by reversing the calls toglNormal()andglVertex(). Rendering the surface normals makes this bug apparent immediately.Image courtesy of Matthew Edmunds.
Another common example involves surface shading. We have witnessed many programmers run into simple bugs in-volving shading of polygons, e.g., Figure 5. A standard user-option for fixing shading bugs is to render the normal vec-tors of each polygon or surface vertex as a small glyph. The glyphs depict the orientation of each normal vector at the surface. We regularly resolve bugs with this approach.
3.6 Introduce a Step Function
Most visualization algorithms involve computation that iter-ates several times, perhaps over each data item, and again over each pass through the data or data structure. Incorpo-rate a feature in the user-interface that lets you interrupt (or pause) the execution in between each iteration of algorithm processing. This lets the user pause the current scene and look at it in more detail. Pressing the pause button again then executes exactly one loop of the algorithm. With this feature, the user may then step through program execution at run time, one iteration (or loop) at a time.
For example, while developing a streaksurface algorithm we introduced a step function that can stop program execu-tion after each time-step. When the user hits the space bar, the next time step of the simulation data is visualized and the processing stops again. This lets us examine the properties of the surface after each pass through the mesh data struc-ture used to represent it. This helped us to quickly identify operations on the mesh that reduced its quality.
3.7 Make Use of Still Image–Driven Animation
Some types of bugs occur infrequently, for example, only after several time-steps of data have been processed and vi-sualized. You may be watching an animation of your visual-ization in action, for example, as a data structure is traversed (as in Guideline 3.2) and notice a bug(s) only after several
seconds (or even minutes) of observation. The point in time at which the error is recognized may arrive too late in or-der to slow down or interrupt the algorithm, say, by invoking the step function described in Guideline 3.6. Stopping the process and starting all over is painful and time-consuming.
In this case, it is very useful to use a feature that saves still images of the visualization each time the frame buffer is updated. We recommend adding a user option to your software or system that automatically: (1) re-sizes the viewer to 5122 pixels (Old MPEG players can only han-dle movie resolutions which are a power of two.) and (2) saves each frame as a still image in JPEG (or PNG) format. The still images are used as input to an appli-cation which can play them back. We use Adobe Pre-miere (http://www.adobe.com/products/premiere/) because of its rich set of features. Adobe Premiere is ex-pensive so there are free, alternatives such as Video-Mach (http://www.gromada.com/videomach.html). How-ever VideoMach is not so feature-rich. Most built-in file browsers of modern operating systems also support scrolling through still images.
The still images can then be re-played, paused, re-wound, as needed in order to study when and under which cir-cumstances the bug occurred. Uninteresting frames can be skipped or deleted. Saving and replaying still images can save a tremendous amount of time and be very valuable for tracking down infrequent bugs or studying the behavior of an algorithm. The images can be supplemented with use-ful meta-data such as time step etc. that aid in locating and reproducing the error. This approach is also very good for showing the error to others.
We consider this a standard feature for visualization ap-plications. It is also used to generate supplementary movie material for research paper submissions. More on this topic is discussed by Laramee [10].
3.8 Test Algorithms on a Variety of Data Sets
There are various approaches to consider when choosing test data sets.
• When developing a visualization algorithm for the first time, test it on simpler data sets you are very familiar with. In this way, the developer knows what to expect.
• If possible, create your own data generator for small synthetic data sets with known characteristics.
• Also, when debugging, find the smallest data set that produces the problem. Test on larger, more complex, and less familiar data sets after the visualization ex-hibits the expected behavior on the smaller, more fa-miliar ones.
• Test your visualization algorithm on a variety of data sets.
Believing that a algorithm works after only having tested a few small, simple data sets is a common mistake.
3.9 Exploit and Compare with Previous Literature
Chances are, you are not the first person to visualize a given data set. Compare the visualizations you create with your predecessors. This is a simple and obvious guideline, how-ever, we witness colleagues overlook this strategy fairly reg-ularly. Also, don’t hesitate tocommunicatewith those who have already worked with a given data set. Normally, col-leagues will be happy to share their experiences and share important information that was not published.
3.10 Make Exclusive Use of Accessor Methods
All class variables are accessed through accessor methods, i.e. Get() and Set() methods, e.g.,GetClassVariable(), SetClassVariable(int newValue). We advocate no exceptions to this rule. The use of accessor methods en-forces encapsulation. (See Wirfs-Brock et al. for more on this topic [24].) Accessing member variables with methods makes the implementation easy to change, e.g., afloatto anint. This methodology also prevents unwieldy (or even impossible) search-and-replace operations [17].
Another advantage of using accessor methods concerns object state. If class variable assignment is performed ex-clusively through Set() methods, then you can ensure that your objects are always in a valid state. This is due to the fact that Set() methods perform error and bounds checking on the parameters passed to the procedure. Following this convention leads to very robust code.
3.11 Follow Coding Conventions
We claim that following coding conventions helps pave the way to a successful software application. Why? Because software that is very legible is better. It has fewer bugs, is more stable, and makes developers happier. The other two key ingredients are code comment conventions, e.g., Doxy-gen (www.doxyDoxy-gen.org) and design [24]. The comment-ing, design, and modification of design is facilitated by cod-ing conventions.
Big projects require multiple, coordinated developers over several years. And, applications should not generally be started from scratch [7]. But yet, we in software devel-opment start projects from scratch over and over again– repeatedly re-inventing the wheel. One of the major prob-lems stems from source code that does not follow any con-ventions and is not very legible. As such it quickly turns into legacy code. Writing illegible code is easy and is gen-erally the default. We have encountered numerous instances of programmers who cannot even read their own code.
We offer coding conventions [8] influenced by other cod-ing standards and guidelines includcod-ing the VTK [21], Sun Microsystems [17], Meyers [15, 16] and Dickheiser [2]. They are meant to be concise so they can be printed out and hung up for ease of use. The basic philosophy behind the conventions is that code legibility should be maximized. Code with maximum legibility leads to a minimum number
of bugs. Maximizing legibility helps maximize code re-use, good design, and flexibility.
3.12 Describe the Problem to Others
If you run into an implementation error, be sure to de-scribe the problem to someone else. Dede-scribe the problem in enough detail such that the listener actually understands what it is. Often, the speaker will realize the possible sources of the problem as it’s being described. This is a phenomenon that every programmer has experienced at one time or an-other. It may be effective because it encourages the speaker to describe the algorithm step-by-step to an audience. Break-ing the process down into smaller steps may help identify missteps.
4 CONCLUSION
Implementing a visualization system poses special chal-lenges due to the large problem space a typical application encounters. We offer a set of general guidelines for finding and resolving errors while developing a visualization appli-cation. The guidelines are based on experience with devel-oping both research prototypes and commercial visualization systems. The key to debugging visualization software is to exploit the power of visualization and computer graphics it-self in combination with well-known practices. We believe the guidelines can be of use for novice and experienced vi-sualization application developers alike.
ACKNOWLEDGEMENTS
The authors would like to especially thank Eugene Zhang of Oregon State University for asking us to write down our debugging guidelines. We thank Jarke van Wijk of the Eind-hoven University of Technology (TUE) for his very valuable feedback which improved the content. We also thank Min Chen of Swansea University, Amitabh Varshney of the Uni-versity of Maryland at College Park, and Hamish Carr of the University of Leeds for their valuable discussion on the topic. We also thank Dan Lipsa of Armstrong Atlantic State University for his valuable feedback and proof-reading. We thank Zhenmin Peng, Tony McLoughlin, Edward Grundy, and Matthew Edmunds of Swansea University for provid-ing images. This research was support in part by EPSRC Grant EP/F002335/1. Questions, comments, and feedback concerning these guidelines is encouraged. Please send cor-respondence to the author.
REFERENCES
[1] P. Crossno and E. Angel. Visual Debugging of Visu-alization Software: A Case Study for Particle Systems. InProceedings IEEE Visualization ’99, pages 417–420. IEEE Computer Society, Oct. 1999.
[2] M. J. Dickheiser. C++ for Game Programmers. Charles River Media, Boston, MA, 2 edition, 2007. [3] C. Garth, R. Laramee, X. Tricoche, J. Schneider, and
Tumble Motion from Engine Simulation Data. In Topology-Based Methods in Visualization (Proceedings of Topo-in-Vis 2005), Mathematics and Visualization, pages 121–135. Springer, 2007.
[4] B. Jobard, G. Erlebacher, and Y. Hussaini. Lagrangian-Eulerian Advection of Noise and Dye Textures for Un-steady Flow Visualization.IEEE Transactions on Visu-alization and Computer Graphics, 8(3):211–222, 2002. [5] B. Jobard and W. Lefer. Creating Evenly–Spaced Streamlines of Arbitrary Density. In Proceedings of the Eurographics Workshop on Visualization in Scien-tific Computing ’97, volume 7, pages 45–55, 1997. [6] C. Laffra and M. Ashok. HotWire: A Visual Debugger
for C++. In CTEC’94: Proceedings of the 6th con-ference on USENIX Sixth C++ Technical Concon-ference, pages 109–122, Berkeley, CA, USA, 1994. USENIX Association.
[7] R. Laramee. Comparing and Evaluating Computer Graphics and Visualization Software. Software: Prac-tice and Experience (SP&E), 38(7):735–760, June 2008.
[8] R. Laramee. Bob’s Concise Coding Conventions (C3). Advances in Computer Science and Engineering
(ACSE), 4(1):23–26, 2010. (available online).
[9] R. Laramee, D. Weiskopf, J. Schneider, and H. Hauser. Investigating Swirl and Tumble Flow with a Compari-son of Visualization Techniques. InProceedings IEEE Visualization 2004, pages 51–58, 2004.
[10] R. S. Laramee. How to Write a Visualization Research Paper: A Starting Point. Computer Graphics Forum (CGF), 2009. (forthcoming, available online).
[11] R. S. Laramee. How to Write a Visualization Research Paper: The Art and Mechanics. InEurographics Edu-cation Papers 2009, pages 59–66. Eurographics, 2009. [12] R. S. Laramee. How to Read a Visualization Research Paper: Extracting the Essentials. Technical report, The Visual and Interactive Computing Group, Computer Science Department, Swansea University, Wales, UK, 2010. (available online).
[13] R. S. Laramee and R. D. Bergeron. An Isosurface Con-tinuity Algorithm for Super Adaptive Resolution Data. InAdvances in Modelling, Animation, and Rendering: Computer Graphics International (CGI 2002), pages 215–237. Computer Graphics Society, Springer, July 1-5 2002.
[14] T. McLoughlin, R. S. Laramee, and E. Zhang. Easy Integral Surfaces: A Fast, Quad-based Stream and Path Surface Algorithm. InProceedings of Computer Graphics International (CGI ’09), pages 67–76. Com-puter Graphics Society, Springer, May 2009.
[15] S. Meyers. More Effective C++, 35 New Ways to Im-prove Your Programs and Design. Addison-Wesley, 1996.
[16] S. Meyers.Effective C++, 55 Specific Ways to Improve Your Programs and Designs. Addison-Wesley, 2005.
[17] S. Microsystems. Code Conventions for the Java Pro-gramming Language, Apr. 1999.
[18] T. M¨oller and E. Haines. Real-Time Rendering. A. K. Peters Limited, 2 edition, 2002.
[19] Z. Peng, R. S. Laramee, G. Chen, and E. Zhang. Glyph and Streamline Placement Algorithms for CFD Simu-lation Data. InNAFEMS World Congress Conference Proceedings (NWC), page 66. NAFEMS, June 2009. (full proceedings on CDROM).
[20] R. J. Rost. OpengGL Shading Language. Addison-Wesley, 2 edition, 2006.
[21] W. J. Schroeder, K. M. Martin, and W. E. Lorensen. The Visualization Toolkit, An Object-Oriented Ap-proach to 3D Graphics. Prentice-Hall, 2nd edition, 1998.
[22] J. van Wijk. Views on Visualization. IEEE Trans-actions on Visualization and Computer Graphics, 12(4):421–432, 2006.
[23] J. J. van Wijk. Image Based Flow Visualization. ACM Transactions on Graphics, 21(3):745–754, 2002. [24] R. Wirfs-Brock, B. Wilkerson, and L. Wiener.
Design-ing Object-Oriented Software. Prentice-Hall, 1990. [25] A. Wong, T. Dillon, M. Ip, and W. Lin. A Generic
Vi-sualization Framework to Help Debug Mobile-Object-Based Distributed Programs Running on Large Net-works. InThe Sixth International Workshop on Object-Oriented Real-Time Dependable Systems (WORDS ’01), pages 240–247, Los Alamitos, CA, USA, 2001. IEEE Computer Society.