NORGES HANDELSHØYSKOLE Bergen, 20 June, 2011
An Empirical Analysis of How Oil Price
Changes Influence the Norwegian
Economy.
A Structural Vector Autoregressive Approach.
Svein-E Rydland
Thesis advisor: Gernot Doppelhofer Master Thesis in Economic Analysis
The Norwegian School of Economics and Business Administration
"This thesis was written as a part of the Master of Science in Economics and Business Administration at NHH. Neither the institution, the advisor, nor the sensors are - through the approval of this thesis - responsible for neither the theories and methods used, nor results and conclusions drawn in this work."
Abstract.
This thesis examines the relationships between disentangled oil price shocks and macroeconomic variables by utilizing structural vector autoregressions (SVAR). The first SVAR extends Killian`s (2009) analysis and supports his findings that shocks from oil-specific demand and aggregate economic activity leads to changes in real oil prices, while supply shocks have smaller effects. The second SVAR applies this methodology to Norway, a small, open and net oil-exporting country. Surprisingly, aggregate economic activity shocks have weak effects on the Norwegian economy which is in contrast to other net oil-exporters. Supply and oil-specific demand shocks significantly affects the unemployment and inflation rate respectively, while there is a time-varying effect on the interest rate dependent on whether there is a supply or an oil-specific demand shock.
Foreword
From the moment I started my master degree at NHH it was my intention that my thesis should be based upon empirical work. Through various econometric classes an interest for vector autoregressions developed and I started to search for relevant topics. Stumbling over the oil shock research area when planning an empirical assignment in Professor Anti Nilsen`s “Econometric Analysis and Applications” class and Norway being a large net oil-exporter the choice of topic was easy. After advice from my supervisor Gernot Doppelhofer I decided to raise the bar a bit and utilized structural vector autoregressions (SVAR) instead of ordinary vector autoregressions (VAR).
During the preliminary work I decided to drop some of the more advance econometric techniques as various bootstrap procedures which are normally included in this area of
research. This decision was made since no classes at master level at NHH teaches these topics and I decided that investing time to both learning and utilizing bootstrap procedures in
addition to structural vector autoregressions in Stata was too much. I also learned the hard way that time series is not Stata`s forté as there are several questions I have been unable to find an answer for (especially the inclusion of dummies in the SVAR`s would have been beneficial).
I would first like to offer my gratitude to my supervisor Gernot Doppelhofer. When I told Doppelhofer my plans for the thesis it was he who introduced me to Kilian`s work and convinced me to use a similar econometric approach. Although that meant a more demanding and challenging process the satisfaction upon completing this thesis is not easily exaggerated. Doppelhofer has also continuously been giving thorough and constructive feedback which is much appreciated. I would also like to give my thanks to Professor Øyvind Anti-Nilsen as it was through his classes of econometric techniques which spurred my interest for vector autoregressive methods.
I must also offer my thanks to my one and only Janne, who is probably even happier than me that this project is finally complete. Lastly, my thanks go to our son Andreas which during his second year slept through most nights, keeping the “restrictions” on my sleep to a minimum.
Contents
1.0 Introduction ... 1
2.0 The Oil Age in Norway... 4
2.1 Overview ... 5
2.2 Political Strategy ... 7
2.2.1 Industrial Policy ... 7
2.2.2 Macroeconomic Measures ... 10
2.3 Has Norway Entered a Mature Oil Producer Phase? ... 14
3.0 Oil Shock Literature Review ... 16
3.1 The Start of Oil Shock Research... 16
3.2 Asymmetric and Non-Linear Price Definitions ... 17
3.3 Structural Change ... 19
3.4 Net Oil-Exporting Countries ... 20
3.5 Criticism Against Previous Research ... 25
3.6 Disentangling Supply and Demand Forces in the Oil Price ... 26
3.7 Findings of Disentangled Oil Price Shocks Research ... 28
4.0 Methodology ... 30
4.1 VAR and SVAR ... 30
4.3 Innovation Accounting ... 32
4.3 Other Statistical Properties ... 33
5.0 SVAR I, Aggregate Oil Market ... 35
5.1 Data ... 36
5.1.1 World Crude Oil Production ... 36
5.1.2 Aggregate Economic Activity ... 36
5.1.3 Oil Price... 42
5.2 The SVAR Model ... 43
5.3 VAR Set-up ... 46
5.3.1 Unit Root Tests Results ... 46
5.3.2 SVAR Lag Length , Autocorrelation and Stability ... 47
5.3.3 Normality ... 48
5.4 Impulse Response Functions ... 48
5.5 Forward Error Variance Decomposition ... 50
5.6 Quantifying the Structural Shocks ... 51
5.6.2 Economic Shocks ... 52
5.6.3 Oil-Specific Shocks ... 53
5.6 Robustness Tests ... 56
6.0 SVAR II, Small, Open and Net Oil-Exporting Economy ... 59
6.1 New-Keynesian Model of the Norwegian Macro Economy ... 59
6.2 Data Description ... 62
6.2.1 Oil Price... 62
6.2.2 Foreign Interest Rate ... 63
6.2.3 Unemployment ... 63
6.2.4 Inflation ... 64
6.2.5 3-Months NIBOR ... 65
6.2.6 Real Effective Exchange Rate ... 66
6.3 New-Keynesian SVAR Specification ... 69
6.4 VAR Set-Up ... 71
6.4.1 Unit Root Tests ... 71
6.4.2 SVAR Lag Length, Autocorrelation, Stability and Normality... 73
6.5 Impulse Response Functions ... 74
6.5.1 Oil Production Shocks ... 75
6.5.2 Economic Activity Shocks ... 77
6.5.3 Oil-Specific Demand Shocks ... 77
6.5.4 Remaining Shocks ... 79
6.5.5 Discussion of the Innovation Results ... 83
6.6 Forward Error Variance Decomposition ... 88
6.7 Robustness Tests ... 89
7.0 Conclusions. ... 102
Appendix A ... 104
Appendix B... 119
Appendix C ... 120
C.1 Unit Root Tests ... 120
C.1.1 Augmented Dickey-Fuller ... 120
C.1.2 Phillips & Perron ... 122
C.1.3 KPSS ... 122
C.1.4 Dickey-Fuller Generalized Least Square ... 123
C.3 Autocorrelation and White Noise ... 125
C.4 Stability ... 126
C.5 Normality of the Residuals ... 127
Tables
Table 3.1:Descriptive Summary of the Most Prominent Oil Exporters in the World…………...……21
Table 5.1:Unit Root Tests SVAR I………..…104
Table 5.2:Follow Up Unit Root Test on the Economic Activity Variable………..…105
Table 5.3:VAR Length Selection Output SVAR I………..………106
Table 5.4:Lagrange-Multiplier Test for Autocorrelation SVAR I………...…107
Table 5.5:Multivariate Ljung-Box Portmanteau Test for Autocorrelation SVAR I…….……...……107
Table 5.6:Lagrange-Multiplier Test for Autocorrelation SVAR I………...………108
Table 5.7:Multivariate Ljung-Box Portmanteau Test for Autocorrelation SVAR I…………....……108
Table 5.8:Normality Tests of SVAR I……….………109
Table 5.9:The Forward Error Variance Decomposition of SVAR I………110
Table 6.1:Oil Price Correlations. Sample Period 1988-2010………..……110
Table 6.2:Unit Root Tests SVAR I………..…111
Table 6.3:Follow Up Unit Root Tests in inf SVAR II……….………112
Table 6.4: VAR Length Selection Output SVAR II……….………113
Table 6.5:Lagrange-Multiplier Test for Autocorrelation SVAR II………...…114
Table 6.6:Multivariate Ljung-Box Portmanteau Test for Autocorrelation SVAR II………...…...…114
Table 6.7:Lagrange-Multiplier Test for Autocorrelation SVAR II……….…115
Table 6.9:Multivariate Ljung-Box Portmanteau Test for Autocorrelation SVAR II………..…116
Table 6.10:Multivariate Ljung-Box Portmanteau Test for Autocorrelation SVAR II………116
Table 6.11:Normality Tests of SVAR II………..117
Figures
Figure 2.1:Norwegian Debt and Claims as a Share of Norwegian GDP……….5
Figure 2.2:Norwegian Total and Mainland GDP………6
Figure 2.3:Norwegian Total and Oil and Gas Related Exports………..7
Figure 2.4:Norwegian Oil and Gas Related Imports to Total Imports………...9
Figure 2.5:Employment in the Industrial and Public Sector of Norway 1995-2010………13
Figure 2.6:Labor Costs in Various OECD Countries 1971-2008……….13
Figure 2.7: Amounts of Oil and Gas Produced in Norway……….15
Figure 2.8: Value of Investments Related to the Norwegian Oil and Gas Sector………..15
Figure 3.1: Crude Oil Exports in Canada, Norway and United Kingdom……….23
Figure 3.2:Crude Oil Exports Relative to Economic Size……….24
Figure 5.1:World Crude Oil Production………36
Figure 5.2:Index of World Aggregate Economic Activity………38
Figure 5.3:Real Price of Crude Oil………43
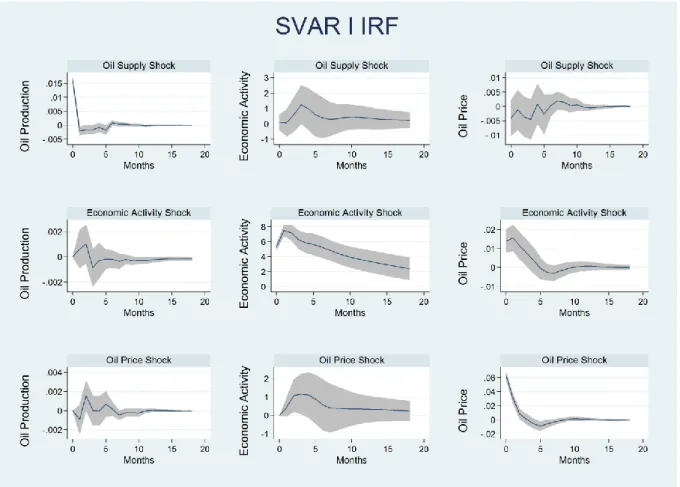
Figure 5.4:Impulse Response Functions SVAR I………..50
Figure 5.5:Structural Shocks of SVAR I………...55
Figure 5.6:World, OPEC, Non-OPEC and Saudi-Arabian Oil Production………...56
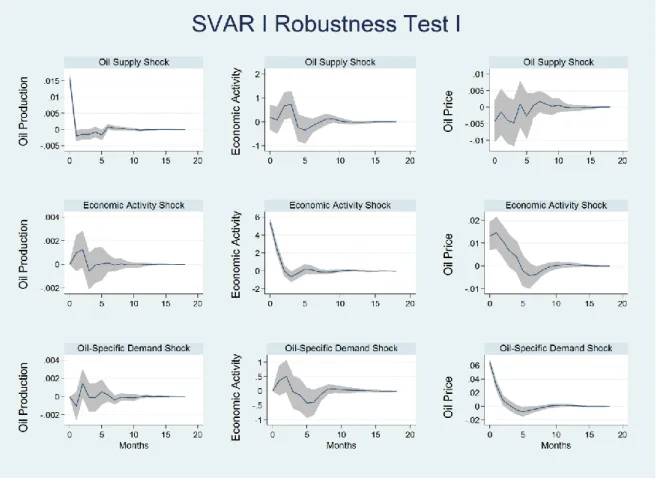
Figure 5.7:Robustness Test I for Impulse Response Functions SVAR II……….57
Figure 6.1:Real Price of Crude Brent Oil………..……62
Figure 6.2:Foreign Interest Rate and 3-Month NIBOR………63
Figure 6.3:Norwegian Unemployment Rate……….……64
Figure 6.4:Norwegian CPI……….………68
Figure 6.5:Real and Nominal Trade Weighted Exchange Rate………....…76
Figure 6.7:Impulse Response Functions SVAR II, 1/3……….……81
Figure 6.8:Impulse Response Functions SVAR II, 2/3……….…82
Figure 6.9:Impulse Response Functions SVAR II, 3/3……….………90
Figure 6.10:Robustness Test I of Impulse Response Functions SVAR II……….…92
Figure 6.11:Robustness Test II of Impulse Response Functions SVAR II………...…93
Figure 6.12:Robustness Test III of Impulse Response Functions SVAR II………..…95
Figure 6.13:Robustness Test IV of Impulse Response Functions SVAR II………..…96
Figure 6.14:Robustness Test V of Impulse Response Functions SVAR II………...…99
Figure 6.15:Robustness Test VI of Impulse Response Functions SVAR II………100
Figure 6.16: Robustness Test VIII of Impulse Response Functions SVAR II. ………...101
Figure B.1:Eigenvalue Test for Stability SVAR I………...119
1
1.0 Introduction
This thesis presents two SVAR analyses where the oil price and its effect on macroeconomic variables are studied. The first SVAR reexamines the findings of Kilian (2009), where disentanglement of the oil price was suggested in order to be able to credible predict effects from oil price changes to economic variables. Disentanglement is crucial due two reasons. Firstly, one cannot exclude the possibility of reverse causality regarding the oil price and macroeconomic variables. This means that the assumption of varying the oil price variable while holding other variables constant does not hold up as macroeconomic development itself can influence the oil price. Secondly, in previous research the oil shocks observed were assumed to be exogenous since they coincided with political turmoil and cartel behavior which caused lower supply of oil from the Middle-East region. As the recent oil price hikes is commonly believed to stem from increasing demand, especially the BRIC countries, this assumption is no longer valid. Consider the following example of a net oil-importer, if the oil price increases due to a supply shock this consequently rise energy and transport costs and all else equal, affects the economy negatively. If the oil price on the other hand increases because of higher demand, energy and transport costs surely increases in this example as well, but the negative effects may be neutralized because economic activity is growing such that firms still maintains their production and sale despite higher input costs. In other words, one must assess whether it is supply or demand factors which explain the price change as different shocks have different effects on the real price of oil and different effects on macroeconomic variables. The first SVAR in this thesis, called the aggregate oil market, extends Kilian`s (2009) analysis to include data until March 2010, such that the recent rise and fall of the real oil price is included. The first part of the thesis finds that:
1. Supply disruptions have small effects on the real oil price development. 2. Shocks in aggregate economic activity increases the real price of oil.
3. Oil-specific demand is predicted to increase both the supply and the real price of oil.
4. By quantifying the structural shocks from the SVAR model, the notion that it was increase in oil-specific demand, or precautionary demand, which led to the rise in real oil prices in the late 1970s is supported. This counters the common belief that is was just supply disruptions which caused the price hike in that time period.
2 The confirmation of Kilian`s (2009) findings makes Kilian`s analysis robust for the sample period extension and constitutes the main finding of the first part of this thesis. This allows the transition to the next step of the thesis where this methodology is applied on a net oil-exporter.
The second SVAR applies the procedure of Kilian (2009) to Norway which is a small, open and net oil-exporting economy. When analyzing the Norwegian economy the likelihood of reverse causality stated above is not a plausible concern due to Norway`s limited economic size. It is highly doubtful that Norwegian macro development have any effect on the world real oil price. It would however be interesting to examine if the underlying reason for the price change may be of importance though. Intuitively, one would expect the Norwegian economy to react with higher economic activity with oil price increases regardless of the underlying factor of the price change, as it plausible to expect investment and government revenue to coincide with the price changes anyway. The net effect of the price increase is however dependent upon two factors. Firstly, it is the degree of wealth transferred to the oil-exporters. As the price of oil increases a shift of wealth from oil-importers to oil-exporters occurs. This effect can however be short lasting as the economy of the oil-importers may deteriorate due to higher energy and transport costs which will hence reduce aggregate demand. As a consequence, higher oil prices may therefore lead to a negative trade effect which would decrease the net effect of oil-exporters. This illustrates the importance of disentangling the underlying reason of the price change as a supply or demand shock may lead to different outcomes for the oil-importers economies and thus different net effects for the oil-exporters as well. The economy of a net oil-exporter may therefore be highly
contingent on why the oil price changes as well as the price level and therefore justify an econometric analysis of this phenomenon.
The SVAR model applied in this part is based on New-Keynesian principles to see how the disentangled real price of oil influences Norwegian macro development. This part of the thesis is inspired by Bjørnland`s empirical methodology and her work constitutes a foundation which my analysis is based upon.
3 The second part of this thesis finds:
1. Significant findings despite macroeconomic control functions implemented to deter such effects. The introduction of the Norwegian Petroleum Fund and measures to limit the degree of investments from the petroleum sector are thereby not entirely
successful. However, as the overall responses of the model is of moderate degree this thesis gives support to Thøgersen`s (2004) conclusion that the mechanism of oil revenue management is relative successful.
2. Significant findings despite indications that Norway has entered a mature phase as an oil-producer. This means that the impulses from the oil sector are not weaker even though the oil production has stagnated.
3. Shocks originating from aggregate economic activity have surprisingly weak effects on the domestic economy, which is in contrast to the findings of other net oil-exporters. This is quite puzzling as it would be plausible to expect that oil price increases due to higher demand would lead to stronger results since the negative trade impact from the oil importing countries discussed above would at least be partly negated by increased economic activity.
4. Supply shocks are the only shocks which affect the unemployment rate, although only moderately. The unemployment rate in Norway has however fluctuated around
relatively low values, especially in recent time.
5. Oil-specific demand is the only variable to give significant predictions about the inflation rate.
6. A time-varying response in the interest rate is found regarding supply and oil-specific demand shocks. An increase in oil-specific demand leads to a significant increase in the interest rate three months after the shock, while a significant response following a supply shock is not predicted to happen before nine months after.
7. The exchange rate is predicted to appreciate with aggregate economic activity or specific demand shocks. The appreciation is expected when examining a net oil-exporter, but the effect is however weak. The thesis confirms Bjørnland`s explanation of why the predictions of the Norwegian exchange rate have such low significance. Since the interest rate in Norway has a lagged response to oil price increases relative to the foreign interest, the interest differential offsets the appreciation pressure on the Norwegian exchange rate.
4 The thesis is organized as follows. Section 2 gives a descriptive overview of the development of the oil industry in Norway, economic performance and the relevant political strategies from the 1970s to present time. Section 3 presents a literature review of the oil price shock area starting with the oil crisis of the 1970s, followed by the notion of asymmetric price effects and structural change in the 1980s and finishing off with the disentanglement of oil prices. Section 4 presents the methodology utilized in the thesis. Section 5 contains the first SVAR, an empirical analysis of the aggregate oil market, where the oil supply and demand are disentangled from the oil price. Section 6 contains the main empirical analysis where three different oil price shocks are induced to see how Norwegian macroeconomic variables respond in a New-Keynesian setting. Section 7 concludes.
2.0 The Oil Age in Norway
Norway is one of the largest exporters of petroleum products today and is generally perceived as an oil and commodity driven economy. The oil age in Norway started in the 1970s when Phillips Petroleum started drilling in the marine reservoir known as Ekofisk, which actually was still in operation when this analysis was performed in 2010/2011. Since oil is a scarce product which enables higher capital gains, the discovery of oil opened up new possibilities for Norway and it did not take long before impacts on the Norwegian society could be observed. This section starts with a descriptive section which gives a short overview of the development in relevant economic indicators from the initial phase of the oil age to present day. The political strategy is also given attention and has been divided into two entities where the first part is regarding industrial policy, which focuses on actions related to building up an industry which could serve domestic oil production. The second part of the political strategy presented can be described as policies introduced to provide a stable macroeconomic
environment. Lastly, I discuss if Norway has entered a mature phase as an oil producer as this potentially influences the results from the econometric analysis.
5 2.1 Overview
The development in the government budget describes the transition to a net oil-exporting country well. As illustrated in figure 2.1 the Norwegian government budget has gone through dramatic changes post-WWII. The budget balance was relative stable and negative until the middle of 1970s. From 1975 there is a dramatic increase in the deficit and does not return to previous levels until the middle of 1980s. The dip in the mid-1980s is a reaction to the recession caused by the bank crisis which had a significant effect on the whole of Norwegian economy. From the 1990`s there is a clear upward trend in the budget balance which has continued to increase until present time. One shall not draw too strong conclusion from a single descriptive graph, but the pattern in the budget balance coincide with the huge initial investment related to petroleum extraction and the following extra profits related to this industry.
Figure 2.1: Norwegian Debt and Claims as a Share of Norwegian GDP.
There are however other important events which could explain the increased deficits. In the 1970s the Norwegian labor market can be classified as a corporative, where the unions of employees and employers, LO and NHO included the government in wage negotiations. The rationale for the government to participate in these negotiations was to have an opportunity to keep the price level stabilized, by using subsidies and price controls. The general perception was that government intervention thereby would have a positive impact on the economy and securing a stable economic environment. During the 1970s when the public became aware of the profit opportunities the oil extraction would bring, this translated into demands for higher
6 wages. As the government was not willing to use political capital to reject the demands this resulted in increased budget deficits. Other groups in the Norwegian society also lobbied to get increase funding, especially Norges Bondelag, the main farmer organization in Norway. The lobbying successfully accomplished increased capital allocation to farmers with the “Opptrappingsvedtaket for landbruket” in 1975 (Hanisch, 1995). This certainly contributed to the negative development in the 1970s illustrated in the graph due to increased wage demand and prices which contributed to loss of market share for Norwegian export firms and higher unemployment.
In a small economy as Norway it is reasonable to illustrate the total GDP and the mainland GDP as separate entries since the revenues related to petroleum activities on the continental shelf are such an important source of income. This is illustrated well in the figure 2.2 which graphs the development of the total GDP and mainland GDP for Norway from 1978-2010. It is from the beginning of the 1980`s that the petroleum revenues begin to make an impact in the GDP figures, which not surprisingly coincidently was also when the Norwegian deficit began to decrease (see figure 2.1) The share of petroleum revenues continues to increase through the whole sample until 2005, where a slight decrease is observed. It should also be mentioned that both of the GDP measures show a small contraction at the end of the sample due to the financial crisis of 2008.
7 Figure 2.3 shows the value of total Norwegian export and the value of petroleum product exports and oil related exports1 in millions NOK from 1978-2008. As can be seen the total value of export are closely related to the value of petroleum exports. This is an additional support for the reasoning previously done regarding the government budget balance, where there are strong indications that the oil revenues are main determinants of the government balance. At the end of the sample we see a decline in the response of the financial crisis in both export measurements. It also seems to be a reduction of the value from oil and gas from 2003 to present time indicating Norway has entered a phase as a mature oil exporter. As we can see the export of other oil related products is quite stabile throughout the whole time period so these exports will not compensate for the reduction of revenue directly stemming from oil and gas exports.
Figure 2.3: Norwegian Total and Oil and Gas Related Exports.
2.2 Political Strategy 2.2.1 Industrial Policy
Before Phillips Petroleum proved oil reserves in the Ekofisk sector only a marginal share of the Norwegian industry was related to oil extraction and services. Consequently, foreign labor and knowledge was necessary in order to build up required infrastructure for oil extraction. A political strategy was then formed to ensure the demands from the petroleum sector could be
1
Oil related exports include sales of new and old platforms, refined oil products, oil services, drilling, pipe transport and other diverse oil products.
8 met by domestic capacity. In January of 1976 the Norwegian parliament approved a buy-up of companies to create a large nationalized oil-company with total costs estimated to reach 900 million NOK (Drzwi, 2005). The ambitions of the development and control of the petroleum sector can be clearly seen in government reports from that era1. The goals were firstly, government involvement in all phases of the extraction and refining of oil. Secondly, foreign suppliers should be gradually replaced with Norwegian firms. Thirdly, full control over reservoirs, including production quotas and timing of construction and various development.
To secure that Norwegian workers and firms could participate in the oil industry Stortinget also legislated that the state-owned oil company Statoil, should have a minimum share of 50 percent on each extraction field in the Norwegian continental shelf. This legislation had to be abandoned during the ratification of EU`s oil-directive in 1994 (Drzwi, 2005). However, by then the protective barrier had enabled Norwegian companies to build up a considerably amount of experience and knowledge and several firms were even able to compete at an international level.2 Halvorsen et al. (2004) supports this as they report that among the FDI originating from Norway, it is investments related to the oil industry which make up the largest share, mostly coming from Statoil and Hydro.3
In order to see how successful the Norwegian industrial strategy has been one could look at figure 2.4which graphs the share of oil related products relative to total imports. If the industrial strategy is successful one would expect a decline in the amount of imports needed since the demand is covered by domestic firms. The development in figure 2.4must be characterized as volatile with huge spikes in the early 1980s, 1990s and 2000s. It is also a downward trend from the late 1970s to present time which indicates that imported inputs to the Norwegian oil industry is declining and thereby a higher coverage by domestic firms. Other important factors which could explain the development in the figure is firstly the Norwegian exchange rate. In times of appreciation (depreciation) imports would become relatively cheaper (more expensive) and domestic firms would be less (more) competitive.
1
St.meld. nr. 53, 1979-80.
2 International contracts won by Norwegian firms related to the oil industry: Helikopter Service: 250 mill NOK in Canada, Ugland Gruppen: 750 mill. NOK Canada, Scandinavian Service Partner & Industrial Catering: 220 mill. NOK in Uganda, Kongsberg Offshore: 100 mill. NOK in Brazil.
9 Domestic production capacity could also be of relevance, as capacity gap gets smaller the marginal costs would increase and make domestic firms less competitive. This second effect could be very relevant when large projects are undertaken which would raise the need to put some orders in firms abroad. The side effect from building up an industrial sector aimed to serve the oil industry is that the domestic economy will increasingly be affected by impulses and cycles from this business.
Figure 2.4: Norwegian Oil and Gas Related Imports to Total Imports.
The Norwegian state also encouraged firms to achieve higher extraction rates from oil reservoirs which could also be linked to the goal of increased Norwegian competence within the oil industry. The increased rate of extraction is important as it is not unusual that the marginal cost of oil extraction surpasses the marginal revenue when only roughly 50 percent of the petroleum has been extracted from a given reservoir. In a government report increased funding for PETROMAKS is proclaimed, a program aimed at increasing effectiveness in petroleum extraction1. In addition it is also opened up for tax refund for searching and test drilling costs.Firstly, a direct effect of increased extraction rates would lead to increased revenue due to increased tax base. Secondly, as Norwegian firms would be able to extract more oil from a given field than their competitors they would increase competitiveness as they can bid higher for any given marine reservoir in the world. It should also be mentioned that incentives offered by the Norwegian government was given to all companies and therefore not excluding foreign companies. But since Statoil at least had 50 percent of each
10 developed reservoir, Norwegian companies surely gained the lion`s share of the benefits from this policy.
2.2.2 Macroeconomic Measures
2.2.2.1 Investment Reallocations
In order to reduce the vulnerability of the domestic economy from impulses originating in the oil industry, a focus on reallocations of investments originating from the petroleum sector can be observed in public records. In a government proposition1, we see that the government wants to reduce investment on the continental shelf to enable a higher activity in the mainland economy. Given limited amount of resources in an economy increased activity in one sector will divert resources from other sectors. As the Norwegian economy has been characterized by a relatively low unemployment rate, labor resources are indeed of a limited amount. By reducing or stabilizing the need for labor in the petroleum sector the government could use those resources to mainland investments instead. Analysis by Eika (1996b) and Johansen & Eika (2000) finds, despite the attempts from the government, that the petroleum industry has had a pro-cyclical effect. Even though the impulses were not strong enough to change the overall pattern of Norwegian business cycles, the ambitions to control the effects from the impulses of the oil industry on the domestic economy could not be described as successful. An explanation for this could be the composition of the demand of the oil industry. The total demand from this sector can be divided in three. First, investment related to searching, building and development of fields. Secondly, direct demand for workers on and offshore. Thirdly, demand of goods and services related to ongoing operations. Eika, Prestmo & Tveter (2010) finds that investments from the oil industry, the first demand effect, has become less significant for the Norwegian economy since the Norwegian oil production has in their opinion entered a mature phase. Accordingly, this makes it much more difficult for
institutions to control the effects from the oil industry by focusing on investments since wages and inputs makes up a larger share of the total costs. Eika et al. (2010) further estimates that
1
St.prp. nr.1 Tillegg nr.3, 1.1
“http://www.regjeringen.no/nb/dep/fin/dok/regpubl/stprp/19971998/stprp-nr-1-tillegg-nr-3-1997-98-/1.html?id=136851”
11 in 2009 roughly 206.000 persons or 8 percent of the labor force is directly or indirectly
connected to the oil industry. When such a large fraction is connected to the oil industry, controlling the effects from this industry will be notoriously difficult.
2.2.2.2 The Norwegian Petroleum Fund
“I spent 90% of my money on women and drink. The rest I wasted”, George Best.
The first time the question of how the oil revenues should be utilized was first taken up in October 1984 and March 1985 when a commission was established to answer this question (Drwzi, 2005). Most likely this was a response to the government white paper NOU:1983:27 (“Tempoutvalget”), but it was not until NOU:1988:21 (“Steigumutvalget”) wheels were set in motion to introduce a separate fund to manage the increasing oil revenues. In 1996 the first deposit in the Norwegian Petroleum Fund (NPF) “Statens Petroleumsfond” was made, while Norges Bank hired the management in charge of the fund in January 1998. NPF annually receives capital equal to the cash flow earned from the oil revenue in addition to the returns from previous investments. The capital is invested in real estates, equities or fixed-income securities in foreign markets. In present time the NPF holds over 3000 trillion NOK or a value equivalent to a holding of 1 percent of all the world’s stock markets.
There are two important mechanisms which the petroleum fund utilizes. First, since NPF investments are strictly done in foreign markets oil revenues are not directly transferred into the Norwegian economy. Instead, the revenues are kept in US dollar currency until capital has been invested in various foreign countries. The positive effect of this is that any supply or demand pressures on the Norwegian currency directly originating from the oil revenues are circumvented.
The second mechanism is regarding the extraction of wealth from the NPF. The Norwegian government extracts adequate capital to cover the budget deficit each year, but this amount shall not exceed four percent of the total value of the fund. This rule based policy called the
12 “handlingsregel” came into effect in 2001 and is respected by most of the political parties represented in the Storting. Although the rule based policy has not been strictly followed, Thøgersen (2004) concludes that it has been highly successful, relative to other countries attempts to reduce the inflow of capital related to oil revenues. It should also be mentioned that the extraction policy has exceptions, as when there are downturns in the business cycle or when the fund`s returns is higher than expected.
2.2.2.3 The Dutch Disease
The two above mentioned mechanisms of the NPF contribute to macroeconomic stability in Norway and could quite possible offer the explanation for why the Dutch Disease
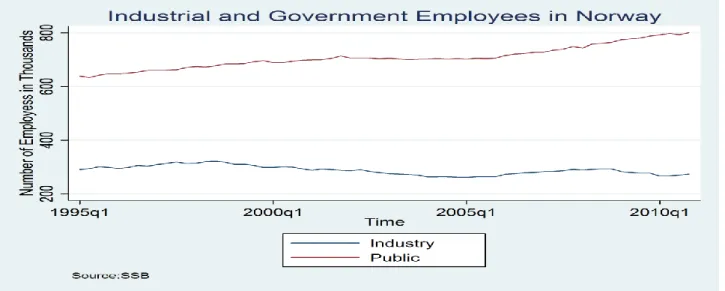
phenomenon is not to a large degree observed in Norway. The Dutch Disease originated in the Netherlands in the 1970s and explains the significant changes in its industrial structure. As the extraction of petroleum products channeled large revenues into the economy, more resources were allocated to the petroleum and service sectors while the industrial sector declined. When most of the petroleum had been extracted a painful transformation of its economic structure was necessary to adapt to the new reality when super profits from the petroleum sector had declined. Even though Norway has not seen the kind of de-industrializing as the Dutch economy experienced the Dutch Disease may be observed in other areas. As can be seen in figure 2.5 the government sector has been steadily increasing by increasing employment, while the industrial sector has stagnated. Change in labor costs have in more recent time also increased more than the costs in our main trading partners. It should however be mentioned that costs increases in Norway has also been lower than in the OECD in most part of the 1990s, see figure 2.6. Bjørnland (2010) presents other noteworthy points which should be given attention; one fourth of all Norwegian receives some kind of benefit from the state and every fourth worker works in the public sector. In addition to this a large degree of people are outside the workforce (which are then not considered when calculating unemployment rate, thereby partly explaining low unemployment rates in Norway).
13
Figure 2.5: Employment in the Industrial and Public Sector of Norway 1995-2010.
Figure 2.6: Labor Costs in Various OECD Countries 1971-2008.
Eventually, the only way to evaluate how infected the Norwegian economy is from the Dutch Disease is when oil reservoirs starts to run empty. Several studies have tried to predict how the transition from not being an oil exporter will affect the Norwegian economy. Cappelen, Eika & Prestmo (2010) predicts that the transition will go “fairly well” if the Norwegian economy still retains its flexibility as previously experienced. Bjørnland on the other hand is more skeptical to this scenario and believes the Norwegian economy to be more dependent on oil than Cappelen et al. (2010) assumes. Bjørnland especially points to her finding her finding (2009) where a close relationship between the stock market and oil prices was found and argues that much of the Norwegian industry enjoys a positive indirect financial effect from the oil sector which diminishes as oil extraction is reduced. Bjørnland & Moen (2011) also
14 points to the fact that when Norwegian oil reserves runs dry, many Norwegian firms serving the oil sector will lose the geographical advantage of being close to extraction sites and thereby lose competitive power.
2.3 Has Norway Entered a Mature Oil Producer Phase?
As oil is a non-renewable resource oil producers will eventually experience declined oil production as reservoirs empties, entering a mature oil producer phase. The nature of the oil industry is also characterized by heavy initial investments as fields are developed, while investments related to expansions are relatively less capital intensive. This means that as a country enters a mature oil producer phase the impact from the oil industry on the economy lessens both directly from the reduced production, but also indirectly since the highest degree of investment is done in the initial producer phase. Eika, Prestmo & Tveter (2010) reports that purchases of goods and services related to operations are at present times almost at the same level as investments, indicating a mature phase has indeed started.
Looking at figure 2.7, the Norwegian oil production has passed its peak production in 1996 and 2001. Gas production has on the other hand increased steadily since 1995 and shown no signs of slowing down. This further opens up the possibility that Norway has entered a mature oil producer phase, but as a gas producer such a description would be incorrect. However, since gas extraction utilizes much of the same infrastructure as oil extraction, this would consequently mean that investments not necessarily rise due to increased gas extraction. The figure 2.8 does however clearly show that investments have increased in the later time periods. The lower oil production can also be explained by a reduced emphasize on replacing existing reservoirs with new findings. Insight from Cole & Elliott (2003) predicts that
environmentalism principles increase as the GDP per capita increases. That is, as a nation grows richer and standard of living gets higher ecology and green politics becomes
prioritized. This is exemplified in Norway with the political discussion of 2010 regarding oil development in the Lofoten region in North-Norway. As Lofoten is a remarkable location hosting both world unique fishery resources and a nature hoisted by tourist agencies for its distinctiveness, development plans in this region has been heavily criticized. Despite reassurance from oil companies that any effect from eventual spill-out will have marginal
15 consequences, any plans of oil development in this area has been postponed by the current government. Consequently, using insight from Cole & Elliott (2003) findings means that even if Norway`s undeveloped reservoirs could keep oil production volumes stable or even
increased, society`s increased utility from “untouched” nature hinders such a scenario.
Another indication that Norway has entered a mature phase is Statoil`s announcement in 2011 of a new type of oil rig, specially designed for cost effective extraction of oil in mature
reservoirs, called cat D1. Statoil has also opened up for taking ownership shares to encourage buyers to invest in this oil rig, which is unusual in this industry, indicating the importance of this kind of development for Statoil. As there are several indications that Norway has entered a mature phase as an oil producer this will be considered during the econometric analysis.
Figure 2.7: Amounts of Oil and Gas Produced in Norway.
Figure 2.8: Value of Investments Related to the Norwegian Oil and Gas Sector.
1 http://www.statoil.com/catd
16
3.0 Oil Shock Literature Review
This section presents first the stages the oil shock research area has gone through from the 1970s to present day. The oil shock research can be roughly divided into three development stages where the first stage in the late 1970s and beginnings of the 1980s first utilized vector autoregressive (VAR) techniques to analyze the relationship between oil prices and economic variables. The second stage in the 1980s was born out of the weaker and low significance of the oil price and economic development relationship. This made the researchers focus on price definitions in order to achieve significance in their analysis. The third stage focus on the underlying factors which explains why oil prices changes and it is the insight gained from this area which makes up the basis for the econometric analysis in this thesis. Research findings with emphasis on studies regarding net oil-exporters will also be presented to illustrate that responses to oil price changes differs from one oil-exporter to another. This demonstrates that generalizations between different oil-exporters without a deeper country specific assessment could be faulty. The econometric analysis of this thesis is thereby justified as Norway share few characteristics with other noteworthy net oil-exporters and generalizations to the Norwegian economy is unlikely not be robust. There is also a section presenting critical remarks about the various oil price definitions and the censoring of data which is applied and is a further support of the econometric foundation this thesis is based on. Lastly, a detailed presentation of the last stage of the oil shock research is given since this stage is the most important regarding this thesis and also illustrates why some of the earlier research provided unstable results.
3.1 The Start of Oil Shock Research
The first wave of research regarding oil price shocks stems from the experiences of the oil crisis in the 1970s. One of the first articles within this field is Rasche & Tatom (1977), where the oil price and potential GNP level were analyzed. Their findings gave clear indications that the higher oil prices had a negative effect on the US GNP. Another important article was Hamilton (1983) who also suggests a negative relationship between the oil price and US macro variables, and in addition that oil price changes Granger caused changes in US
unemployment and GNP. Hamilton also pointed to the suggestive fact that nine out of ten US recessions post WW-II was preceded by a spike in oil prices. Most of the research performed
17 in this period was heavily concentrated at the US response, but Burbidge & Harrison (1984) confirms that major OECD countries show similar response as the US. Although most body of research done in this early period confirmed the significant negative effect of oil price shocks there were some studies who reported conflicting results with the mainstream, as Darby (1982).
3.2 Asymmetric and Non-Linear Price Definitions
During the 1980s the linear relationship predicted by the early research began to fade. That is, when the oil price decreased in the second half of the 1980s, the effect on economies was smaller than what the models predicted. This gave rise to a new paradigm within the oil shock research area and the idea of asymmetric price effects was born. The first article which
presented an analysis based on asymmetric effects from the oil price was Mork (1989), utilizing price definitions seen in equation 3.1 and 3.2. (The price definitions are presented fairly detailed since section 3.5 presents arguments of their weaknesses.) Mork found support for the notion that oil price increases had a negative significant effect on the GDP of US and other OECD countries, while oil price decreases had no significant effect at all. The rationale behind the asymmetric response was that oil crises caused concerns about the energy price and availability, which caused a delay or cancelling in decisions of irreversible investments. Accordingly, a decrease in oil price will not lead to a positive effect which mirrors the negative consequences of an oil price.
( ) (3.1)
( ) (3.2)
Hamilton produced the most widely used oil price definition in 1996, called the net oil price measure. This is in essence a further development on the predicted non-linear relationship between the oil price and the macro economy. Hamilton (1996) argues that Mork`s definition does not adequately handle the data since most of the oil price increases since 1986 have followed immediately after larger decreases. Thus, Hamilton claims an oil price definition where the price of oil is given time to adjust to new levels is necessary, see equations 3.3 and
18 3.4. The mechanics is as follows; an observed oil price takes the value of zero if the price is not higher than any of the previous 12 months and takes the observed value otherwise. The basic idea is that the oil price is given time to adjust to a new equilibrium level. In other words, Hamilton argues that most oil price movements are correction to earlier time periods. Hamilton further builds on this definition in his 2003 article where he increases the time period to 36 months.
, (
)- (3.3)
, (
)- (3.4)
An alternative non-linear oil price definition which is popular in the literature is Lee, Ni & Raati (1995) definition. By using a univariate GARCH error process Lee et al. compute the unexpected component and conditional variance of the oil price. The basic premise for this process is to illustrate that oil price shocks have a larger effect on macro variables in stable environments than in environments characterized as volatile. Lee et al. then augment the VAR models of Mork and Hamilton and support their findings regarding asymmetric relationship between the oil price and macroeconomic variables.
The last definition presented is an oil price band definition. That is, a band is defined which transform the variable to zero if the observed price is within a set of given values and takes the observed value if the price is outside the chosen band. This definition is not widespread in the literature, but Akram (2004) used it to observe if the oil price would affect the Norwegian exchange rate.
19 3.3 Structural Change
There has also been a growing literature that a structural change happened in most modern economies during the 1980s. A structural change in this setting means transformations in economic fundamentals. Economic fundamentals which are often brought into the discussions in this topic are real wage rigidity, monetary policy, the declining share of oil in economies and lastly the lack of other big exogenous adverse events.
This area of research have been rising lately since the oil price shocks in mid and late 1970s caused the dreaded stagflation while recent oil price spikes have contrariwise coincided with GDP growth and stable inflation. Blanchard & Gali (2007) finds strong indications that a structural change indeed has taken place. By dividing the sample in pre and post 1984, they find that output and inflation measures are less influenced by oil prices in the latest sample. Blanchard & Gali base their findings firstly on reduced share of oil in consumption, as this makes each country less vulnerable to changes in oil prices. Secondly, changes in monetary policy which has emphasized a stable inflation rate. Thirdly, more competitive labor markets have reduced the wage rigidities. When the wages are increasingly flexible this leads to less negative consequences for the output and inflation rate. Fourth, recent time period of high oil prices has not coincided with other adverse shocks. Hooker (2002) supports the structural change hypothesis, but cannot attribute this to changes in energy intensity or monetary policy.
Jiménez-Rodríguez & Sánchez (2009) also confirms that the effects of oil price shocks were greatest in the 1970s, but they also maintain that the oil price is still very relevant regarding macroeconomic development in advanced major economies in both the 1980s and 2000s. Lastly, Baumeister & Peersman (2008, 2009) and Peersman & Von Robays (2009b) objects the comparison made over time periods done by Blanchard & Gali, due to structural changes within the global oil market. By structural changes within the oil market Baumeister &
Peersman (2008) means that the oil supply and demand curves have become much steeper and less elastic over time. That is, recent shocks in demand or supply are characterized by a much smaller impact on world oil production and a greater effect on oil prices compared to the 1970s and early 1980s. Since Blanchard & Gali (2007) assumes constant elasticity of demand, Baumeister & Peersman (2008) argue their comparison over time periods is faulty.
20
3.4 Net Oil-Exporting Countries
Historically the research within the oil shock area mainly concentrated on the US economy, in fact most articles mentioned so far in this thesis either examine the US or one of the G7 economies. This implies that most of the research focused on how oil prices influence a net oil-importing country. Only in more recent times have researches started to focus on how oil price shocks influences economies which are net oil-exporters. This section provides an overview of relevant findings regarding net oil-exporters.
Studies regarding the GDP and government expenditures offer indications that the effect from oil price changes differs from oil-exporting countries. Lorde, Jackman & Thomas (2009) and Farzanagan & Markwardt (2009) conclude respectively that Trinidad & Tobago and Iran have higher GDP and government expenditures during positive oil price shocks. As those countries do not have similar mechanism as the Norwegian Petroleum Fund which lessen the degree of impact from oil price shocks on the domestic economy (see section 2.3), generalization from these studies to the Norwegian economy would be naïve.
Mehrara & Oskoui (2007) examine Iran, Saudi Arabia, Kuwait and Indonesia and finds that oil price shocks are the main source of output fluctuations of output in Saudi Arabia and Iran, but not in Kuwait and Indonesia. Regarding Kuwait, the non-influence from oil prices is attributed to savings and stabilization funds and could be interesting compared to Norway. In Indonesia structural reforms and diversification away from resource based production are the main explanations. It should also be mentioned Indonesia`s oil export has fallen dramatically over the years (Indonesia actually left OPEC in 2008) which offer an alternative explanation. Regarding the top oil-exporters in the world (see table 3.1), Dibooglu & Aleisa (2004), finds that the Saudi-Arabian CPI, exchange rate and output are driven by the real oil price, while Rautava (2004) finds that the Russian exchange rate appreciates during oil price increases. This is in line with what Haldane (1997) claims, as net oil-exporting countries experience higher demand pressure, this increases inflation and thereby the exchange rate.
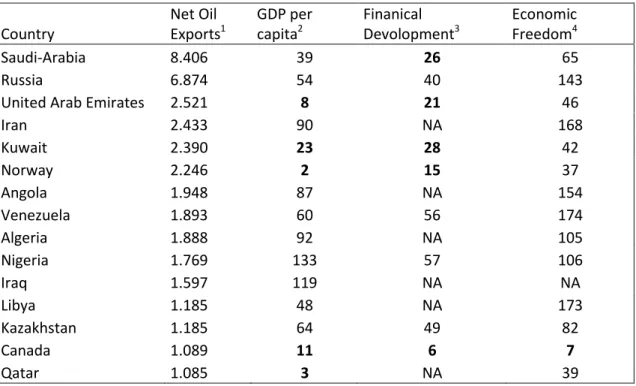
21 Country Net Oil Exports1 GDP per capita2 Finanical Devolopment3 Economic Freedom4 Saudi-Arabia 8.406 39 26 65 Russia 6.874 54 40 143
United Arab Emirates 2.521 8 21 46
Iran 2.433 90 NA 168 Kuwait 2.390 23 28 42 Norway 2.246 2 15 37 Angola 1.948 87 NA 154 Venezuela 1.893 60 56 174 Algeria 1.888 92 NA 105 Nigeria 1.769 133 57 106 Iraq 1.597 119 NA NA Libya 1.185 48 NA 173 Kazakhstan 1.185 64 49 82 Canada 1.089 11 6 7 Qatar 1.085 3 NA 39
Table 3.1: Descriptive Summary of the Most Prominent Oil Exporters in the World.
There is however a caveat which invalidates any generalization from these findings to the Norwegian economy, since countries with similar amount of oil-exports has different economic characteristics. The table 3.1 ranks the top 15 net oil exporters in the world with Saudi-Arabia and Russia as the dominant net exporters, while Norway is ranked sixth. Also found in the table are different development indices with the respective world rank given to the countries. As shown there are large differences within the group of countries, where especially Canada, Qatar, United Arab Emirates, Kuwait and Norway separates from the rest of the group. The argument raised here is that empirical results from oil-exporting countries not necessarily can be generalized to other net oil exporters since higher economies in developed countries might react differently than less developed countries.
1 US Energy Information Administration (EIA): http://www.eia.doe.gov/country/index.cfm 2
International Monetary Fund:
http://www.imf.org/external/pubs/ft/weo/2010/02/weodata/index.aspx 3
World Economic Forum:
http://www.weforum.org/reports/financial-development-report-2010?fo=1 4
The Heritage Foundation and Wall Street Journal: http://www.heritage.org/index/ranking.aspx
22 As an example of how oil price effect may vary across oil exporters with different levels of development may be due to a credit risk effect and capital costs. The CME Group releases risk assessments of sovereign debt on a quarterly basis. Their latest CMA report (2010:5) concludes that Norway is the least risky country included in their sample while Venezuela is at the bottom of the same list. Hypothetically, if the oil price unexpectedly increases the perceived risks of both countries decreases due to higher expected future revenues. Since Norway already has a very low risk it would however be reasonable to expect that Venezuela will have a relative larger reduction of risk. Consequently, this further leads to relatively lower capital costs in the risky country which enables agents to channel capital to investment projects which was not profitable before the oil price increase. In other words, investments might increase relatively more in Venezuela than in Norway since Norway already have low capital costs thus stimulating the Venezuelan economy higher than the Norwegian.
Jiménez-Rodríguez & Sánchez (2005)examines how selected OECD countries, which are roughly equal developed economies, including both net importers and exporters of oil, respond to oil price changes. First, their findings regarding net oil-importers show decreasing output and increased inflation in line with previous research. Secondly, Norway and UK which are both net oil-exporters show contrasting result. Interestingly they find that Norway has a positive response, while the UK reacts similar to oil-importing countries. Jiménez-Rodríguez & Sánchez (2005) argue that the exchange rate behavior explains this phenomenon as the pound appreciates relatively more than the Norwegian exchange rate, which is an indication of the Dutch Disease. That is, the positive effect from increased revenue is negated by the rise of the exchange rate which lessens the competitive power of the UK export
oriented industry. Thirdly, the Canadian economy which became a net oil-exporter during the sample period is the only country which reacts negatively to oil price decreases, while the UK again reacts as an oil-importing country and Norway has no significant response. Using an alternative measure for oil shocks Kilian (2008a) supports the findings that UK reacts similar to an oil-importing country.
Bjørnland (1998b, 2000) offers further insight into how similar net oil-exporters react differently and illustrates the importance of economic structures in the respective countries studied. More specifically, Bjørnland (1998b) argues that during the oil price increase in the
23 1980s, the macroeconomic policy in UK differed from the Norwegian policy in two areas. Firstly, UK had external debt which needed to be paid off and secondly combatting the high inflation rate was highly prioritized. This lead to fiscal and monetary tightening which ultimately resulted in higher unemployment. Thus, whereas Norway followed an expansionary fiscal policy to maintain the industry structure, the UK allocated the extra windfall revenue to debt reduction and increasing the social security costs (as unemployment increased due to monetary policy). Another reason for the different response could simply be a quantity effect, as Canada and UK have relatively less exports of oil and thereby gains less, as indicated figure 3.1. Even though the UK export volume was greater in the 1980s figure 3.2 illustrates the importance of the oil volume relative to the size of the oil-exporter economy. Figure 3.2 supports the view that the oil industry makes up a larger share of the Norwegian economy than both the UK and Canadian economy. The difference between the UK and Norwegian response could also be due to the fact that both countries are net oil-exporters, but whereas Norway is also a net energy-exporter, UK on the other hand is a net energy-importer (Peersman & Von Robays, 2009b). In fact, UK is the largest receiver of Norwegian oil as un-stabilized crude oil is pipelined from Ekofisk to Teeside.
24
Figure 3.2: Crude Oil Exports Relative to Economic Size.
Akram (2004) examined the response of the Norwegian exchange rate and finds that when the oil price wanders outside a specific price range a negative relationship with the nominal exchange rate develops. Bjørnland (1998a) finds that the Norwegian real exchange rate depreciates during an oil shock and this result is robust if the oil price is measured in US or NOK and nominal or real terms. Her explanation for this finding is that the Norwegian consumer prices behave more sluggishly than the trading partners of Norway. Bjørnland (2009) on the other hand finds that during an oil price increase an appreciation of the nominal NOK is predicted, but this is not significant. The insignificance in the NOK exchange rate is explained by the findings of different monetary response of Norway and countries abroad. Bjørnland`s (2009) estimations show that countries abroad react more quickly with monetary tightening during an oil increase while the Norwegian response is more sluggish. This leads to an interest differential which, ceteris paribus, puts depreciation pressure on the Norwegian exchange rate. Solheim (2008) on the other hand finds that the Norwegian nominal exchange rate appreciates during higher oil prices.
25 3.5 Criticism Against Previous Research
As stated above Mork`s (1989) definition allows for an asymmetric effect from the oil price (see equation 3.1 and 3.2). That is, an oil price increase (decrease) may be significant while an oil price decrease (increase) may not be a significant factor explaining the development of macroeconomic variables. Kilian & Vigfusson (2009) is however critical to this censuring method, where the researcher can simply set values to zero dependent on their sign. This censuring process might lead to inconsistent results and overstate the true relationship between the oil price and other macroeconomic variables. Kilian & Vigfusson (2009) finds weak support for the slope coefficients to show any indications of asymmetry. Also, tests of the symmetry regarding the impulse reaction functions do not offer strong evidence against the null of symmetric relationship between the oil price and macroeconomic variables (Kilian & Vigfusson, 2009).
Although the net oil price definition has gained support in the empirical analysis in this area, (see equation 3.3 and 3.4) Hooker (1996) responded quickly with critical remarks to
Hamilton`s oil price definition. Hooker questioned how Hamilton disregards decreases in the oil price and says this could influence the structure in the model. Hooker later follows up his criticism in his 1999 article and support this by not finding a relationship between Hamilton`s net oil price definition and US unemployment or inflation rates.
As with Mork`s oil price definition Kilian & Vigfusson (2009) also criticize the net oil price definitions and notes that few articles support the asymmetric assumptions this method requires since they find no evidence against the null regarding symmetry. It should be mentioned that Balke (2002) does indeed find results that support the asymmetry view, but since Kilian & Vigfusson uses a longer time series, the real instead of the nominal price of oil and induces one standard deviation in their impulse responses instead of Balke`s two standard deviations, Kilian & Vigfusson`s results is more robust and precise.
26 Kilian & Vigfusson (2009) further support the notion of symmetry by the use of slope-based tests. They find no support for the oil definition, but do however find some weak support for the oil price regarding asymmetric effects. However, even if there is an asymmetry in the slope coefficients, this does not necessarily mean that the impulse reaction functions are affected. In other words, it is entirely possible that using impulse response functions under symmetric assumptions gives consistent and robust results even when the data generating process is asymmetric. This point of view is supported by the tests which is
performed by Kilian & Vigfusson (2009), which find no support for asymmetric effects on the price of oil to macroeconomic variables using both and the definitions.
As with the previous asymmetric oil price definitions, the variability measure of Lee, Ni & Raati is also vulnerable to the same criticism forwarded by Kilian & Vigfusson (2009:50), due to the censoring methods applied in the definition. While an apparent weakness of the band definition (see equation 3.5) is that the values which the band consists of are seemingly
arbitrarily chosen and the researcher therefore has freedom to choose values to his own liking.
3.6 Disentangling Supply and Demand Forces in the Oil Price
“Not all oil price shocks are alike”, Kilian, L. (2009)
Barsky & Kilian (2004) strongly advocate that in order to analyze the effects of oil price on macroeconomic variables it is crucial to search for the reasons for why the oil price changes. This is important firstly, as Barsky & Kilian (2004) points to the plausible fact of potential feedback effects between the oil price and macroeconomic variables. That is, the oil price could influence macro variables and macro variables could influence the oil price. This means that the exogenous oil price increases assumed in much of the literature is not valid. It should be mentioned that this insight is mostly relevant for studies on big economies such as the US since smaller economies would hardly have a plausible impact on oil prices.
27 Secondly, thedemand and supply conditions in the oil market are very closely related to the oil price development. This is an important issue, since it is reasonable to expect macro variables to react differently on whether oil price changes due to a supply or demand shock. The intuition is as follows, if the oil price increases due to a demand shock this would imply higher input prices for the economy and all else equal this would have a negative effect. But since the price increases due to higher economic activity, it is possible that the ripple effect from higher economic activity entirely or at least partly outweighs the negative oil price effect. However if the oil prices increase due to a reduction in supply this would intuitively lead to negative consequences for the economy, since all else equal this would lead to higher prices and no positive demand effect except for oil-exporters. Lippi & Nobili (2009) supports Kilian`s notion of disentangling the oil price is vital in order to be able to predict the US business cycles under oil price shocks. Blanchard & Gali (2007) also mentioned the
underlying reasons for price changes as a possible reason for the structural change previously discussed. They do however not include this quantitatively in their analysis as their
identification does not incorporate supply or demand effects on the price of oil.
Another possible caveat in previous research can be the implicit assumption that macro variables could not predict oil price changes (Hamilton, 1983) and that exogenous events (wars, political turmoil) explained most of the observed oil price spikes. Barsky & Kilian (2002, 2004) and Kilian (2008b) argue that the oil supply shocks are less important for explaining oil price movement than previously thought. Although important in the 1970s the supply effect has diminished and is only of importance on a limited amount of time periods. This has implications for previous research since exogenous oil supply shocks have been extensively used as a basis for identification of the VAR specifications. Instead it is the aggregate and precautionary demand which can explain most of the variations in the oil price after the 1970s oil price shocks. This is further supported by Baumaister & Peersman (2008).
28 3.7 Findings of Disentangled Oil Price Shocks Research
Kilian (2009) finds results that are in line with the intuition above. Oil price shocks which stem from oil supply disruptions have a negative effect on US GDP, while shocks from increased aggregate demand have no initial effect on US GDP, but becomes negative and significant after three years. Oil market-specific demand decreases US GDP, but is not significant until three years of the induced shock. Kilian`s results therefore provides an explanation of why earlier regressions on oil prices have proven unstable since those studies did not incorporate the underlying reasons for the price changes.
Peersman & Van Robays (2009a) supports the findings of Kilian that the disentanglement of the oil price is necessary in their analysis of the Euro members.1 Although there are
similarities between the Euro and US response to oil price shocks, some deviations are significant. The first difference is the speed of transmission from an oil supply shock to both inflation and output, where the Euro response is more sluggish (Peersman & Van Robays, 2009a). During an oil-specific demand shock there is loosening monetary response in the US, while the Euro area shows no reaction. Peersman & Van Robays (2009a) argue that labor market dynamics and monetary policy transmission mechanisms are the source of the differing responses. As trade unions are stronger in the Euro area than in the US, a higher elasticity of labor supply is assumed to prevent loss of purchasing power for the Euro worker. They also find that the income and precautionary savings effects are probably not relevant in the Euro area. Lastly, there are also asymmetric responses between the individual Euro members which is attributed to differences in wage rigidity and thereby inflation between the Euro members, while sharing the same monetary policy.
Using a slightly different SVAR approach, where sign restrictions are utilized and allowing simultaneous effects from the US economy to the oil price, Lippi & Nobili (2009) supports the notion oil price disentanglement. More specifically their findings was that oil supply shock causes negative changes in the US economy as Kilian`s (2009) paper predicted. While Kilian (2009) predicted a delayed negative effect on the US GDP during a demand shock, Lippi & Nobili (2009) actually predicts a positive response of the GPD in these conditions.
29 They base this finding on a low elasticity of substitution between US and “rest of the
industrial world” goods. That is, higher demand abroad also increases the consumption of US goods.
Not many studies have included both net oil-exporters and at the same time disentangle the causes of oil price changes, but Berument, Ceylan & Dogan (2010) is the exception. They study the effect of oil price shocks in selected MENA countries1, including both net oil importers and exporters and supports Kilian`s (2009) findings. For importers they find that output decreases when it is a supply shock which is causing the oil price increase, while output increases if there is an oil price increase due to aggregate demand. The net oil-exporting countries experience a growing output regardless of the underlying shock causing price changes. A comparative analysis of Berument et al. (2010) results with this thesis will be interesting due to the differences in economic development between Norway and the various MENA oil-exporters.
Sørensen (2010) utilizes a SVAR methodology when analyzing the oil and the Norwegian economy while also considering the underlying reason for the oil price changes. Sørensen (2010) does however only partly include an oil supply variable in his analysis. He is also only focusing on financial performance and thereby Oslo Stock Exchange is the only Norwegian macroeconomic variable included. Sørensen (2010) finds that the financial markets of Norway and Canada react positively to both oil-specific and global demand shocks.
1
Exporters: Algeria, Iran, Iraq, Kuwait, Libya, Oman, Qatar, Syria, United Arab Emirates. Importers: Bahrain, Djibouti, Egypt, Israel, Jordan, Morocco and Tunisia.
30
4.0 Methodology
4.1 VAR and SVARThe VAR methodology was introduced by Sims in 1980 and represented an alternative to the Cowles Commission econometric techniques widely used during that time. A VAR model is essentially an ordinary regression model which provides a multivariate framework where changes in a particular variable are related to changes in its own lags and to changes in other variables and their lags. The VAR treats all variables as jointly endogenous and does not impose any restrictions on structural relationships. Since the VAR expresses the dependent variables in terms of predetermined lagged variables it is called a reduced form model. Analytically the VAR can be represented as:
(4.1)
Where is a vector of endogenous variables, is a vector of exogenous variables, and are coefficient matrices while is the lag length and represents an innovation process which is an unobservable zero-mean white noise process with a time invariant positive definite variance-covariance matrix.
The order of which variables enter the VAR is called the Cholesky ordering. The Cholesky ordering is important since the innovations calculated are dependent on the Cholesky decomposition. The ordering should therefore reflect the degree of how exogenous the variables are relative to other variables in the model. In other words, a variable which is not influenced by the development of other variables should be ranked first, while a variable which is considered to be highly dependent on other included variables should be designated a lower position. Note that in a VAR it is only in the Cholesky ordering a priori knowledge is used. It is also a general accepted that additional lags improve the stability of VAR results to changes in the Cholesky ordering.
The difference from a VAR model is that a SVAR model imposes restrictions on the included variables. As such the SVAR is an alternative to the Cholesky recursive orthogonalization