Computational Discovery of Solid Electrolytes for Batteries: Interfacial Phenomena and Ion Mobility
by
Kwangnam Kim
A dissertation submitted in partial fulfillment of the requirements for the degree of
Doctor of Philosophy (Mechanical Engineering) in the University of Michigan
2020
Doctoral Committee:
Professor Donald J. Siegel, Chair Professor Wei Lu
Associate Professor Jeff Sakamoto Assistant Professor Liang Qi
Kwangnam Kim [email protected] ORCID iD: 0000-0003-1149-1733 © Kwangnam Kim 2020
Dedication
Acknowledgements
First of all, I would like to express my sincere gratitude to my advisor Professor Donald J. Siegel for his guidance, patience, and support. He has always welcomed and encouraged me whenever I encountered difficulties during research. His great mentorship enables me to keep moving forward step by step; without which I could not accomplish my PhD work. Also, I am very grateful to my committee members, Professors Wei Lu, Jeff Sakamoto, and Liang Qi, who provided incredibly valuable comments and generous service to my dissertation.
I would like to thank all my colleagues in the Energy Storage and Materials Science (ESMS) Lab. Their precious knowledge and experience gave me insights to make breakthroughs. I would like to give special thanks to Dr. Seungho Yu, who provided academic help for me for more than 10 years, not only for my MS in Korea but also for applying to graduate school and PhD study at the University of Michigan. Also, I thank all Korean friends who enjoyed the Ann Arbor life with me. Especially, I would like to express my great thanks to Dr. Taehoon Han who has been willing to be my mental mentor at the hardest times and Dr. Jeongyong Choi and his family for being my family’s best friends.
I am grateful for financial support from the Joint Center for Energy Storage Research (JCESR), an Energy Innovation Hub funded by the U.S. Department of Energy, Office of Science, and Basic Energy Sciences. It was a great opportunity to work with JCESR collaborators from various institutes with different backgrounds.
Most of all, I would like to express my deepest gratitude and admiration to my parents for their endless support and encouragement. Also, I would like to express my infinite thankfulness to my wife Boram; I am greatly indebted to her extreme support and countless sacrifices throughout my entire PhD process. Finally, thank you Selena and Lucia for your smiles.
Table of Contents
Dedication ... ii
Acknowledgements ... iii
List of Tables ... vii
List of Figures ... ix
Abstract ... xiii
Chapter 1 Introduction ... 1
1.1 Motivation ... 1
1.2 Solid Electrolytes for Performance Improvements ... 2
1.3 Challenges in Solid Electrolytes ... 2
1.3.1 Ion Mobility in Solids ... 3
1.3.2 Interfacial Properties ... 3
1.4 Anti-perovskite Compounds ... 5
1.5 Goals and Scope of Dissertation ... 7
Chapter 2 Methodology ... 9
2.1 First-principles Calculations ... 9
2.1.1 Many-body Problem ... 9
2.1.2 Non-interacting Electron Approximation ... 10
2.1.3 Density Functional Theory ... 11
2.1.4 Exchange-Correlation Functional ... 13
2.1.5 Quasi-particle GW method ... 14
2.2 Phonons and Thermodynamics ... 15
2.2.2 Vibrational Free Energy ... 16
2.2.3 Quasi-harmonic Approximation ... 17
Chapter 3 Predicting Wettability and the Electrochemical Window of Lithium-Metal/Solid Electrolyte Interfaces ... 18
3.1 Introduction ... 18
3.2 Methodology ... 19
3.2.1 First-principles Calculations ... 19
3.2.2 Band Edge Positions ... 20
3.2.3 Gibbs Free Energy ... 21
3.3 Results and Discussion ... 23
3.3.1 Bulk Li3OCl ... 23
3.3.2 Li3OCl Surface Modeling ... 25
3.3.3 Li/Li3OCl Interfaces ... 27
3.4 Conclusions ... 37
Chapter 4 Correlating Lattice Distortions, Ion Migration Barriers, and Stability in Solid Electrolytes ... 38
4.1 Introduction ... 38
4.2 Methodology ... 41
4.2.1 First-principles Calculations ... 41
4.2.2 Thermodynamic Properties ... 43
4.3 Results and Discussion ... 46
4.3.1 Structure ... 46
4.3.2 Ion Transport ... 48
4.3.3 Thermodynamic Stability ... 54
4.3.4 Mechanisms for Increasing Mobility ... 60
4.3.5 Characterizing Difference in Mobilities between Alkali Ions ... 62
4.4 Conclusions ... 67
Chapter 5 Evaluating Descriptors for Ion Mobility in Solids via Machine Learning ... 69
5.1 Introduction ... 69
5.2 Methodology ... 70
5.2.2 Model Selection ... 72
5.2.3 Feature Subset Evaluation ... 74
5.2.4 Feature Importance and Influence on Barriers ... 74
5.3 Results and Discussion ... 75
5.3.1 Data for Analysis ... 75
5.3.2 Implementation of Machine Learning ... 78
5.3.3 Interpretation of Results ... 82
5.4 Conclusions ... 87
Chapter 6 Potential Solid Electrolytes for Multivalent Ions Based on the Anti-perovskite Structure ... 89
6.1 Introduction ... 89
6.2 Methodology ... 90
6.2.1 First-principles Calculations ... 90
6.2.2 Defect Formation Energy ... 92
6.2.3 Thermodynamic Stability ... 92
6.3 Results and Discussion ... 93
6.3.1 Structure ... 93
6.3.2 Properties ... 94
6.3.3 Potential Multivalent Anti-perovskites for Solid Electrolytes ... 99
6.4 Conclusions ... 100
Chapter 7 Conclusions and Next Steps ... 102
List of Tables
Table 3.1 Calculated band gaps (in eV) for LOC as a function of the calculation method. Two different exchange-correlation functionals – GGA-PBE and HSE06 – were used to generate the input wavefunctions used in the GW calculations. ... 23
Table 3.2 Calculated Li/LOC interface formation energy, strain energy, and interface energy as a function of interface composition at ambient conditions and at conditions that mimic the temperature and pressure used during synthesis of LOC. ... 30
Table 3.3 Calculated work of adhesion and contact angle as a function of interface composition for the Li/LOC interface. ... 31
Table 4.1 Predicted bulk and shear moduli of anti-perovskite compounds using the Voigt equations. Values in parentheses are the bulk moduli using the Murnaghan EOS. ... 45
Table 4.2 Calculated limiting barriers (meV) along preferred pathways for vacancy/dumbbell migrations. The tolerance factor (t) and Group are also given for each compound. ... 47
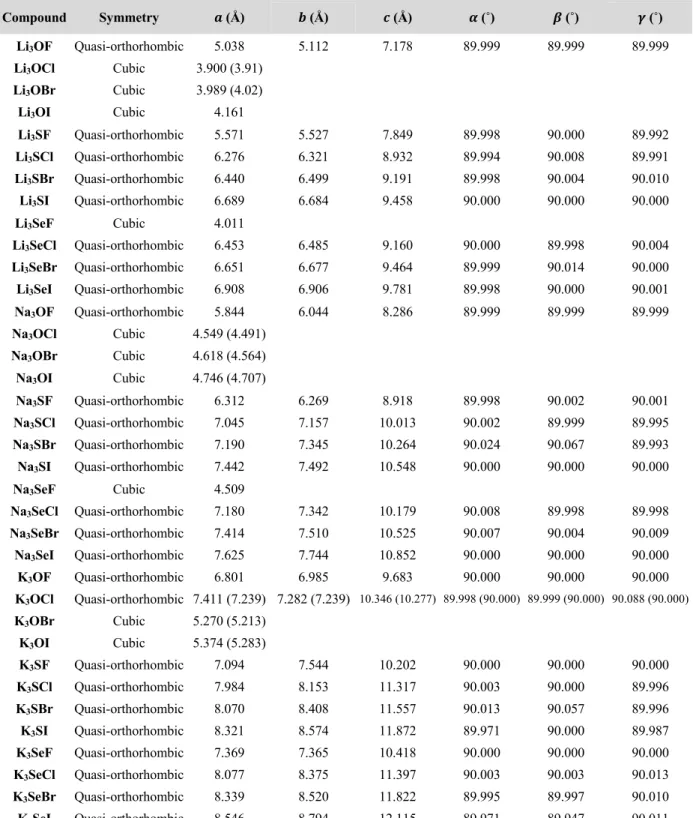
Table 4.3 Structural parameters for the anti-perovskites X3AB (X = Li, Na or K, A = O, S or Se
and B = F, Cl, Br or I). Values in parentheses represent previous experiment data.64,65,181–183 .... 49 Table 4.4 Calculated decomposition energies, Ed, of the APs at zero Kelvin. Positive values imply
that decomposition into a mixture of chalcogenide and halide is favored. Values in parentheses represent previous DFT predictions.56 ... 55 Table 4.5 Predicted stabilization and melting temperatures of AP compounds (Ts and Tm,
respectively). Values in parentheses are melting temperatures of corresponding alkali chalcogenide and halide, respectively.303 Values in italics indicate the stabilization temperatures are guaranteed
as its upper limit of actual values. Values with asterisk are experimental melting temperatures of existing APs.64,65 Na
3OB and K3OB (B = Cl, Br, I) are stable at zero Kelvin. See main discussions
regarding stabilization temperatures of Li3OB (B = Br, I). ... 56 Table 5.1 List of descriptors (abbreviations in parentheses) and its category. ‘Filter’ reduces the redundant descriptors denoted in the table (e.g., Vocta was reduced into Va). ... 76 Table 6.1Tolerance factor (t), structure symmetry, and lattice parameters of Mg and Ca APs. Values in parentheses are experiment data.293,294 ... 93
Table 6.2 Summary of predicted properties of Mg and Ca AP compounds. Bulk modulus in parentheses is a value predicted by the Murnaghan EOS fitting. ... 96
Table 6.3 Formation energies of six different defects in Mg and Ca APs (also Li3OCl for
comparison). Values marked by an asterisk indicate the defect with the smallest formation energy for an AP. ... 97
List of Figures
Figure 1.1 Energy levels of a SE with respect to the density of states, N(E), of the electrodes. Red and blue bands represent the conduction and valence bands of the SE, respectively. The electrolyte is susceptible to reduction by the anode when the electrochemical potential of the anode, µA, is
located at a higher energy than the conduction band minimum, CBM, of the SE. Similarly, oxidation of the SE can occur when the energy of the valence band maximum, VBM, is higher than the electrochemical potential of the cathode, µC. The open circuit voltage (VOC), ionization
potential (IP), and electron affinity (EA) are also shown. ... 4
Figure 1.2 Unit cell of anti-perovskite Li3OCl in the cubic Pm-3m structure. Cl ions form the cubic
framework and enclose Li6O octahedron. ... 5 Figure 1.3 Migration mechanisms for (a) vacancies and (b) interstitial dumbbells. ... 6
Figure 3.1 Determination of the absolute band edge positions of a solid electrolyte. The method is based on aligning the reference potentials Vref of the slab (s), bulk (b), and interface (i) systems.
... 20
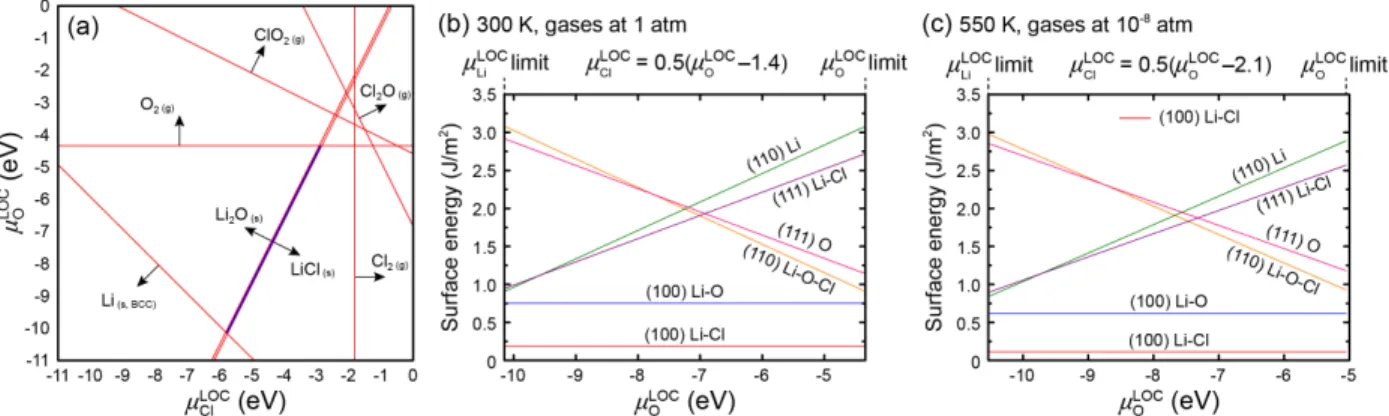
Figure 3.2 (a) Stability of bulk LOC at 300 K and 1 atm as a function of the chemical potentials of oxygen (µOLOC) and chlorine (µClLOC) in LOC. The thin blue region indicates the combination
of chemical potentials that satisfy the thermodynamic constraints in the equation (3.12), resulting in the stability of LOC. Outside of this region LOC is expected to decompose into other phases; red lines and arrows indicate boundaries in chemical potential space where other phases are predicted to form. (b-c) Calculated surface energies of LOC as a function of chemical potential of oxygen at 300 K and 1 atm [panel (b), STP] and at 550 K and 10-8 atm [panel (c), comparable to
the synthesis conditions of LOC]. In the surface energy plots the chemical potentials µClLOC and
µOLOC are related by the equation (3.12), and are restricted to the range determined in panel (a) for
which LOC is stable with respect to decomposition. ... 25
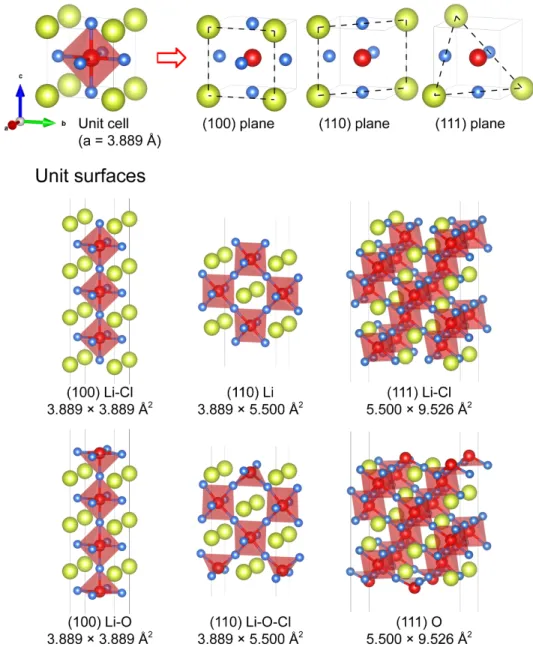
Figure 3.3 (Top) Cleavage planes used to construct Li3OCl surfaces. Each plane has two possible
surface terminations. (Bottom) Configurations of the elementary surface slab models. The name of surface consists of its cleavage plane and terminating species, e.g., the surface (100) Li-Cl is cleaved along the (100) plane and is terminated by a plane containing Li and Cl ions. Surface area
is also shown. Truncation of the Li6O octahedra occurs when O ions are exposed on the surface
(bottom three slabs). ... 26
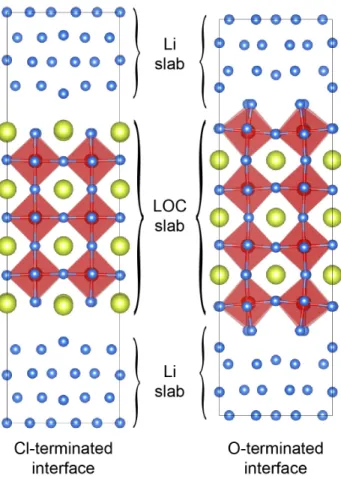
Figure 3.4 Relaxed structure of Cl- and O-terminated interfaces, which consist of 7 layers of LOC (100) and BCC-Li (100) planes (103 and 107 atoms, respectively). The O-terminated interface is shorter in height than the Cl-terminated interface due to shorter interlayer distance. A weak interaction is found at the Cl-terminated interface, whereas O ions strongly attract Li-metal atoms and form octahedron to make up for the missing part at the O-terminated interface. ... 29
Figure 3.5 Charge density isosurfaces for the VBM (left) and CBM (right) of the O-terminated Li/LOC interface. Li atoms are blue, oxygen is red, and chlorine is yellow. ... 33
Figure 3.6 Electrochemical window bulk LOC and for Li/LOC interfaces. Both Cl- and O-terminated interfaces are investigated. Red and blue bands indicate the positions of the CBM and VBM, respectively. Numbers in parenthesis indicate the amount (in eV) by which the band edges shift (with respect to the bulk positions) at an interface with Li metal. The Li/Li+ level and
corresponding presumed 4.5 V cathode level are also shown (fading area). An energy of zero is assigned to the vacuum level, and the Li/Li+ level is located 1.4 eV below the vacuum level.156
The electrochemical potential for a hypothetical 4.5 V (relative to Li/Li+) cathode is also plotted.
... 34
Figure 4.1 Classification scheme for Li- and Na-based AP SEs based on their degree of lattice distortion. Compounds in Group 1 have a high tolerance factor, exhibit highly ordered octahedra, and adopt the cubic Pm-3m structure. Groups 2 and 3 have quasi-orthorhombic structures, and are characterized by successively smaller tolerance factors and increasingly larger distortions to the Li/Na-octahedra. Three representative structures (Li3OBr, Li3SI, and Li3SeCl) illustrate the
increasing degree of distortion from Group 1 to Group 3. ... 40
Figure 4.2 Connectivity between octahedra in distorted APs. Atomic sites of mobile ions are numbered; identical sites in different octahedra adopt the same number. (Selected shared vertex sites are indicated with an equals sign.) Arrows illustrate an example of a migration pathway resulting in long-range ion transport. ... 50
Figure 4.3 Correlation between the tolerance factor and limiting barriers of (a) vacancy and (b) dumbbell mechanisms. The linear fitting is implemented excluding the ‘F-centered’ compounds (unfilled shapes). ... 52
Figure 4.4 Dispersion of elementary migration barriers as a function of the tolerance factor. The lattice distortion breaks the degeneracy between elementary barriers, resulting in a wider distribution with greater distortions. The smallest barriers become lower linearly while the largest barriers increase exponentially with smaller tolerance factor. The preferred pathway can be established by connecting low elementary barriers. ‘F-centered’ compounds are not included. . 53
Figure 4.5 Correlation between the tolerance factor and the energy relative to convex hull (equivalent to the decomposition energy) of APs. The linear fitting is implemented excluding ‘F-centered’ compounds (unfilled shapes). ... 55
Figure 4.6 Stabilization temperatures of AP compounds as a function of the decomposition energy at zero Kelvin. Unfilled shapes denote ‘F-centered’ compounds. The dashed curve is a guide. . 57
Figure 4.7 Correlation between the tolerance factor and the stabilization temperature of APs. The linear fitting is implemented excluding ‘F-centered’ compounds (unfilled shapes) and also compounds stable at zero Kelvin. ... 57
Figure 4.8 Chemical stability window of AP compounds. All APs are stable against metal anode without applied potential. Values on bars are viable voltages as SEs. ... 58
Figure 4.9 Comparison between the stabilization temperature and the limiting barrier of APs for (a) vacancy and (b) dumbbell mechanisms. APs suggested as promising SEs are labelled. Unfilled shapes denote ‘F-centered’ compounds. ... 59
Figure 4.10 Cartoon depicting the effects of lattice distortions on the energy barrier for ion migration in APs. Grey dashed curve: energy profile for migration in an undistorted system. Blue dashed curve: energy profile for a system with reduced thermodynamic stability arising from lattice distortions. Red curve: profile accounting for the combined effects of reduced stability and widening of the migration pathway. ... 60
Figure 4.11 Correlation between path width and elementary barrier energies for vacancy migration in the distorted (a-h) lithium and (i-p) sodium APs. r values represent Pearson correlation coefficients. ... 61
Figure 4.12 Comparison of (a) limiting barriers of vacancy and dumbbell, (b) packing fractions with and without cation, and (c) LEO frequencies between Li, Na, and K APs with the same anions. ... 63
Figure 4.13 Comparison of (a-c) polarizabilities and (d-e) Bader charges between Li, Na, and K AP with the same anions. ... 65
Figure 5.1 Entire process to find useful features to describe ion migration barriers. 7 redundant features were reduced by the filtering, and the rest 38 features were used to optimize ML algorithms and select the best model. The most predictable feature subset was found by the wrapper method which iteratively evaluates different feature subsets. ... 71
Figure 5.2 Pearson correlation analysis among descriptors and vacancy elementary barriers. +1/-1 value indicates perfect positive/negative linear correlation, whereas no correlation is expected when the coefficient is close to 0. ... 79
Figure 5.3 Comparison between ML models optimized with 38 features after filtering: (a) vacancy and (b) interstitial dumbbell mechanisms. The test set is used to obtain RMSEs. A red bar indicates the best model. ... 80
Figure 5.4 Training results of the ‘adaboost + ERTR’ model with 38 features after filtering using the training data set of (a) vacancy and (b) dumbbell mechanisms. The performance of the model is presented by predicting the test data set of (c) vacancy and (d) dumbbell mechanisms. The black line is a guideline for the perfect prediction. ... 81
Figure 5.5 Comparison between the ‘adaboost + ERTR’ models with different numbers of features: (a) vacancy and (b) interstitial dumbbell mechanisms. Each bar represents the lowest RMSE with a certain number of features. The red bar indicates the optimal number of features.82
Figure 5.6 Performance of the ‘adaboost + ERTR’ model by predicting the test data set with the best feature set: (a) vacancy (8-feature subset) and (b) dumbbell (5-feature subset) mechanisms. The black line is a guideline for the perfect prediction. ... 83
Figure 5.7 Most predictive features and their relative importance (in percentage): (a) vacancy and (b) interstitial dumbbell mechanisms. The importance was evaluated by the mean decrease impurity method. ... 84
Figure 5.8 ICE plots of top three features for vacancy: (a) path distance, (b) path width by the first closest ion, and (c) total path width. The center curve (yellow) shows the trend of migration barrier with the increase in the feature (i.e., from left to the right). Mean and standard deviation (𝜎) of features are denoted in parentheses in x-axis. ... 85
Figure 6.1 Ternary phase diagrams including (a-d) Mg and (e-j) Ca APs. ... 95
Figure 6.2 Dispersion of elementary migration barriers as a function of the tolerance factor (t) for vacancy and interstitial dumbbell migration mechanisms. APs in the area of limited distortions have a distinct energy barrier, equivalent to the limiting barrier. The spectrum of barriers appears with lattice distortions, and an unfilled shape denotes the position of limiting barrier in the spectrum. Black solid line and curve are guides for linear decrease and exponential increase in barriers with smaller tolerance factor. ... 96
Figure 6.3 Chemical stability window of Mg and Ca APs. All compounds except Ca3AsSb are
stable against metal anode without applied potential. The oxidation limit in the right-end of window is the highest viable voltage without interface treatments. ... 98
Abstract
Solid-state batteries (SSBs) using a solid electrolyte (SE) and Li-metal anode are promising technologies that can increase energy density and minimize safety concerns for applications such as electric vehicles. Although the recent discovery of SEs with high ionic conductivity has advanced the prospects for realizing SSBs, additional study of these materials has unearthed several shortcomings (e.g., interfacial degradation). Thus, the discovery of alternative SE remains an important pursuit. This search has been slowed, however, by incomplete understanding of the elementary features that give rise to high ionic mobility and promote interfacial stability.
In response, this dissertation focuses on several topics that are relevant for the advancement of SSBs: (1) stability and wettability at interfaces between a SE and metal anode, (2) fundamental understanding of ionic transport mechanisms in solids, and (3) the discovery of new SEs. These topics are investigated using first-principles calculations. Anti-perovskites (AP) are adopted as model SEs because they have shown promise for achieving high ionic conductivities while possessing simple structures that enable a comprehensive characterization of their properties. In addition, machine learning (ML) is employed to analyze trends in the computed data.
Investigation of the Li3OCl/Li interface shows that an oxygen-terminated interface is the
most stable. This interface exhibits strong interfacial bonds, suggesting good wettability by Li, low interfacial resistance, and potential for Li dendrite prevention. However, this strong interaction also locally shifts the electronic band edge positions, narrowing the bandgap by 30%. Nevertheless, the conduction band minimum remains more negative than the Li/Li+ potential,
implying stability against charge injection from the anode. These calculations indicate a tradeoff between strong interfacial bonding/wettability and electrochemical stability.
Next, the connections between ion mobility, thermodynamic stability, and symmetry-lowering lattice distortions are characterized across 36 model APs. Compounds with larger lattice distortions exhibit smaller percolating migration barriers because these distortions speed up
migration along a subset of pathways. As larger distortions also correlate with reduced stability, realizing high ionic mobility requires balancing a mobility/stability tradeoff. Li3SeF, Na3SeF,
Na3SBr, Na3SF, K3SeF, and K3SBr are identified as new compositions that balance this tradeoff.
Differences in ion mobilities across Li, Na, and K based APs is rationalized in terms of differences in ion packing, vibrational frequency, polarizability, and ionic charge.
Next, using data generated for alkali metal-based APs, ML is used to identify elementary features that correlate with ionic mobility. Lattice structure was found to have a greater influence in ion transport than do features based on chemical or electronic properties. For vacancy migration, the migration distance and bottleneck-size are the most important features: migration barriers decrease with shorter hops and with wider migration channels. Therefore, tuning the structure of a SE is the most effective scheme to improve ion mobility in these compounds.
Finally, potential multivalent MV-ion SEs based on the AP structure are examined. SEs with compositions Mg3NAs, Ca3NAs, and Ca3PSb are identified as the most promising. These
compounds are predicted to be thermodynamically stable, electronically insulating, stable in contact with metal anodes, and to have relatively low percolating barriers for ion migration. Due to their high formation energies, ionic defects should be introduced artificially.
In total, this study enhances understanding of interfacial phenomena and ion transport in solid electrolytes, while also suggesting new materials. The ultimate goal is to accelerate the introduction of SSBs with improved safety and energy density.
Chapter 1 Introduction
1.1 Motivation
Since the Industrial Revolution, the dramatic increase in the use of fossil fuels has been significantly increasing the CO2 emission, resulting in the global warming and climate change.1
The high demand for environmentally friendly renewable energy sources leads to the increasing interest in technologies like wind, solar, tidal, and geothermal energies.2 However, these
technologies have limitations associated with their variable output in time as well as location; thus, energy storage has emerged as a technology that can enable their widespread adoption.3
Batteries are one of the most promising energy storage technologies due to their high conversion efficiency and essentially zero emissions.3 Li-ion batteries (LIBs) have high energy
densities and voltages, which lead to their wide use in portable electronic devices.3,4 Na and K-ion
batteries (NIBs and KIBs) are being explored for grid energy storage due to the abundance and low price of Na and K.4–6 Although at the very early stage of development, multivalent (MV) ions
Be, Mg, Ca, Zn, and Al have potential to increase the volumetric capacity of batteries.7
Nevertheless, additional improvements in battery technologies are highly desirable – especially related to cost, safety, energy density, and life cycle – to enable widespread application to emerging applications such as electric vehicles.3 The increase in energy density is required for
longer-lasting batteries. The longest driving range among commercial electric vehicles is 390 miles of Tesla Model S with the starting price of $80,000 in early 2020, but Jaguar XF (2.0L diesel engine) can drive up to 731 miles with the price of $52,500 in 2019.8,9 Comparing different models
of Ford 2018 Focus, the driving range and price of an electric version is 115 miles and $29,120, whereas cheaper ‘SE Hatch’ model ($20,540) can drive up to 471 miles.10 Enhanced safety is also
one of the most sought-after performance improvements LIBs for reliable operations. There have been several explosion and fires from batteries of electric devices and vehicles, including a case
1.2 Solid Electrolytes for Performance Improvements
Safety concerns in commercial LIBs can originate from the use of liquid electrolytes. These electrolytes have high ionic conductivity, yet are volatile and flammable; moreover, they are amenable to dendrite formation, resulting in internal short-circuiting.3,12,13 Thus, improvements in
cell designs and/or materials that address these safety concerns are desirable. In principle, the use of a solid electrolyte (SE) can circumvent these problems.3,14–16 SEs are less flammable,
non-volatile, and less-sensitive to changes in temperature.3,16,17 Also, the high stiffness exhibited by
some SEs has been projected to suppress dendrite formation.14 This latter benefit presents the
possibility to significantly increase the capacity of the negative electrode by substituting metallic lithium for lithiated carbon.18 The advantages of SEs may lead to the realization of solid-state
Li-metal batteries that are longer-lasting and safer than existing LIBs.
1.3 Challenges in Solid Electrolytes
Electrolytes for batteries are required to have high ionic conductivities at least 10-4 S/cm.3
Historically, the ionic conductivity of solids has been insufficient to supplant liquid electrolytes. Very recently, however, a small-but-growing number of solids with ionic conductivities comparable to that of liquids have been identified, including garnet Li7La3Zr2O12,19 argyrodite
Li6PS5Br,20 LISICON-like Li10GeP2S12 and Li9.54Si1.74P1.44S11.7Cl0.3,21,22 LiPON Li2.9PO3.3N0.46,23
LPS glass 75Li2S•25P2S5,24 NASICON-like Li1.3Al0.3Ti1.7(PO4)3,25 perovskite Li0.34La0.51TiO2.94,26
NASICON Na3Zr2Si2PO12,27 glass-ceramic Na3PS4,28 Na sulfides Na10SnP2S12
and Na11Sn2PS12,29,30 complex hydrides Na2(BH4)(NH2), LiCB11H12, and NaCB11H12,31,32 and beta
alumina (𝛽"-Al2O3) conducting numerous cations like Na, Ag, K, Li, and Rb. The discovery of
these fast ion conductors has advanced the prospects for realizing solid-state batteries (SSBs).13,33
Nevertheless, subsequent investigations on these SE have shown that a high ionic conductivity alone is insufficient for realizing a viable solid-state cell. These materials, in essentially all cases, are not stable with electrode materials, have very low viable voltages, and/or show dendrite penetrations.34–37 Therefore, the discovery of alternative SE remains an important pursuit. The
discovery of new SEs, however, has been slowed due to a lack of fundamental understanding of fast ion transport in solids. Current SEs have mostly been discovered by trial-and-error Edisonian
approaches. Thus, it is desirable to understand important features that describe a high ion mobility in solids for the systematic design of SEs.
1.3.1 Ion Mobility in Solids
A fundamental question in the identification of new SEs is ‘what chemical, mechanical, and/or structural features promote high ion mobility?’38–41 Recent studies suggested several
features that may have effects on the ion transport.38,40,42–46 Lower phonon frequencies enhances
the phonon amplitude and assist the jump of mobile ions.42 Also, fast Li conductors have low Li
vibration frequencies.43 Increasing polarizability of halide anion (from Cl to I in Group 17) softens
the lattice, resulting in lower activation energy of ion migration (argyrodite system as an example).44 The migration barrier is influenced by the preferred insertion site and the anion
coordination preference of cations in intercalation host structures; for example, barriers can increase when a cation has a preferred anion coordination at a preferred insertion site.45 Low
energy barriers can be achieved by adopting the bcc framework because it allows a direct hopping between tetrahedral sites.38 Also, larger volume per anion can decrease the energy barrier.38,40,46
Although previous literature has been improving our understanding of ion transport in solids, individual studies do not explicitly explain the relative importance between features. It is also probable that some important properties might be veiled so far. Therefore, a comprehensive analysis is required to establish the design principles for fast ion-conducting solids. This is a challenging goal because it is believed that several features are entangled and affect to ionic motions simultaneously.47
1.3.2 Interfacial Properties
Interfacial interactions of SEs with electrodes are critical for battery performance and life time.47 Two examples of important interfacial properties involving SE are stability3,34,48–50 and
wettability.51–53 Insufficient interfacial stability manifests though the formation of new phases
(from reactions between the SE and electrode, or through decomposition of the SE itself) or through electron transfer between the electrode and SE. Both processes can yield undesirable outcomes. In the former case, the product phases can limit Li-ion mobility and thus increase interfacial resistance.48,49 In the latter mechanism, electron transfer to/from the SE can precipitate
additional chemical reactions or impart undesirable electrical conductivity to the SE: for example, reduction of a SE by the negative electrode can inject electrons into the conduction band.54,55
Figure 1.1 presents an energy level diagram for a SE and the electrodes in a battery.3,54 To
minimize electron transfer to/from a SE, the anode electrochemical potential, 𝜇A, should be located below (i.e., at a lower energy than) the conduction band minimum (CBM) of the SE, while the electrochemical potential of the cathode, 𝜇C, should be at a higher energy than the SE’s valence band maximum (VBM). Prior studies have demonstrated that these levels can be predicted computationally for an interface-free (i.e., bulk) SE, providing an estimate of a SE’s susceptibility to undesirable electron transfer.46,55,56 Nevertheless, the electrochemical window of an electrolyte
can be influenced by interfacial interactions with the electrodes. For example, a previous report revealed that the highest occupied molecular orbital (HOMO) and lowest unoccupied molecular orbital (LUMO) levels of electrolyte solvent molecules shift due to interactions with electrode surfaces, narrowing the electrochemical window relative to that of the isolated molecules.54 To the
best of our knowledge, the impact of interface interactions on the CBM/VBM positions of a SE have not been reported.
Figure 1.1 Energy levels of a SE with respect to the density of states, N(E), of the electrodes. Red and blue bands represent the conduction and valence bands of the SE, respectively. The electrolyte is susceptible to reduction by the anode when the electrochemical potential of the anode, µA, is located at a higher energy than the conduction band
minimum, CBM, of the SE. Similarly, oxidation of the SE can occur when the energy of the valence band maximum, VBM, is higher than the electrochemical potential of the cathode, µC. The open circuit voltage (VOC), ionization
Regarding interfacial bonding, recent studies have identified the wettability of a SE by Li metal as a key factor in predicting performance.57,58 Low wettability results in poor contact
between Li and a SE, resulting in current focusing, high interfacial resistance, and/or dendrite formation.51,52,59–61 For Li
7La3Zr2O12, improved wetting by Li can be achieved through interface
coatings51,59,62,63 or surface cleaning treatments.53,60 Despite the importance of wettability to SE
performance, few computational studies of wettability have been reported.53
1.4 Anti-perovskite Compounds
The anti-perovskite (AP) system was recently suggested as SE.64,65 APs adopt the
well-known structure of the perovskites, but interchange the positions of the anions and cations. APs of interest for SEs adopt the formula X3AB, where X is a monovalent cation and A and B are anions
with respective charges of 2- and 1-. The AP crystal structure consists of vertex-sharing X6A
octahedra (A anion at the octahedron center) enclosed by a cubic framework with B anions at vertices of cubic (space group 221; Pm-3m), so A and B form a bcc framework and X are at the center of the cubic face. APs have high alkali-ion contents and large band gaps as well as high ionic conductivities. Included in these candidates is the so-called ‘Li-rich’ AP, Li3OCl (LOC,
Figure 1.2), which exhibits a high ionic conductivity of ~10-3 S/cm at room temperature and was
predicted to have a very large band gap over 6 eV.64,66 A LOC-based cell with a graphitic anode
and LiCoO2-based cathode operates at voltages up to 4.2 V.67 Also, a Li/LOC/Li symmetric cell
and SEM images show that LOC is stable and compatible with a Li-metal anode.67,68
Figure 1.2 Unit cell of anti-perovskite Li3OCl in the cubic Pm-3m structure. Cl ions form the cubic framework and
Previous studies have described two mechanisms for Li-ion transport in LOC.56,66,69–72
These include a vacancy mechanism involving Li-ion hop ing along the edges of the Li-octahedra, Figure 1.3(a),56 and hopping of a Li interstitial dumbbell, Figure 1.3(b).66 The interstitial process
has a barrier that is roughly half that of the vacancy mechanism.66 The relative importance of these
mechanisms remains a matter of debate. Mouta et al. suggested that Li vacancies are responsible for the high conductivity in pristine and divalent-metal doped LOC, owing to their higher vacancy concentration compared to Li interstitials.69 On the other hand, interstitials were predicted to
dominate in samples synthesized under LiCl-deficient conditions,70 where an elevated
concentration of oxygen substitutional defects on Cl-sites (O!"# ) is anticipated. Others have argued,
however, that the high binding energy between Li interstitials and O!"# , will hinder interstitial
hopping.71 In addition, Stegmaier et al. have proposed that Li vacancies are present in LOC near
the cathode, whereas Li interstitials dominate near the interface with the anode.72
Composition variation has been explored as a means to increase the ionic conductivity of AP SEs. For example, the mixed-halogen phase, Li3OCl0.5Br0.5, exhibits a conductivity that is
approximately twice that of LOC at room temperature.56,64 Zhao et al. proposed that this is due to
a wider channel for Li-ion migration, which was made possible by an enlarged unit cell.64
Similarly, a computational study reported that Cl–Br substitutional disorder results in a spectrum of activation barriers, with some barriers being lower than those in LOC and Li3OBr (LOB).66
Deng et al. predicted Li3OCl0.75Br0.25 to be the optimal mixed phase, with maximum ionic
conductivity.73 The sodium analogues of LOC – Na
3OCl (NOC), Na3OBr (NOB), Na3OI (NOI),
and their respective mixed-halogen phases – have also been synthesized.65 Of these, Na
3OBr0.6I0.4
was reported to have a higher conductivity than either NOC or NOB.65 Several other strategies
have also been explored to increase the ionic conductivity of the APs.65,74,83–85,75–82
Previous density functional theory calculations predicted that LOC and LOB are thermodynamically unstable at zero Kelvin, i.e., they are prone to decompose into lithium chalcogenide and halide.56,66 Following studies revealed that LOC becomes stable at elevated
temperatures around 500 K.81,86 Chen et al. suggested that vibrational entropies are contributed by
Li – Cl bonds in LOC that are softer than the bonds in LiCl.86,87 Thus, other AP compounds with
moderate instabilities might also be stabilized at elevated temperatures. Stabilized metastable phases at certain thermodynamic conditions (e.g., high temperatures or pressures) can be kinetically retained at metastable conditions.88
1.5 Goals and Scope of Dissertation
As discussed in this chapter, additional improvements in battery technologies are driven by demanding applications: the increase in energy density and enhanced safety. The development of SSBs using a SE with a metal anode will be the key to solve these problems. To address this topic, this dissertation focuses on the interfacial phenomena at interfaces between Li metal and SEs, fundamental understanding of ion transport in inorganic solid materials, and the discovery of potential compounds for monovalent and MV-ion conducting SEs for secondary batteries, using the AP lattice system. First-principles calculations and machine learning approaches were used to perform atomic-scale simulations and feature engineering.
Chapter 3 investigates the interfacial interaction at Li metal/SE interfaces using LOC as a model SE. The wettability and electrochemical stability at the interfaces were examined. Chapter 4 reveals the connections between ionic mobility, thermodynamic stability, and symmetry-lowering lattice distortions across a series of 36 model APs, and suggests potential Li, Na, and K-ion conducting AP SEs. Descriptors that characterize the difference in mobilities between Li, Na, and K ions in solids will also be discussed. Chapter 5 delves deeper into systematic understanding of chemical, physical, and structural features that describe the ion transport in solids. Machine learning (ML) approaches will be used with a large number of ion-migration data to find effective
features, their relative importance, and how they promote a high ion mobility. Finally, Chapter 6 explores MV-ion containing APs and suggests possible compounds for SEs of MV-ion SSBs.
In total, this study aims to improve our understanding of interfacial phenomena and ion transport in solids, while also suggesting new candidate SEs for SSBs. The ultimate goal is to accelerate the design of optimal SEs for use in safe and long-lasting SSBs.
Chapter 2 Methodology
2.1 First-principles Calculations 2.1.1 Many-body Problem
The Schrödinger equation is the wave equation that describes the quantum-mechanical behaviors of quantized particles given by89
𝑖ℏ𝑑Ψ
𝑑𝑡 = 𝐻-Ψ, (2.1)
where ℏ is the reduced Planck constant, Ψ is the many-body wave function, and 𝐻- is the Hamiltonian operator. In the non-relativistic assumption, the Hamiltonian can be expressed as
𝐻- = −ℏ$
2𝑚∇$+ 𝑉(𝐫, 𝑡), (2.2)
where 𝑚 is the mass of particle. The first and the other terms are the operators for kinetic and potential energies, respectively. In the time-independent system with electrons and nuclei, the wave function is a function of positions particles as
Ψ = Ψ(𝐫%, 𝐫$, ⋯ , 𝐫&; 𝐑%, 𝐑$, ⋯ , 𝐑'), (2.3) where 𝐫 and 𝐑 are position vectors of electrons and nuclei, respectively. The wave equation can be further simplified with the Born-Oppenheimer (BO) approximation which enables the separate treatment between electrons and nuclei.90 Proton is about 1800 times heavier than electron (by rest
mass), thus nuclei will have much slower motions than electrons. In other words, electrons are always at the ground state with respect to the potential energy surface arisen by nuclei at fixed positions.91 Nuclei will be treated classically and only electrons will behave
time-independent non-relativistic system with electrons and nuclei under the BO approximation becomes
𝐻-Ψ = 𝐸Ψ, (2.4)
where 𝐸 is the total energy of the system, and the wave function and Hamiltonian (in atomic unit) are Ψ = Ψ(𝐫%, 𝐫$, ⋯ , 𝐫&), (2.5) 𝐻- = −1 2B ∇($ & ()% + B B −𝑍* D𝐑*− 𝐫(D ' *)% & ()% + B B 1 D𝐫* − 𝐫(D & *+( & ()% . (2.6)
The equation is now a function of only electron positions; the kinetic energy of nuclei is neglected and the Coulomb interaction energy between nuclei can be treated separately. The terms in the Hamiltonian are, in order, the kinetic energy of electrons, the Coulombic interaction between nuclei and electrons, and the Coulombic interaction between electrons.
2.1.2 Non-interacting Electron Approximation
The exact solution of the wave function can be achievable only for single-particle problems like a hydrogen atom.92 It is even impossible to solve it numerically with the increased number of
particles.93 To solve many-body problems, Hartree assumed the independent electron
approximation with an ansatz that the wave function can be expressed by the product of orthonormal single-electron wave functions (Hartree product) as94–96
Ψ(𝐫%, 𝐫$, ⋯ , 𝐫&) = 𝜓%(𝐫%)𝜓$(𝐫$) ⋯ 𝜓&(𝐫&). (2.7) This approximation significantly reduces the complexity that the 3𝑛-dimension wave equation becomes 𝑛 number of 3-dimension wave equations for each electron,
𝐻-(𝜓( = 𝐸(𝜓(, (2.8)
where 𝐸( is the energy of electron i. Each electron is assumed to interact with the mean field, i.e., electron density 𝜌(𝐫) = ∑ 𝜓(∗(𝐫
()𝜓((𝐫()
( , which replaces the electron-electron interaction term in
𝑉-(𝐫) = B L𝜓(∗(𝐫#)𝜓((𝐫#) |𝐫 − 𝐫#| 𝑑𝐫# &
()%
. (2.9)
The single-electron wave equations can be solved by the self-consistent field (SCF) iterative method. Initial single-electron wave functions can be used to solve the equations (2.8) and obtain new wave functions which will be used as trial inputs in the next iterative step. The iteration will be implemented until the wave functions and energies of electrons converge.
The Hartree method is a very valuable achievement since it is one of the earliest approaches to solve many-body problems. However, there are several defects to describe real systems due to its oversimplification:93 The non-interacting assumption omits the repulsive Coulomb interaction
between particles with different spins (i.e., correlation energy). The self-interaction is included in the total energy because all electrons contribute to the electron density. Also, this method does not obey the Pauli exclusion principle and the antisymmetry principle, thus it fails to include the exchange interaction between identical particles with the same spin and does not include the exchange energy (the total system energy will be higher than the exact value).97,98 The
Hartree-Fock (HF) method solves this problem by improving the wave function with the Slater determinant as99 Ψ(𝐫%, 𝐫$, ⋯ , 𝐫&) = 1 √𝑛!Q 𝜓%(𝐫%) 𝜓$(𝐫%) 𝜓%(𝐫$) 𝜓$(𝐫𝟐) ⋯ 𝜓&(𝐫%) ⋯ 𝜓&(𝐫$) ⋮ ⋮
𝜓%(𝐫&) 𝜓$(𝐫&) ⋯ 𝜓⋱ &(𝐫⋮ &)
Q . (2.10)
For example, Ψ(𝐫%, 𝐫$) = [𝜓%(𝐫%)𝜓$(𝐫𝟐) − 𝜓$(𝐫%)𝜓%(𝐫$)]/√2 and so Ψ(𝐫%, 𝐫$) = −Ψ(𝐫$, 𝐫%),
thus it satisfies the antisymmetry principle. Also, the wave function becomes zero when two electrons occupy the same spin orbital, i.e., Ψ(𝐫%, 𝐫%) = 0, thus it also satisfies the Pauli exclusion principle. Therefore, the HF method includes the exchange energy. Also, the exchange energy automatically cancels out the self-interaction energy. However, this improved method still cannot include the correlation energy and the calculation is complicated to deal with large systems.
2.1.3 Density Functional Theory
The density functional theory (DFT) is a SCF iterative method with the non-interacting electron approximation and can simulate many-body systems much larger than the HF limit by
virtue of the Hohenberg-Kohn (HK) theorems.100 The first theorem is that the ground-state energy
of the system is a unique functional of the electron density. In other words, the ground-state electron density uniquely determines all properties, including the energy and wave function at the ground state.91 Next, the second theorem states that the electron density that minimizes the energy
functional is the true electron density that corresponds to the solution of the Schrödinger equation. Therefore, we can use the variational principle to find the ground state of electrons iteratively.
Based on the HK theorem, Kohn and Sham suggested the formula for the energy functional as101 𝐸[𝜌(𝐫)] = −1 2, 𝜓!∗(𝐫!)∇#𝜓!(𝐫!) $ !%& + 0 𝑉'()(𝐫)𝜌(𝐫)𝑑𝐫 + 1 23 𝜌(𝐫)𝜌(𝐫*) |𝐫 − 𝐫*| 𝑑𝐫𝑑𝐫*+ 𝐸+,[𝜌(𝐫)], (2.11)
where the first term is the sum of kinetic energies of independent electrons (different from the kinetic energy of the real system), the second term is the classical Coulomb interaction energy between electron and the external potential 𝑉/01 arisen by stationary nuclei, the third term is the
classical Coulomb interaction energy between electrons (i.e., Hartree energy 𝐸-), and the last term is the exchange-correlation (XC) energy. This last term contains all quantum-mechanical behavior of electron, i.e., exchange and correlation energies as well as the kinetic energy error.102 The
Kohn-Shan (KS) equation can be derived from the energy functional, i.e.,
X−1 2∇$+ 𝑉/01(𝐫) + 𝑉-[𝜌(𝐫)] + 𝑉2![𝜌(𝐫)]Y 𝜓((𝐫) = 𝐸(𝜓((𝐫), (2.12) where 𝑉-[𝜌(𝐫)] =𝛿𝐸𝛿𝜌(𝐫)-[𝜌(𝐫)] = L 𝜌(𝐫#) |𝐫 − 𝐫#|𝑑𝐫#, (2.13) 𝑉2![𝜌(𝐫)] =𝛿𝐸2![𝜌(𝐫)] 𝛿𝜌(𝐫) . (2.14)
The SCF iteration can be implemented with trial initial electron density to calculate single-electron wave functions using the equation (2.12). The wave functions can be used to calculate the new electron density that will be used in the next step. The iteration can be terminated if the electron density as well as the total energy converges.
2.1.4 Exchange-Correlation Functional
The difficulty of DFT comes from the XC energy functional, 𝐸2![𝜌(𝐫)], whose exact form is unknown. Thus, the accuracy of DFT simulations depends on the validity of the functional form. The functional can be expressed as101,102
𝐸2![𝜌(𝐫)] = {𝑇[𝜌(𝐫)]−𝑇3[𝜌(𝐫)]} + L 𝜀2![𝜌(𝐫)]𝜌(𝐫)𝑑𝐫 , (2.15) where 𝑇[𝜌(𝐫)] and 𝑇3[𝜌(𝐫)] are the exact and non-interacting kinetic-energy functionals and 𝜀2![𝜌(𝐫)] is the XC energy functional per electron. The XC energy can be decomposed as 𝐸2! =
𝐸2+ 𝐸!. Note that 𝑇[𝜌(𝐫)] is unknown whereas 𝑇3[𝜌(𝐫)] is already discussed above, and the difference between them is the correction to the kinetic energy. The simplest form of the XC functional is the local-density approximation (LDA) that uses the analytic solution of the homogeneous electron gas (HEG).101 It assumes that the local distribution of electrons is uniform
with a certain density, like a mosaic art with small pieces of different colors. The exact solutions of the kinetic energy and exchange energy (𝜀2456) of HEG are known,103–105 and the correlation
energy (𝜀!456) can be determined by empirical models (e.g., Vosko-Wilk-Nusair106 and
Perdew-Wang107) parametrized by fitting to the quantum Monte-Carlo simulation result.108
More sophisticated XC functional is the generalized gradient approximation (GGA) that also includes the gradient of electron density to the exchange and correlation energies (i.e., semi-local model), which leads to higher accuracy than LDA functionals.109 One of the most widely
used XC functionals is the Perdew-Burke-Ernzerhof (PBE) parametrization model.110 The brief
expression of the GGA-PBE XC functional is
𝐸2!789[𝜌(𝐫); ∇𝜌(𝐫) ] = L 𝜀
2!789[𝜌(𝐫); ∇𝜌(𝐫)]𝜌(𝐫)𝑑𝐫 . (2.16)
One of the drawbacks of the GGA as well as LDA functionals is the weak electron localization, which results in less accurate predictions of electron structure and narrower band gaps (or even metallic) than actual properties.111 The hybrid functional suggested by Heyd, Scuseria,
and Ernzerhof (HSE) can improve the accuracy by adopting the exact HF exchange energy:112,113
𝐸2!-:9 = 𝛼𝐸
where SR and LR stand for ‘short-range’ and ‘long-range’, respectively, 𝛼 is the mixing parameter that determines the contribution of the HF exchange energy to the total exchange energy in the short range, and 𝜔 is the screening parameter that defines the separation between SR and LR. The HSE06 model with 𝛼 = 0.25 and 𝜔 = 0.2 Å have shown to product good results for many cases. However, the computational cost increases dramatically since the HF calculations should be involved in the computation.
2.1.5 Quasi-particle GW method
It is the inherent nature that the standard DFT cannot correctly describe the excited states of electrons because the DFT formalism is based on the HK theorem that leads to the KS equation with the XC functional designed for the ground-state Hamiltonian and the excited-state functional in general may not have the same dependence on the electron density as it has for the ground state.114 The higher level of theory than the standard DFT is the quasi-particle GW method based
on the many-body perturbation theory with the GW approximation by virtue of Hedin’s rigorous theoretical framework.115 Prior studies have shown that GW calculations yield ionization
potentials (IP), electron affinities (EA), and band gaps in good agreement with (inverse) photoemission experiments.116–120 The quasi-particle energies (i.e., single-particle excitation
energies) can be calculated by111,121
X−1
2∇$+ 𝑉/01(𝐫) + 𝑉-[𝜌(𝐫)]Y 𝜓((𝐫) + L ∑(𝐫, 𝐫#; 𝐸()𝜓((𝐫#)𝒅𝐫# = 𝐸(𝜓((𝐫), (2.18) where the non-local and energy-dependent potential ∑(𝐫, 𝐫#; 𝐸
() is the self-energy containing the
effects of exchange and correlations. Within the GW approximation, the self-energy operator can be expressed by111,115
∑ ≈ 𝑖𝐺𝑊, (2.19)
where 𝑊 is the screened coulomb interaction and 𝐺 is Green’s function that describes the propagations of an extra/missing electron. Detail descriptions of the self-energy operator can be found in the literature.111,121 The operator is expressed by the wave function and quasi-particle
energies, thus the SCF iteration can be implemented for the GW method. The standard DFT is used to obtain the single-particle wave functions and energies, which can be used as initial guesses of quasi-particle wave-functions and energies to solve the equation (2.18) iteratively. There are
many types of GW methods based on the iteration scheme: non-self-consistent G0W0 and
(partially) self-consistent GW0 and GW calculations, where the subscription 0 means that the
designated term is not updated but fixed on the KS DFT level of theory. In this study, the eigenvalues are updated while the wave functions are kept fixed.116
2.2 Phonons and Thermodynamics 2.2.1 Harmonic Approximation
Phonon is the elastic wave that propagates through solid lattices due to vibrational thermal excitations of atoms.122,123 The vibrations can be described by atoms connected by springs with
force constants. The potential energy can be expressed by the Taylor expansion around the equilibrium with small displacements as87,123
Φ = Φ3+ B 𝜕Φ 𝜕𝑑(>? g 3 𝑑(>? ?(> +1 2B B 𝜕$Φ 𝜕𝑑(>? 𝜕𝑑 *@? !h 3 𝑑(>? 𝑑 *@? ! ?!*@ ?(> + ⋯ , (2.20)
where Φ3 is the equilibrium potential energy and 𝑑(>? is the displacement along direction 𝛼 of
atom 𝑖 in the unit cell 𝑙. The second term is zero at the equilibrium since it is the first-order derivative of the total energy. The truncation of the series above the second-order term leads to the harmonic approximation (HA), assuming that atomic vibrations are on the parabolic potential-energy surface within small perturbations near its equilibrium position. The second-order derivative in the equation (2.20) is the force constant matrix
Γ>@k𝑗𝑙 𝑗 # 𝑙#m = 𝜕$Φ 𝜕𝑑(>? 𝜕𝑑 *@? !h 3 , (2.21)
which describes a set of the force constants between an atom 𝑗 in the unit cell 𝑙 the other atom 𝑗′ in the unit cell 𝑙′ within HA. This matrix can be converted to the dynamical matrix by the Fourier transform as123,124 𝐷>@(𝑗𝑗#, 𝐪) = 1 q𝑀*𝑀*!B Γ>@k𝑗𝑙 𝑗 # 𝑙#m exp{−𝑖𝐪 ∙ [𝒙(𝑗𝑙) − 𝒙(𝑗𝑙)]} ? ?! , (2.22)
where 𝑀* is the mass of the atom 𝑗 and 𝐪 is the phonon wave vector. The phonon modes can be obtained by solving the eigenvalue problem for the dynamical matrix by diagonalization, i.e., the eigenvalues are the vibrational frequencies of phonon modes.
For insulators with a long-range Coulomb interaction by dipole-dipole contribution (especially ionic solids), the dynamical matrix is non-analytical. Thus, the non-analytic term should also be added in the analytic expression of dynamical matrix (i.e., the form that does not include Coulomb interaction) to account for the splitting between transverse and optical phonons at the Γ-point.125–127 the dynamical matrix at the Γ-point can be expressed as124
𝐷>@(𝑗𝑗#, 𝐪 → 𝟎) = 𝐷 >@(𝑗𝑗#, 𝐪 = 𝟎) + 𝐷>@B6(𝑗𝑗#, 𝐪 → 𝟎), (2.23) 𝐷>@B6(𝑗𝑗#, 𝐪 → 𝟎) = 1 q𝑀*𝑀*! 4𝜋 𝑉 {∑ 𝑞C C𝑍*,C>∗ } k∑ 𝑞C! C!𝑍*∗!,C!@m ∑ 𝑞>@ >𝜀>@D𝑞@ , (2.24)
where the second term in the right-hand side in the equation 2.23 is the non-analytic (NA) term, 𝑉 is the unit cell volume, 𝜀>@D is the electronic dielectric constant tensor, and 𝑍*,C>∗ is the Born effective charge tensor of the atom 𝑗. The NA term is treated by the approach that Parlinski et al. suggested.127
2.2.2 Vibrational Free Energy
Using the partition function with discrete phonon microstates, the statistical mechanics leads to the vibrational contribution (including zero-point energy) of a harmonic system to the free energy as128 𝐹-(𝑇, 𝑉) = 𝑘E𝑇 L 𝑑𝜔 𝑔(𝜔) ln ƒ2 sinh ‡ ℏ𝜔 2𝑘E𝑇ˆ‰ D 3 , (2.25)
where kB is the Boltzmann constant, ℏ is the Planck constant, and the integral is over all phonon
frequencies 𝜔 using the phonon density of states (PDOS) 𝑔(𝜔) at a certain volume V. A small amount of negative frequencies in PDOS, if any, was neglected following a previous analysis.86
This is due to the well-known dynamical instability in the AP lattice system, due to rotational vibrations of octahedra.129 The phonon analysis is implemented by the PHONON software130 using
2.2.3 Quasi-harmonic Approximation
The quasi-harmonic approximation (QHA) is an extension of the harmonic approximation, which accounts for the thermal expansion of lattice (i.e., the dependence of the phonon modes on the cell volume is explicitly accounted for).87 The Gibbs free energy within QHA is expressed
as:87,131
𝐺(𝑇, 𝑝) = min
F [𝐹(𝑇, 𝑉) + 𝑝𝑉] , (2.26)
𝐹(𝑇, 𝑉) = 𝐸3(𝑉) + 𝐹G(𝑇, 𝑉), (2.27)
where 𝐸3 is the electronic energy at zero Kelvin (without vibrational contributions) and min
F [⋯ ]
indicates that G is a minimum with respect to variations in volume V at a specified temperature, T, and pressure, p. The equilibrium volume was found by fitting free energy data as a function of volume to the Murnaghan equation of states (EOS).132 The 𝑝𝑉 term is negligible for solid
Chapter 3 Predicting Wettability and the Electrochemical Window of Lithium-Metal/Solid Electrolyte Interfaces
3.1 Introduction
The present chapter investigates stability and wettability at a Li metal/SE interface. The AP LOC is adopted as a model SE.64 LOC is one example of several AP compositions that have
been reported as potential SEs; others include LOB, NOC, NOB, and NOI.64,65 LOC has a simple
crystal structure, making it attractive for computationally-expensive electronic-structure calculations. Furthermore, LOC has been reported to have a high ionic conductivity (~103 S/cm),
a large band gap implying a wide electrochemical window, and the compatibility with a Li-metal anode.56,66–68 Nevertheless, there is a lack of fundamental understanding of interface phenomena,
especially for stability and wettability, at Li metal/LOC interfaces.
First-principles calculations were used to assess the electronic and thermodynamic properties of Li and LOC surfaces/interfaces. Vibrational contributions to the enthalpy and entropy were evaluated to estimate surface/interface energies at near-ambient temperatures. Interface wettability was characterized according to the Li contact angle on LOC, derived from the Young-Dupré equation and the calculated interfacial work of adhesion. Stability against reduction by the Li electrode was predicted by determining the absolute positions of the band edges of LOC (via GW calculations) in relation to the Li/Li+ level.
These calculations suggest that the oxygen-terminated Li/LOC interface is the most thermodynamically stable. The calculated work of adhesion implies that Li will wet LOC with a low contact angle, suggesting the possibility for strong interfacial bonding and low interfacial resistance. On the other hand, this strong interfacial interaction significantly narrows the bandgap of LOC in the interfacial region by shifting both the CBM and VBM: in the vicinity of the interface the bulk bandgap of ~8 eV is reduced to ~5.6 eV, implying a tradeoff between strong interfacial bonding/wettability and electrochemical stability. Despite this interface-induced reduction in
electrochemical window, the CBM in LOC remains ~1 V more negative than the Li/Li+ redox
potential, denoting stability against reduction by the anode. In total, the present study demonstrates how first-principles computational methods can be used to comprehensively characterize interfacial properties that are relevant to the operation of SSBs.
3.2 Methodology
3.2.1 First-principles Calculations
DFT calculations were performed using the Vienna ab initio Simulation Package (VASP).134 Exchange-correlation effects were treated within the generalized gradient
approximation (GGA), as parameterized by Perdew-Burke-Ernzerhof (PBE).110 Interactions
between core and valence electrons were treated using the projector augmented wave (PAW) method.135,136 The valence electron configurations were 1s22s for Li, 2s22p4 for O, and 3s23p5 for
Cl. A plane-wave basis set with cutoff energy of 550 eV was used for calculations involving ionic relaxations and total-energy evaluations. More computationally-expensive GW calculations (described below) used a 2s valence configuration for Li and a lower cutoff energy of 475 eV. The energy of the electronic ground state was converged to within 10-5 eV, and the force criterion for
atomic relaxations was set to 0.01 eV/Å. At least a 17 × 17 × 17 k-point sampling is required for BCC Li metal for total energy convergence to within 1 meV at the equilibrium volume, whereas only a 4 × 4 × 4 k-point sampling is needed for bulk Li3OCl, Li2O, and LiCl.
Surface energies for LOC were calculated for fully relaxed slab models with 11 layers and within a supercell containing a 12 Å vacuum region. A Γ-centered 4 × 4 × 1 k-point mesh was used for all surface calculations. The effects of number of slab layers (7 – 15 layers) and vacuum thicknesses (6 – 24 Å) were tested; it was determined that the surface energy was well converged using the parameters described above. The work of adhesion was calculated for fully relaxed interface models with 7 layers of LOC and 7 layers of Li. Convergence testing revealed that the work of adhesion did not change significantly upon increasing the number of Li and LOC layers (tests were done with 5 – 13 Li layers and 7 – 23 LOC layers). A Γ-centered 4 × 4 × 1 k-point mesh was also used for interface calculations; this sampling converged the total energy of the interface to within 1 meV/atom. Spin-polarized calculations were used for gas-phase molecules
and for atoms; these systems used a simulation cell of dimensions 10 Å × 11 Å × 12 Å, with reciprocal space sampled at the Γ point.
Free energies were evaluated within the harmonic approximation using the direct method.137 Atomic displacements of ±0.02 Å and ±0.04 Å were used in conjunction with 3 × 3
× 3 expansions of the conventional unit cells, corresponding to supercells containing 135 atoms for LOC, 54 atoms for BCC Li, 324 atoms for Li2O, and 216 atoms for LiCl. A Γ-centered 4 × 4
× 4 k-point mesh was used for the Li supercell, whereas a single k-point was used for the other systems. Phonon calculations on slab models of LOC employed a 3 × 3 expansion within the surface plane for (100) surfaces, a 3 × 2 expansion for (110) surfaces, and a 2 × 1 expansion for (111) surfaces. A single k-point was used for these slab models. Interface models used a 2 × 2 expansion within the interfacial plane (dimensions of 15.6 Å × 15.6 Å) and a Γ-centered 2 × 2 × 1 k-point mesh. Convergence testing revealed that increases to system size or the number of k-points did not significantly alter the vibrational properties.
3.2.2 Band Edge Positions
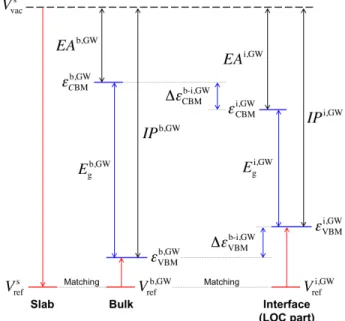
The absolute positions of the VBM and CBM (relative to vacuum) in bulk LOC were obtained following the procedure described in Ref.138 Figure 3.1 summarizes this approach, which involves
aligning the planar averaged electrostatic potential (Vref) in the bulk region of an LOC surface slab
Figure 3.1 Determination of the absolute band edge positions of a solid electrolyte. The method is based on aligning the reference potentials Vref of the slab (s), bulk (b), and interface (i) systems.
with that from a bulk cell.55,119,120 VBM and CBM positions in the bulk cell (given by 𝜀
VBM and
𝜀CBM) are evaluated using GW calculations, while the position of the vacuum level (Vvac) is
determined from the slab system at a lower level of theory (GGA or HSE06). Aligning the electrostatic potentials in these two systems provides a common reference from which the absolute VBM/CBM positions can be inferred. Following this procedure, the IP of bulk LOC is expressed as:
𝐼𝑃b,GW= (𝑉
vacs − 𝑉refs ) − {𝜀VBMb,GW− 𝑉refb,GW}, (3.1)
where 𝑉vacs and 𝑉
refs are the planar-averaged electrostatic potentials in the vacuum region and at the
center of the LOC slab, respectively, and 𝜀VBMb,GW and 𝑉refb,GW are the VBM energy and reference electrostatic potential of bulk LOC evaluated with the GW method, respectively. 𝑉refb,GW for the bulk cell should be evaluated at an atomic plane similar to that found in the center of the LOC slab. The absolute CBM position (i.e., 𝐸𝐴H,IJ) can be determined by combining 𝐼𝑃b,GW with the bulk
band gap (i.e., 𝐸KH,IJ). Since the wavefunctions input to a GW calculation (from a preceding GGA or HSE06 calculation) are unchanged during the GW calculation, the Hartree potential is also unchanged. Thus, the reference potential from the slab supercell (evaluated using the GGA or HSE06 functional) and the bulk (evaluated using GW) can be aligned without difficulty.119,120
In a similar fashion, the absolute positions of the LOC band edges can be determined when LOC is interfaced with a Li anode. In this case the electrostatic potential at the center of LOC slab (now a sub-component of the interface supercell) is used as the reference potential (i.e., 𝑉refi,GW). Band edge shifts are obtained as the difference in VBM or CBM positions between the bulk and interface systems as
Δ𝜀VBM/CBMb-i,GW = D𝜀
VBM/CBMi,GW − 𝜀VBM/CBMb,GW D. (3.2) 3.2.3 Gibbs Free Energy
The Gibbs free energy, G, for several phases relevant for the Li-O-Cl system was evaluated using the following expression:139–141
Here 𝐸(0 K) is the static energy at 0 K (i.e., the DFT total energy) and 𝐸vib(𝑇) is the vibrational
energy, including the zero-point energy. For molecular systems, the rotational energy, 𝐸rot(𝑇),
translational energy, 𝐸trans(𝑇), and the 𝑝𝑉 term sum to L
$𝑘B𝑇 (4𝑘B𝑇) for linear (non-linear)
molecules, where 𝑘B is the Boltzmann constant. These three terms do not significantly contribute to the free energy of solids under the conditions examined here. 𝑆vib(𝑇) and 𝑆conf(𝑇) are the
vibrational and configurational entropy; the latter term can be neglected for the ordered solid systems examined here.133,141 For gas-phase molecules the total entropy 𝑆vib(𝑇) + 𝑆conf(𝑇) was
obtained from experimental data.142 Vibrational contributions to the energy and entropy within the
harmonic approximation can be expressed as:139
𝐸vib(𝑇) = B 1 2ℏ𝜔( ( + ℏ𝜔(”𝑒 ℏN" OBP− 1– Q% , (3.4) 𝑆vib(𝑇) = 𝑘 BB ℏ𝜔( 𝑘B𝑇 𝑒OℏNBP" − 1 ( − ln ‡1 − 𝑒 QℏON" BPˆ , (3.5)
where the sums are over vibrational modes 𝜔( and ℏ is the reduced Planck constant.
The dependence of the chemical potentials of the gas-phase species upon temperature and pressure were evaluated assuming ideal gas behavior:
𝜇(𝑇, 𝑝) =1
2ƒ𝐺(𝑇, 𝑝°) + 𝑘B𝑇 ln ‡ 𝑝
𝑝°ˆ‰ , (3.6)
where 𝑝° is the standard pressure. The calculated vibrational modes for the various molecular
species are 1572 cm-1 for O
2, 538 cm-1 for Cl2, 1062, 916, and 424 cm-1 for ClO2 and 642, 577 and
278 cm-1 for Cl
2O, are in reasonable agreement with experimental data.142 Corrections to the
chemical potentials of oxygen and chlorine, due to the overbinding tendency of DFT,143 were done
by using empirical binding energy as144
𝐸O2 or Cl2(0 K) = 2𝐸O or Cl(0 K) + 𝐸Binding, (3.7)
where 𝐸((0 K) on the right side is the DFT energy of species 𝑖 and 𝐸Binding is 5.12 and 2.48 eV at
0 K per O2 and Cl2 molecules, respectively.142 The free energies of compounds and other molecules