Yang Song
A Dissertation submitted in fulfilment of the requirements for the award of Doctor of Philosophy (Ph.D.)
to the
Dublin City University
Faculty of Engineering and Computing
School of Electronic Engineering
Supervisor: Dr. Gabriel-Miro Muntean
I hereby certify that this material, which I now submit for assessment on the programme of study leading to the award of Doctor of Philosophy is entirely my own work, and that I have exercised reasonable care to ensure that the work is original, and does not to the best of my knowledge breach any law of copyright, and has not been taken from the work of others save and to the extent that such work has been cited and acknowledged within the text of my work.
Signed:
ID No.:
First and foremost, I would love to thank my dear parents. You are the most valuable treasures in my life and I feel so lucky to be your daughter. I will never be who I am without you. You are always the most supportive friends and helped me through all difficulties. Thank you dad for encouraging and supporting me at every stage of my life. Mum thank you for your endless love and care, I would not have made it this far without you.
A special acknowledgement is given to my boyfriend Ruiqi, who has shared laughter and tears with me for five years. He has been a true and great advisor for both life and academic research and has unconditionally supported me during my good and bad times. Thank you for having faith in me and instilling confidence in me. I’ve gained so much drive and an ability to tackle challenges through your help.
I would like to express my deepest appreciation to my principal supervisor, Dr. Gabriel-Miro Muntean, for his consistent efforts and help. Thank you for your guidance which helped me in all the time of research during the past years. I’ve benefited so much from your wisdom and scholarly input. You are always very encouraging and supportive, otherwise I will hardly make the academic achievements that I’ve made today. You are always the best supervisor and a good friend. I could not have imagined having a better advisor and mentor. Besides, I am extremely grateful to my co-supervisor Dr. Bogdan Ciubotaru who shared his extremely valuable experience with me. Bogdan thank you for pushing me through the path towards a successful PhD. Thank you for inspiring me and helping me with my papers and difficulties encountered during the research.
Many thanks to dozens of people who have helped and taught me immensely at the Performance Engineering Lab. Ramona thank you for always telling me everything is going to be fine during the depressing times, Irina you are such a nice girl and I am always cheered up after talking to you and being affected by your optimism. My sincere thanks also goes to Zhenhui and his lovely fiancee Xin, who never hesitated to share their experience and valuable advice with me. My heartful thanks are given to my dear colleagues for their
Also I want to thank the technical staff, especially Robert Clare and Conor Maguire from the School of Electronic Engineering. You are always a great helper and offer many professional advice.
Last but not least, I gratefully acknowledge Prof. Amaia Arrinda, Prof. Noel E O’Connor and Dr. Conor Brennan for making this happen.
Dublin, November 2013
• Y. Song, B. Ciubotaru, and G.-M. Muntean, “A Slow-start Exponential and Linear Algorithm for Energy Saving in Wireless Networks,” Broadband Multimedia Sys-tems and Broadcasting (BMSB), 2011 IEEE International Symposium on, pp.1–5, June 2011.
• Y. Song, B. Ciubotaru, and G.-M. Muntean, “Application-aware Adaptive Duty Cycle-based Medium Access Control for Energy Efficient Wireless Data Transmissions,” Local Computer Networks (LCN), 2012 IEEE 37th Conference on, pp.172–175, Oct. 2012.
• Y. Song, B. Ciubotaru, and G.-M. Muntean, “Q-PASTE: A Cross-Layer Power Sav-ing Solution for Wireless Data Transmission,” IEEE International Conference on Communications (ICC), IEEE International Workshop on Energy Efficiency in Wire-less Networks & WireWire-less Networks for Energy Efficiency (E2Nets), Jun. 2013.
• Y. Song, B. Ciubotaru, and G.-M. Muntean, “STELA: A Transceiver Duty Cycle Management Strategy for Energy Efficiency in Wireless Communications”, Local Computer Networks (LCN), 2012 IEEE 38th Conference on, Oct. 2013.
Wireless communication technologies, although emerged only a few decades ago, have grown fast in both popularity and technical maturity. As a result, mobile devices such as Personal Digital Assistants (PDA) or smart phones equipped with embedded wireless cards have seen remarkable growth in popularity and are quickly becoming one of the most widely used communication tools. This is mainly determined by the flexibility, conve-nience and relatively low costs associated with these devices and wireless communications. Multimedia applications have become by far one of the most popular applications among mobile users. However this type of application has very high bandwidth requirements, seri-ously restricting the usage of portable devices. Moreover, the wireless technology involves increased energy consumption and consequently puts huge pressure on the limited battery capacity which presents many design challenges in the context of battery powered devices. As a consequence, power management has raised awareness in both research and industrial communities and huge efforts have been invested into energy conservation techniques and strategies deployed within different components of the mobile devices.
Our research presented in this thesis focuses on energy efficient data transmission in wireless local networks, and mainly contributes in the following aspects:
1.Static STELA, which is a Medium Access Control (MAC) layer solution that adapts the sleep/wakeup state schedule of the radio transceiver according to the bursty nature of data traffic and real time observation of data packets in terms of arrival time. The algorithm involves three phases– slow start phase, exponential increase phase, and linear increase phase. The initiation and termination of each phase is self-adapted to real time traffic and user configuration. It is designed to provide either maximum energy efficiency or best Quality of Service (QoS) according to user preference.
2. Dynamic STELA, which is a MAC layer solution deployed on the mobile devices and provides balanced performance between energy efficiency and QoS. Dynamic STELA consists of the three phase algorithm used in static STELA, and additionally employs a
increase of Wireless Network Interface Card (WNIC) sleeping interval in the second and the third phase and at the same time guarantees delivery performance through optimal WNIC waking timing before the estimated arrival of new data burst.
3. Q-PASTE, which is a quality-oriented cross-layer solution with two components employed at different network layers, designed for multimedia content delivery. First com-ponent, the Packet/ApplicaTion manager (PAT) is deployed at the application layer of both service gateway and client host. The gateway level PAT utilizes fast start, as a widely sup-ported technique for multimedia content delivery, to achieve high QoS and shapes traffic into bursts to reduce the wireless transceiver’s duty cycle. Additionally, gateway-side PAT informs client host the starting and ending time of fast start to assist parameter tuning. The client-side PAT monitors each active session and informs the MAC layer about their traffic-related behavior. The second component, dynamic STELA, deployed at MAC layer, adaptively adjusts the sleep/wake-up behavior of mobile device wireless interfaces in order to reduce energy consumption while also maintaining high Quality of Service (QoS) levels.
4. A comprehensivesurveyon energy efficient standards and some of the most impor-tant state-of-the-art energy saving technologies is also provided as part of the work.
1G First Generation of Wireless Telephone Technology
2G Second Generation of Wireless Telephone Technology
2.5G Second and Half Generation of Wireless Telephone Technology
3G Third Generation of Mobile Telecommunications Technology
3GPP 3rd Generation Partnership Project
4G Fourth Generation of Mobile Telecommunications Technology
ACK Acknowledgement
AID Association ID
AMPS Advanced Mobile Phone System
AP Access Point
ARQ Automatic Repeat Request
ASN Access Service Network
AUC Authentication Centre
BE Best Effort
BSC Base Station Controller
BSS Base Station Subsystem
BSS Base Service Set
BTS Base Transceiver Stations
CBR Constant Bit Rate
CN Core Network
CSMA/CA Carrier Sense Multiple Access with Collision Avoidance
CTS Clear-To-Send
DCCP Datagram Congestion Control Protocol
DCF Distributed Coordination Function
DCT Discreet Cosine Transform
DIFS DCF Interframe Space
DSSS Direct-Sequence Spread Spectrum
EDGE Enhanced Data rates for Global Evolution
EIR Equipment Identification Register
ertPS extended real-time Polling Service
ETSI European Telecommunications Standards Institute
FDMA Frequency Division Multiple Access
FEC Forward Error Correction
FR Full Reference
FTP File Transfer Protocol
GPRS General Packet Radio Service
GSM Global System for Mobile Communications
HLR Home Location Register
ICMP Internet Control Message Protocol
ICT Information and Communications Technologies
IEEE Institute of Electrical and Electronics Engineers
IMAP Internet Message Access Protocol
IMT-2000 International Mobile Telecommunications-2000
IP Internet Protocol
IPv4 Internet Protocol version 4
IPv6 Internet Protocol version 6
ITU International Telecommunications Union
JPEG Joint Photographic Experts Group
MAC Medium Access Control
MIMO Multiple Input Multiple Output
MOS Mean Opinion Score
MPEG Moving Pictures Experts Group
MSC Mobile Service Switching Centre
MSS Maximum Segment Size
NAV Network Allocation Vector
NMT Nordic Mobile Telephony
NR No Reference
NSS Network Switching Subsystem
OFDM Orthogonal Frequency-Division Multiplexing
OMC Operation Maintenance Centre
OSS Operation and Support System
PAT Packet/ApplicaTion manager
PCF Point Coordination Function
PDA Personal Digital Assistants
PDV Packet Delay Variation
PESQ Perceptual Evaluation of Speech Quality
PEVQ Perceptual Evaluation of Video Quality
POP Post Office Protocol
PSM Power Saving Mode
PSQM Perceptual Speech Quality Measurement
QoE Quality of Experience
QoS Quality of Service
RR Reduced Reference
RTCP RTP Control Protocol
RTP Real-Time Transport Protocol
RTT Round Trip Time
RTSP Real Time Streaming Protocol
Rx Receive
SCTP Stream Control Transmission Protocol
SDP Session Description Protocol
SIFS Short Inter-Frame Space
SIM Subscriber Identity Module
SMTP Simple Mail Transfer Protocol
STELA Slow sTart Exponential and Linear Algorithm
TCP Transmission Control Protocol
TDMA Frequency Division Multiple Access
TIM Traffic Indication Map
Tx Transmit
UDP User Datagram Protocol
UGS Unsolicited Grant Service
UMTS Universal Mobile Telecommunications System
UE User Equipment
UTRAN UMTS Radio Access Network
VBR Variable Bit Rate
VLR Visitor Location Register
Wi-Fi Wireless Fidelity
WiMAX Worldwide Interoperability for Microwave Access
WLAN Wireless Local Area Networks
WMAN Wireless Metropolitan Area Network
WNIC Wireless Network Interface Card
WPAN Wireless Personal Area Network
Table 1 List of Symbols
Symbol Description
Ws,Wthre Size, and threshold of sleeping window
Iob Interval between two consecutive
bursts observed during parameter tuning
Tf s,rf s Total length, and data rate of fast start
tbf Buffering period
Tbf Maximum buffering period without
compromising QoS
rec Encoding rate
spo,tpo size and duration of playout
sts The size of scheduled data after fast
start period
sbf The size of data that is going to be
re-leased
tts The time elapsed after fast start
Tbfmin Lower bound ofTbf
tsl N The sleeping interval of the Nth
sleep/wakeup cycle
tds Actual burst scheduling time
Dt, Dss,
Dbf, Dsl,
Dpp,Dpr,
Total delay, server-side delay, buffering delay, sleeping delay, propagation de-lay and processing dede-lay
Iac, Delay without PSM
Dex Extra delay caused by STELA
Ibc Beacon duration.
List of Tables xxii List of Figures xxv 1 Introduction 1 1.1 Research Motivation . . . 1 1.2 Problem Definition . . . 4 1.3 Solution Overview . . . 5 1.4 Contributions . . . 7 1.5 Report Structure . . . 9 2 Background Technologies 10 2.1 Wireless Networks Overview . . . 10
2.1.1 Wireless Wide Area Network (WWAN) . . . 12
2.1.1.1 Second Generation (2G) . . . 12
2.1.1.2 Two Point Five Generation (2.5G) . . . 14
2.1.1.3 Third Generation (3G) . . . 14
2.1.2 Wireless Metropolitan Area Network (WMAN) . . . 16
2.1.3 Wireless Local Area Networks (WLAN) . . . 18
2.1.4 Wireless Personal Area Network (WPAN) . . . 20
2.2 Network Protocol Stack . . . 23
2.2.1 Application Layer Standards . . . 23
2.2.2 Transport Layer Standards . . . 28
2.2.3 Network Layer Standards . . . 29
2.2.4 MAC&Physical Layer Standards . . . 30
2.3 Quality Measurements in Wireless Communications . . . 36
2.3.1 Overview . . . 36
2.3.2 QoS Evaluation Metrics . . . 37
2.3.2.1 End-to-end Delay . . . 37
2.3.2.2 Packet Loss Rate . . . 38
2.3.2.3 Jitter . . . 39
2.3.2.4 QoS for Multimedia Services . . . 40
2.3.3 QoE Evaluation Metrics . . . 40
2.3.3.1 Classificatin of Objective Methods . . . 41
2.3.3.2 E-Model . . . 42
2.3.3.3 MOS . . . 43
2.3.3.4 PSNR . . . 44
2.3.3.5 PSQM&PESQ . . . 44
2.3.3.7 PEVQ . . . 45
2.3.4 Quality Measurements Conclusion . . . 45
2.4 Summary . . . 46
3 Related Works 47 3.1 Energy Efficient Application Layer . . . 47
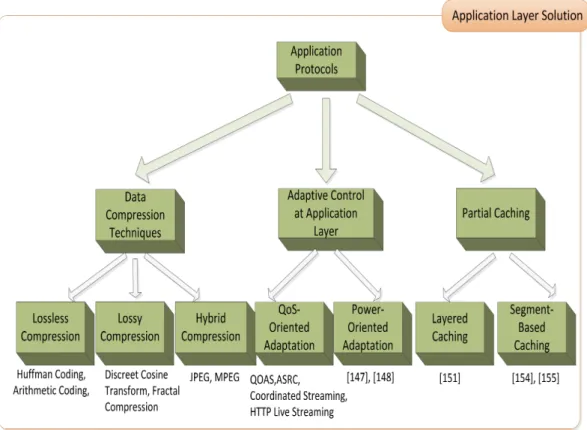
3.1.1 Data Compression Techniques . . . 50
3.1.2 Adaptive Control at Application Layer . . . 53
3.1.3 Partial Caching . . . 58
3.2 Energy Efficient Transport Layer . . . 61
3.2.1 Reliability-Focused Transport Protocol . . . 66
3.2.2 Congestion-Focused Transport Protocol . . . 68
3.2.3 Reliability and Congestion Supported Transport Protocol . . . 70
3.3 Energy Efficient Network Layer . . . 72
3.3.1 Energy Aware Routing . . . 75
3.3.2 QoS-oriented Energy Aware Routing . . . 78
3.4 Energy Efficient MAC Layer Solutions . . . 82
3.4.1 MAC-Layer Energy Efficiency Approaches . . . 82
3.4.2 Contention Based Power Saving Mechanisms . . . 90
3.4.3 Schedule Based Power Saving Mechanism . . . 94
3.4.4 Hybrid Power Saving Mechanisms . . . 96
3.5 Cross-Layer Approach to Energy Efficiency . . . 97
3.5.2 Traffic Shaping . . . 101
3.5.3 Joint Routing and Sleep Scheduling . . . 104
3.5.4 QoS through Packet Prioritization . . . 106
3.6 Summary . . . 108
4 Proposed System Architecture and Algorithms 111 4.1 Network Architecture . . . 112
4.1.1 Distributed Network Architecture . . . 112
4.1.2 Centralized Network Architecture . . . 113
4.1.3 Power Saving Infrastructure-based Network Architecture . . . 114
4.2 Assumptions . . . 115
4.2.1 Bursty Data Traffic . . . 116
4.2.2 Regular Traffic Arrival Pattern . . . 117
4.3 Static STELA . . . 118
4.3.1 Static STELA Architecture . . . 118
4.3.2 Static STELA Algorithm . . . 121
4.3.2.1 The Slow Start Phase . . . 123
4.3.2.2 The Exponential Increase Phase . . . 126
4.3.2.3 Linear Increase Phase . . . 128
4.3.3 Static STELA Performance Analysis . . . 129
4.3.3.1 Packet Delay . . . 130
4.3.3.2 Energy Consumption . . . 134
4.4.1 Dynamic STELA Architecture . . . 137
4.4.1.1 Architecture Overview . . . 137
4.4.1.2 Cross-layer Information Passing . . . 138
4.4.2 Dynamic STELA Algorithm . . . 139
4.4.3 Dynamic STELA Performance Analysis . . . 141
4.5 Q-PASTE . . . 147
4.5.1 Q-PASTE Architecture . . . 148
4.5.1.1 Gateway Side Component Architecture . . . 149
4.5.1.2 Client Side Component Architecture . . . 152
4.5.2 Q-PASTE Algorithm . . . 153
4.5.2.1 QoS-aware Traffic Shaping . . . 153
4.5.2.2 Adaptive Sleep/Wakeup Scheduling . . . 156
4.5.3 Q-PASTE Performance Analysis . . . 158
4.6 Summary . . . 159
5 Testing: Environment and Scenarios 161 5.1 Testing Environment . . . 161
5.1.1 Simulation Tool . . . 161
5.1.2 Simulation Settings . . . 162
5.1.2.1 Protocol Support . . . 162
5.1.2.2 Power Saving Scheme . . . 163
5.1.2.3 Energy Consumption Assessment . . . 164
5.1.2.5 Simulation Topology . . . 167
5.2 Static STELA Testing . . . 169
5.2.1 Simulation Test-bed Setup . . . 169
5.2.2 Test Cases . . . 171
5.3 Dynamic STELA Testing . . . 175
5.3.1 Simulation Test-bed Setup . . . 175
5.3.2 Test Cases . . . 175
5.3.2.1 Scenario One – Single Server . . . 176
5.3.2.2 Scenario Two– Multiple Servers . . . 178
5.4 Q-PASTE Testing . . . 180
5.4.1 Simulation Test-bed Setup . . . 180
5.4.2 Test Cases . . . 182
5.4.2.1 Scenario One – Immediate Playback . . . 183
5.4.2.2 Scenario Two – Delayed Playback . . . 184
5.5 Summary . . . 185
6 Testing Results and Analysis 186 6.1 Static STELA . . . 186
6.1.1 Impact of Traffic Pattern and Type on the Performance of Static STELA . . . 188
6.1.2 Impact of Data Rate on the Performance of Static STELA . . . 191
6.1.3 Impact of Threshold Value on the Performance of Static STELA . . 192
6.2.1 Impact of Traffic Pattern on the Performance of Dynamic STELA . 201
6.2.2 Impact of Data Rate on the Performance of Dynamic STELA . . . 203
6.2.3 Impact of Threshold on the Performance of Dynamic STELA . . . 205
6.2.4 Impact of Multiple Servers on the Performance of Dynamic STELA 207 6.3 Q-PASTE . . . 210
6.3.1 Impact of Buffering Period on Energy Consumption . . . 211
6.3.2 Impact of Buffering Period on Playout Buffer Size . . . 214
6.3.3 Impact of Playback Time on Playout Buffer . . . 217
6.3.4 Impact of Buffering Period on End-to-End Delay . . . 219
6.3.5 Quality Evaluation . . . 220
6.4 Summary . . . 223
7 Q-PASTE – Prototype-based Testing 225 7.1 Q-PASTE Prototype Software System . . . 225
7.1.1 Client-Server Video Delivery in Java . . . 225
7.1.2 Q-PASTE- Testing Server . . . 228
7.1.3 Q-PASTE-enhanced AP . . . 228
7.1.4 Q-PASTE Client . . . 230
7.2 Real Tests on the Q-PASTE Prototype Software . . . 230
7.2.1 Testing Settings . . . 230
7.2.2 Impact of Buffering Period on Playout Buffer Size . . . 233
7.2.3 Impact of Buffering Period on End-to-End Delay . . . 235
7.2.5 Quality Evaluation . . . 236
7.3 Summary . . . 237
8 Conclusion and Future Work 239
8.1 Problem Overview . . . 239 8.2 Thesis Contributions . . . 240 8.2.1 Comprehensive Survey . . . 240 8.2.2 Static STELA . . . 242 8.2.3 Dyanmic STELA . . . 242 8.2.4 Q-PASTE . . . 243
8.3 Publications Arising from this Work . . . 244
8.4 Future Work . . . 244
8.4.1 Accurate Data Estimation . . . 245
8.4.2 Ad-hoc Supported MAC scheme . . . 245
8.4.3 Quality-oriented Solution for Various Application Types . . . 246
8.4.4 Subjective Testing . . . 246
8.4.5 Traffic Prioritization . . . 246
1 List of Symbols . . . xiii
2.1 802.16 Family . . . 17
2.2 802.11 Family . . . 21
2.3 WiMAX Services and QoS Requirements . . . 35
2.4 Network Performance Objectives for IP-based Applications . . . 41
2.5 Mean Opinion Score(MOS) Rating Scheme . . . 43
2.6 PSNR Mapping to MOS . . . 44
3.1 Energy Efficient Solutions at Application Layer . . . 49
3.2 Energy Efficient Transport Layer Protocols . . . 65
3.3 Energy Efficient Network Layer Protocols . . . 74
3.4 Energy Efficient MAC Layer Protocols . . . 88
3.5 Energy Efficient Cross-Layer Approaches . . . 110
5.1 Common Simulation Parameters . . . 166
5.2 Schemes Compared in Validation of Static STELA . . . 171
5.4 Schemes Compared in Validation of Dynamic STELA . . . 176
5.5 Testing Parameters– Dynamic STELA, Scenario One . . . 177
5.6 Testing Parameters– Dynamic STELA, Scenario Two . . . 180
5.7 Schemes Compared in Validation of Q-PASTE . . . 182
5.8 Testing Parameters– Q-PASTE . . . 183
6.1 Impact of Traffic Pattern on Static STELA–Data Rate: 1.5Mbps, Thresh-old:16 Beacon Intervals . . . 191
6.2 Impact of Data Rate on Static STELA–Type: 1, Threshold:16 Beacon In-tervals . . . 192
6.3 Impact of Threshold Value on Static STELA–Type: 1, Data Rate:1.5Mbps . 194
6.4 Testing Results for Static STELA with Threshold Value Set to 2 Beacon Intervals . . . 195
6.5 Testing Results for Static STELA with Threshold Value Set to 4 Beacon Intervals . . . 196
6.6 Testing Results for Static STELA with Threshold Value Set to 8 Beacon Intervals . . . 197
6.7 Testing Results for Static STELA with Threshold Value Set to 16 Beacon Intervals . . . 198
6.8 Testing Results for Dynamic STELA with Data Rate set to 0.5Mbps . . . . 199
6.9 Testing Results for Dynamic STELA with Data Rate set to 1.0Mbps . . . . 200
6.10 Testing Results for Dynamic STELA with Data Rate set to 1.5Mbps . . . . 200
6.11 Testing Results for Dynamic STELA with Two Servers, Data Rate set to 0.5Mbps . . . 210
6.12 Average Energy Consumption when Delivering Stream 1, 2 and 3, respec-tively . . . 213
6.13 End-to-End delay for 802.11, Buffered Streaming and Q-PASTE . . . 220
6.14 R Factor for 802.11, Buffered Streaming and Q-PASTE . . . 222
7.1 Prototype-based Testing Parameters . . . 232
7.2 Buffer Size for Q-PASTE in Prototype Test . . . 235
7.3 End-to-End delay for Buffered Streaming and Q-PASTE in prototype test . 235
1.1 Wireless communication in heterogeneous network environment . . . 3
2.1 Wireless technologies range-based classification . . . 11
2.2 GSM architecture . . . 13
2.3 WiMAX architecture . . . 18
2.4 WLAN architecture . . . 19
2.5 Bluetooth architecture . . . 21
2.6 Wireless technologies– speed VS. mobility . . . 22
2.7 TCP/IP protocol suite . . . 24
2.8 Illustration of an RTP session . . . 26
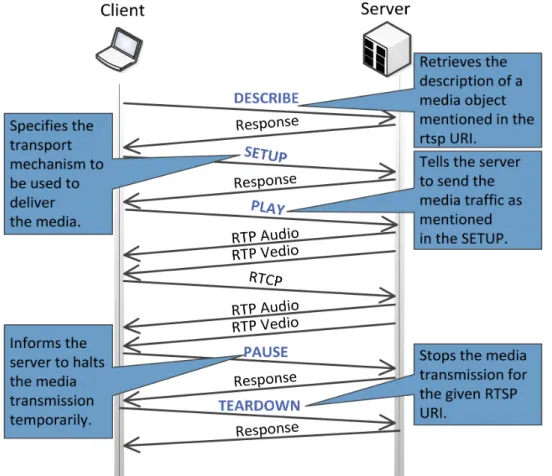
2.9 Illustration of an RTSP session and basic RTSP requests . . . 27
2.10 Buffered frame retrieval process in PCF . . . 32
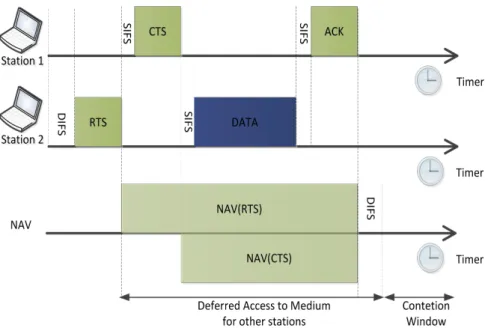
2.11 Data transmission process in DCF . . . 33
2.12 QoS vs. QoE in wireless communications . . . 37
3.1 Classification of application layer energy efficient protocols . . . 48
3.3 Illustration of partial caching . . . 59
3.4 Classification of energy efficient transport layer protocols . . . 63
3.5 Illustration of distributed TCP caching . . . 67
3.6 Classification of energy efficient network layer protocols . . . 73
3.7 The implosion problem. A broadcasts data to B and C, and two copies data is sent from B and C to D eventually . . . 80
3.8 The overlap problem. C receives data from A containing information about area g and d, and C received data from B containing information about area f and d, two duplicate information about d are transmitted . . . 81
3.9 State diagram of WNIC . . . 82
3.10 Hidden node problem . . . 84
3.11 Illustration of RTS/CTS protocol overhead . . . 86
3.12 Exposed node problem . . . 87
3.13 Classification of energy efficient MAC layer protocols . . . 91
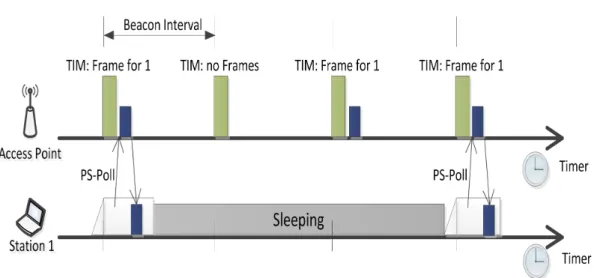
3.14 Polling process in contention-based PSM . . . 92
3.15 Illustration of general cross-layer approach . . . 100
3.16 Illustration of traffic shaping principle . . . 102
3.17 Illustration of application-specific network management for energy-aware streaming . . . 103
3.18 PEDAMACS: Joint routing and MAC layer sleep scheduling . . . 104
4.1 Wireless LAN in ad-hoc mode . . . 112
4.2 Wireless LAN in infrastructure mode . . . 114
4.4 Static STELA architecture overview . . . 119
4.5 Server side and access point architecture of static STELA . . . 120
4.6 Client side architecture of static STELA . . . 120
4.7 Decision maker in static STELA . . . 121
4.8 Energy monitor in static STELA . . . 122
4.9 Illustration of static STELAs energy saving approach . . . 123
4.10 Packet flow between client and server . . . 126
4.11 Phase transitions of STELA . . . 129
4.12 Illustration of paceket arrives during exponential increase phase. . . 131
4.13 Illustration of paceket arrives during linear increase phase. . . 132
4.14 Dynamic STELA architecture overview . . . 137
4.15 Client side architecture of dynamic STELA . . . 138
4.16 Decision maker in dynamic STELA . . . 139
4.17 Session monitor in dynamic STELA . . . 140
4.18 Illustration of case 2.1, data burst arrives early . . . 143
4.19 Illustration of case 2.2, data burst arrives early . . . 144
4.20 Illustration of case 2.3, data burst arrives late . . . 147
4.21 Q-PASTE architecture overview . . . 150
4.22 Gateway side architecture of Q-PASTE at application layer . . . 151
4.23 Traffic shaper in Q-PASTE . . . 151
4.24 MAC notifier in Q-PASTE . . . 152
4.26 Illustration of fast start and data buffering . . . 154
5.1 Implementation of power saving mode . . . 164
5.2 Basic simulation topology . . . 168
5.3 Static STELA simulation topology . . . 170
5.4 Illustration of traffic patterns: Type 1, 2 represent on/off CBR traffic, (20s on, 20s off) and (10s on, 20s off) respectively. Type 4, 5 represent on/off VBR traffic, (0.01s on, 0.01s off) and (0.02s on, 0.01s off) respectively. . . 173
5.5 Illustration of traffic patterns: Type 3 represents on/off CBR traffic (20s on, 10s off), and Type 7 is staircase type CBR traffic with 200s duration and a rate variation of 0.5Mb for each stair. Type 6 represents on/off VBR traffic (0.01s on, 0.02s off), and Type 8 is a staircase type VBR traffic with 200s duration and a rate variation of 0.5Mb for each stair. . . 174
5.6 Dynamic STELA simulation scenario one: single server . . . 177
5.7 Dynamic STELA simulation scenario two: multiple servers . . . 179
5.8 Q-PASTE simulation topology . . . 181
5.9 Q-PASTE simulation scenario one: immediate playback . . . 184
5.10 Q-PASTE simulation scenario two: delayed playback . . . 185
6.1 Energy consumption when CBR traffic is generated. . . 189
6.2 Energy consumption when VBR traffic is generated. . . 190
6.3 Impact of traffic pattern on energy consumption: Data Rate:1.0Mbps, Thresh-old Value: 8 . . . 202
6.4 Impact of traffic pattern on packet delay: Data Rate:1.0Mbps, Threshold Value: 8 . . . 202
6.5 Impact of data rate on energy consumption: Traffic Pattern: 1s on/2s off, Threshold Value: 8 . . . 203
6.6 Impact of data rate on packet delay: Traffic Pattern: 1s on/2s off, Threshold Value: 8 . . . 204
6.7 Impact of threshold value on energy consumption: Traffic Pattern: 1s on/2s off, Data Rate:1.0 Mbps . . . 205
6.8 Impact of threshold value on packet delay: Traffic Pattern: 1s on/2s off, Data Rate:1.0 Mbps . . . 206
6.9 Energy consumption when delivering Stream 1 with different buffering pe-riods . . . 213
6.10 Energy consumption when delivering Stream 2 with different buffering pe-riods . . . 214
6.11 Energy consumption when delivering Stream 3 with different buffering pe-riods . . . 214
6.12 Playout buffer size with different buffering periods when delivering Stream 1 (Playback: immediate, Scheme: Q-PASTE) . . . 215
6.13 Playout buffer size with different buffering periods when delivering Stream 2 (Playback: immediate, Scheme: Q-PASTE) . . . 215
6.14 Playout buffer size with different buffering periods when delivering Stream 3 (Playback: immediate, Scheme: Q-PASTE) . . . 216
6.15 Playout buffer size with different buffering periods when delivering Stream 1 (Playback: after fast start, Scheme: Q-PASTE) . . . 217
6.16 Playout buffer size with different buffering periods when delivering Stream 2 (Playback: after fast start, Scheme: Q-PASTE) . . . 218
6.17 Playout buffer size with different buffering periods when delivering Stream 3 (Playback: after fast start, Scheme: Q-PASTE) . . . 218
6.18 R-factor for stream 1 . . . 222
6.19 R-factor for stream 2 . . . 223
6.20 R-factor for stream 3 . . . 223
7.1 Screen shot: Q-PASTE Java implementation . . . 226
7.2 Using RTP with RTSP for video delivery . . . 227
7.3 Video delivery using the prototype . . . 229
7.4 Key elements of Q-PASTE . . . 229
7.5 Real test lab setting: client and server laptops . . . 231
7.6 Playout buffer size with 1s buffering periods (Playback: immediate, Scheme: Q-PASTE) . . . 233
7.7 Playout buffer size with 2s buffering periods (Playback: immediate, Scheme: Q-PASTE) . . . 234
7.8 Playout buffer size with 5s buffering periods (Playback: immediate, Scheme: Q-PASTE) . . . 234
7.9 Playout buffer size with 2s buffering periods (Playback: immediate, Scheme: Q-PASTE) . . . 236
Introduction
This chapter discusses the exceptional growth in wireless communications, their user base and multimedia applications which put high pressure on device battery life. Some en-ergy saving solutions implemented by both battery manufactures and software researchers are briefly introduced. The novel cross-layer solution for balancing energy conservation and user quality of experience levels is then introduced, and the contributions of this thesis are then listed.
1.1
Research Motivation
With the fast pace of development in network, wireless communications are realized and becoming more and more significant in terms of both daily life and professional ac-tivities, such as military and medical applications. The trend is to switch from traditional devices such as desktop PCs to wireless-enabled portable ones such as Personal Digital Assistants (PDA) and smartphones. The wide use of this type of devices can be attributed to the simplicity of deployment of wireless networks.
Wireless communication technologies have served people for a long time in delivering multimedia content via broadcasting (e.g. terrestrial television, radio broadcasting, and
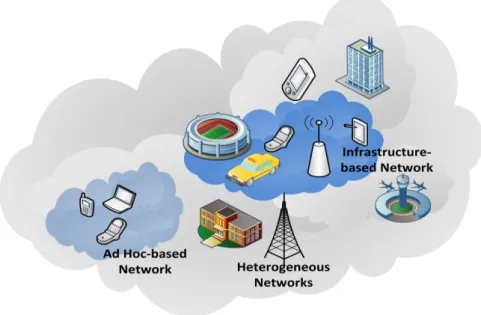
mo-bile TV [1] [2] [3]). Moreover, wireless communication technologies enable user support from different points of view: people are able to connect to the Internet or communicate with each other even when on the move. The number of people accessing mobile Internet has reached half a million in 20091and is expected to exceed 7.1 billion by 2015 accord-ing to Cisco2. Statistics have shown that in Q1 2013 tablets exceeded traditional desktop devices for conversion rates for the first time3. Figure 1.1 illustrates a wireless heteroge-neous communication environment. One of the most significant benefits brought by wire-less technologies is the ability to keep in touch with long distance contacts via applications like Voice over IP (VoIP) and video conferencing such as Skype. Apart from audio and video exchange, users can also search for certain information using search engines, check emails or use wireless communications for entertaining purposes. For example, people can entertain themselves using video applications such as YouTube or social networking appli-cations such as Facebook and Twitter, which are becoming highly popular tools to connect with other people. Statistics4have shown that as of 2011, there are over 500 million active Facebook users, which means this service is used by 1 in every 13 people on Earth, and the number is still growing. Among this, over 100 million users access their accounts through mobile devices and these mobile users are twice as active as those who do not use mobile devices. Besides entertaining purposes, people are allowed to do business, purchase items, seek health and medical advice, etc.
Wireless access to the Internet is enabled by technologies such as cellular and broad-band networks, including Global System for Mobile Communication (GSM), Wireless Lo-cal Area Networks (WLAN) and Wireless Personal Area Network (WPAN) etc. These technologies differ in terms of specifications such as bandwidth, minimum data rate guar-anteed, range of area covered, and they are applied for different purposes providing specific
1
Global Mobile Statistics 2012-http://mobithinking.com/mobile-marketing-tools/latest-mobile-stats-mobile-internet-access
2Cisco visual networking index: Forecast and methodology,
2011-2016.http://www.cisco.com/en/US/solutions/collateral/ns341/ns525/ns537/ns705/ns827/white paper c11-481360.pdf 3 http://www.smartinsights.com/mobile-marketing/mobile-marketing-analytics/mobile-marketing-statistics/ 4 http://www.facebook.com/notes/facebook/500-million-stories/409753352130
Figure 1.1 Wireless communication in heterogeneous network environment
wireless services.
Mobility and wireless connectivity imply that devices should have network access any-where and anytime. However, mobility and wireless communication require most devices use battery power, which has very limited capacity and is a scarce resource. This will def-initely restrict the usage of these devices at least in terms of duration between recharges with a significant negative impact on user satisfaction. Major battery manufacturers and research institutes such as Argonne National Laboratory5, Zic Matrix Power6, and Pana-sonic 7 have put huge efforts into the development of rechargeable batteries with large capacity.
On the other hand, multimedia applications have become by far the most popular among mobile users [4]. It has been pointed out that online video usage measured as time spent on viewing videos online increased by 45% from 2010 to 2011 in the U.S. and the total number of video streams grew by 31.5% to 14.5 billion streams8. According to Allot 9, video streaming as the fastest growing application drives the growth of mobile data
band-5Argonne National Lab-http://www.anl.gov/ 6 ZPower- http://www.zpowerbattery.com/ 7 Panasonic-http://www.panasonic.com/ 8 http://blog.nielsen.com/nielsenwire/online mobile/january-2011-online-video-usage-up-45/
width usage and accounts for 37% of mobile bandwidth usage in 2011. The multimedia-based traffic will account for 49% and 53 percent% of the total data consumption over smartphones and tablets in 2017, respectively [5]. However this type of applications has very high bandwidth requirements and consequently puts high pressure on the limited bat-tery capacity, seriously restricting the usage of portable devices [6]. Therefore the ability of saving energy and maximizing battery life has become a critical issue for both companies and academic research centers. The importance of energy conservation not only lies in the requirements of mobile users, but also attracts interests from the environmental point of view. Studies have pointed out the key role Information and Communications Technolo-gies (ICT) plays in addressing the problem of global climate change and facilitating low carbon footprint and also the influence of ICT technologies on the way our society works and people behave10.
1.2
Problem Definition
Substantial effort has been made to improve energy efficiency through hardware im-provements [7]. One main focus of research for battery companies is to expand the battery capacity for battery companies. Argonne National Laboratory developed composite bat-tery materials to increase the batbat-tery capacity by 30% 11. Zinc Matrix Power introduces silver-zinc batteries as an alternative to lithium-ion batteries as silver-zinc batteries could add several hours to the time that laptops can run between charges12. Panasonic developed new Li-ion rechargeable batteries that improve the battery capacity by 30% compared with the largest capacity of any cell of the same size13.
Another trend in prolonging battery life is to explore energy efficient solutions for wireless communications. Those research efforts are built on top of the existing protocol stack, and achieve energy efficiency mainly by modifying protocols at a single or multiple
10http://www.smart2020.org/ assets/files/02 Smart2020Report.pdf, 2008. 11 http://www.technologyreview.com/news/409860/longer-lasting-batteries-for-laptops/?mod=related, 2008. 12 http://www.technologyreview.com/news/406659/safer-higher-capacity-batteries/, 2006. 13 http://techon.nikkeibp.co.jp/article/HONSHI/20100223/ 180545/, 2010.
layers. Some solutions extend battery life by adapting the behaviour of applications, for example the streaming pattern of multimedia content at the application layer, such as [8] and [9]. Some studies, for example [10] and [11] sacrifice an acceptable degree of traffic reliability to increase energy efficiency at transport layer. There is another body of studies that chooses energy efficient routes that can save energy for those battery critical nodes instead of traditional routes of the least hops or shortest distance as part of network layer protocols [12] [13]. Some other MAC layer based works enable periodical turn-off of radio transceiver to prevent energy waste [14] [15].
However, energy saving is achieved in return for compromising other performance aspects. Adaptive streaming at application layer may involve packet loss due to deliberate data drop and deliberate reduced quality at the server side. Energy efficiency at transport layer may compromise user experience due to longer packet delays. The delivery time of packets may be much longer if energy efficient paths are chosen instead of shortest paths at network layer. Serious jitter may be experienced if radio transceivers are switched off for an unacceptable duration and packets could not arrive at their destination in time.
Currently, there are a few solutions that employ cooperation among multiple layers to achieve energy efficiency maximization for multimedia streaming. Those solutions aim at maximizing energy saving through message flows within the protocol stack and the wise combination of various energy efficient solutions at multiple layers. Moreover, it explores and balances the trade-off between energy saving and quality of service delivered so that energy performance is increased without compromising quality of experience too much.
1.3
Solution Overview
This research focuses on finding a solution to balance energy efficiency and quality of service levels when delivering video content over wireless local area networks. Generally speaking, in order to improve battery lifetime, the wireless interface of mobile devices are switched off to low power saving mode when there is no data arriving. At the same time,
quality of service levels are not compromised as the interfaces are switched on before the arrival of data through various mechanisms.
As mentioned, this research provides a set of solutions for energy efficient data delivery over wireless local networks. This set is composed of three solutions.
The first solution proposed, i.e.static Slow sTart Exponential and Linear Algorithm (STELA), increases battery lifetime through wise scheduling of the wireless interface card. STELA is a MAC-layer based mechanism which runs on the client side. The novel pro-posed MAC layer solution intelligently adapts the sleeping schedule of the mobile termi-nals radio interface for data transfer over wireless networks in order to reduce the energy consumption while still maintaining high delivery performance. The solution divides the whole process into three phases: slow start, exponential, and linear increase, and adjusts sleeping window of wireless interfaces dynamically according to real time traffic.
Dynamic STELA balances the energy efficiency and delivery quality and employs similar approaches as static STELA. However, the solution adopts an extra traffic modelling algorithm following the data flow which analyzes historical traffic data and estimates the arrival time of the next burst, to additionally improves quality of experience while saving energy for wireless devices.
Besides MAC layer energy saving, energy efficiency can also be achieved in upper lay-ers, for example the choice of transport layer protocol would influence the number of pack-ets transmitted, the retransmission scheme, and the congestion control mechanism, which significantly impact the overall energy consumption. Moreover, adaptive streaming at ap-plication layer can also be wisely chosen according to user requirements. Therefore, the solutions chosen in real time at each layer form a set of parameters which can be adjusted either in favor of energy saving or quality of service. Q-PASTEis proposed as cross-layer solution that achieves energy efficiency for wireless multimedia content delivery without degrading significantly quality of service levels. As part of the cross-layer mechanism, dy-namic STELA is employed at the client side to save energy for the wireless interface, while Packet/ApplicaTion manager (PAT) at application layer helps prolong the interval between
bursts through deliberate traffic shaping at the service gateway. In the protocol stack, mes-sage flow is utilized to pass information among different layers. The cross-layer solution adopts the message exchange scheme in order to make the optimal decision on the sleeping schedule of the wireless interface. The cross-layer solution will not only maintain energy savings achieved by MAC layer modifications, but also improve user quality of experience levels.
1.4
Contributions
The research mentioned in this thesis makes the following four major contributions.
• Static STELA. The first contribution of this research is the static Slow-sTart Ex-ponential and Linear Algorithm for energy saving in wireless networks (STELA), a novel Medium Access Control (MAC) layer power saving scheme for wireless data transmission proposed to achieve energy consumption or high delivery perfor-mance. Studies [16] [17] have proved that traffic flow shows a significant amount of regularity and exhibits burstiness. This means that packets are sent in bursts with relatively short inter-arrival duration while long inter-arrival duration is observed be-tween bursts. STELA, to the best of the author’s knowledge, is the first algorithm to consider not only the bursty nature but also the real time traffic pattern at the MAC layer. For example, the power saving mechanism adopted by [18] employs the expo-nential increase phase to increase sleeping interval between two consecutive bursts, but it does not consider the impact of real time traffic on the threshold value adopted. On the other hand, static STELA employs three different adaptation strategies and adds to the existing slow start and exponential increase phases a novel linear increase stage. The adaptive algorithm renders a significant decrease in energy consumption, and the perceived quality of service is also maintained at high levels. The solution can be configured to either achieve maximum energy efficiency or provide high qual-ity of service, depending on which factor is of greater importance to the users.
• Dynamic STELA. Another contribution made in this thesis is dynamic STELA which adds an additional traffic modelling-based threshold adjusting phase which is employed at the beginning of the establishment of each data flow. It is based on the regularity of traffic as observed in some studies [16] [19], and historical data is used to adjust a proper point which determines the termination of the second phase and initiation of the third phase in STELA. Based on the observation of traffic, STELA is able to predict the arrival pattern of following data burst and switch on the net-work interface in time before traffic arrives. Therefore the interface is awake when data arrives and the degradation in QoS in terms of delay, jitter, PSNR which are introduced by switching off the WNIC is minimized. The threshold adjusting phase guarantees better quality of service provided to the users and at the same time im-proves energy efficiency. Different from static STELA, this solution provides bal-anced performance between energy efficiency and QoS, without the need of user configuration.
• Q-PASTE. The third contribution of this research is Q-PASTE, which is a quality-oriented cross-layer solution for energy efficient multimedia delivery in wireless LAN. Q-PASTE balances the need for: 1) increased energy efficiency/battery life-time and 2) high user quality of experience required in mullife-timedia streaming ap-plications. The cross-layer solution mainly consists of two components. First, the Packet/ApplicaTion manager (PAT) is employed as a novel traffic shaping scheme at the application layer of both the gateway and the client host. According to ex-perimental results shown in [20], traffic bursts not only prolong the sleeping interval of wireless interface, but are also beneficial to efficient energy use and battery life. Therefore, at the service gateway, PAT utilizes first a fast start approach to support smooth multimedia playback, then shapes traffic from the server into bursts to re-duce the wireless transceivers duty cycle for energy efficiency. At client side, PAT performs traffic monitoring and provides the Medium Access Control (MAC) layer with session-specific traffic-related information. Second, dynamic STELA is em-ployed at the MAC layer of the client side with the tuning procedure assisted by
additional information provided by PAT in order to ensure data arrives at the client without serious delays. The solution can be applied to various multimedia streaming applications such as well known online audio-visual services (e.g. YouTube).
• A comprehensive survey. Finally, a comprehensive survey on energy efficient stan-dards and some of the most important state-of-the-art energy saving technologies is also provided as part of this work.
1.5
Report Structure
The remainder of the document is organized as follows. Chapter 2 explores the existing standards related to wireless communications and quality evaluation. The wireless com-munication standards are categorized according to the evolution of technologies. The stan-dards at different network protocol stacks are also presented. Quality evaluation tools used for both quality of service and quality of experience measurement are introduced. Chap-ter 3 investigates some of the most important state-of-the-art energy saving solutions which are classified following the layer structure of the protocol stack. Some solutions which take a cross-layer approach towards energy conservation are also presented. In Chapter 4, the architecture and details of the proposed algorithms are presented, while Chapter 5 explains the testing environment and testing scenarios for each solution. Chapter 6 details the simu-lation results and result analysis through comparison with other solutions and standards. In Chapter 7, the prototype-based testing of Q-PASTE is conducted with results and analysis presented. Finally, Chapter 8 summarizes the work and points out the possible future work and their potential benefits.
Background Technologies
This chapter introduces the background technologies that lead the evolution of wireless communications. It starts with a brief introduction to cellular wireless networks which are categorized according to generations of development witnessed in the last few decades. WLAN, WMAN and WPAN as three classes of broadband wireless technologies that are widely deployed are then presented. Following that is the discussion on protocol stack which is widely used as an implementation of a computer networking protocol suite. More-over, standards that are widely used at each layer of the protocol stack are presented and discussed in relation to energy conservation. Finally, the most widely used tools for mea-suring quality of service and quality of experience levels are introduced.
2.1
Wireless Networks Overview
The past few decades have witnessed an explosive growth of both the Internet and mo-bile telephony services which together lead to the incredibly fast development of wireless networks. Data transmission and reception over wireless networks are built on several pri-mary technologies that are widely supported by mobile devices. These technologies are categorized based on their range into Wireless Wide Area Network (WWAN), Wireless
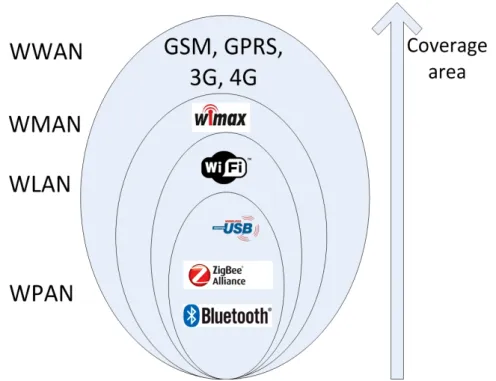
Figure 2.1 Wireless technologies range-based classification
Local Area Network (WLAN), Wireless Personal Area Network (WPAN) and Wireless Metropolitan Area Network (WMAN).
WWAN is a form of wireless network that provides wide range of network access to mobile devices compared to local area networks. It is then categorized in this thesis into several groups of technologies, including 2G, 2.5G, 3G and 4G, based on the timing and generation of development in wireless communications of each standard. Unlike WWAN which supports tens of kilometres of wireless service, WMAN is designed to provide net-work access of up to several kilometres for mobile devices. WLAN serves shorter distance but with higher bitrate, while WPAN is designed for personal area and has the smallest coverage area. A comparison based illustration of each category is depicted in Figure 2.1. These network types will be discussed with more details in the following sections.
2.1.1 Wireless Wide Area Network (WWAN)
2.1.1.1 Second Generation (2G)
The first generation (1G) telephone technologies were designed for analogue voice delivery until they were replaced by the second generation (2G) technologies. There were a number of standards designed across the world independently for 1G which means the equipments were not supported across boundaries of countries or regions. For example,
Nordic Mobile Telephony(NMT) is the first fully automatic cellular 1G phone system, and it was deployed in eastern Europe, Russia etc, while Advanced Mobile Phone System (AMPS) developed by Bell Labs was widely used in the North America and Australia. Replacing 1G, the second generation wireless telephone technologies move from analogue to digital signals and were mainly designed for voice services and slow data transmissions.
Global System for Mobile Communications(GSM) [21] developed by the European Telecommunications Standards Institute (ETSI) is the dominant standard among 2G tech-nologies. It was designed as a replacement for first generation cellular networks and is a standard still in use. Compared with 1G, it provides better call quality and a low cost call alternative, simple messaging service. Moreover it is widely supported, enabling roaming and solving the boundary problem occurred in 1G. However, the maximum cell site range of GSM is only 120 km, although it is expanded from the old limit of 35 km1.
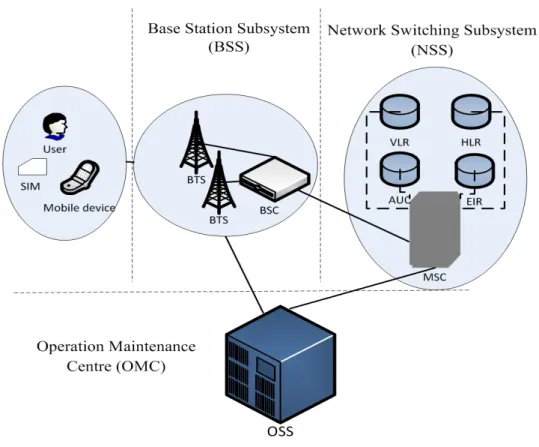
A typical GSM system consists of three parts: base station subsystem, switching sys-tem and operation and maintenance centre. The Base Station Subsyssys-tem (BSS) consists of multiple Base Transceiver Stations (BTS) and a Base Station Controller (BSC) which provides all control functions and physical link between Mobile Service Switching Centre (MSC) and BTS. BTS provides the radio interface with mobile subscribers which are nor-mally mobile devices registered with a Subscriber Identity Module (SIM). The Network Switching Subsystem (NSS) is responsible for connecting calls between a GSM user and another party such as another GSM user. As the core element of the switching subsystem,
Figure 2.2 GSM architecture
MSC is responsible for call setup and maintenance, resource management, call handover and data encryption. Call processing and subscriber information is contained in several databases that are used by the MSC. The databases are divided into Home Location Regis-ter (HLR) which stores permanent data about subscribers, Visitor Location RegisRegis-ter (VLR) which stores temporary information about subscribers, Authentication Centre (AUC) used for user identification and Equipment Identification Register (EIR) which stores data about equipment identity. The Operation Maintenance Centre (OMC) supervises the operation of switching system blocks connected to it. It basically monitors and reports traffic, tak-ing care of call failures. The implementation of OMC is called the Operation and Support System (OSS) connected to all equipment in the switching system and to the BSC. An illustration of the components in a GSM network is shown in Figure. 2.2.
2.1.1.2 Two Point Five Generation (2.5G)
The two point five generation (2.5G) is an extension of the 2G services. The main novelty is the introduction of packet-switched networks into the circuit-switched domain, used in traditional 2G networks. The two widely supported technologiesGeneral Packet Radio Service (GPRS) [22] and Enhanced Data rates for Global Evolution (EDGE) [23] are standards evolved from 2G providing Internet services to existing 2G networks.
GPRS is a technology for GSM networks, which adds packet switching protocols. It was first standardized by the European Telecommunications Standards Institute (ETSI) and is now maintained by the 3rd Generation Partnership Project (3GPP)2. The standard im-proves the efficiency of network resources as information is broken up into packets and re-sources are allocated during the handling of individual packets only. The packet switching feature implies that GPRS provides best effort service instead of the guarantee of quality of service (QoS), provided by circuit switched networks.
3GPP EDGE is sometimes considered as a third generation standard but it is generally deployed on existing 2G networks. It is a technology designed for mobile phones to im-prove data transmission rates. EDGE is compatible with existing GSM networks and offers a maximum speed of 384 kbps to IP-based networks.
2.1.1.3 Third Generation (3G)
The third generation mobile telecommunications (3G) standardized by the International Mobile Telecommunications-2000 (IMT-2000) is a generation of standards designed for wireless communications. It is required that 3G provides a data rate of at least 200 kbps while most 3G services offer higher speed than the requirements.
Universal Mobile Telecommunications System(UMTS) [24], also known as WCDMA (Wideband Code Division Multiple Access) developed by the 3GPP is a widely deployed 3G technology based on GSM networks. It has both circuit switched and packet switched
elements. UMTS achieves higher spectral and bandwidth efficiency through utilization of wide-band code division multiple access. The data transfer rate has been increased to 45 Mbps which is a significant improvement. UMTS specifications deal with three main components of the network: Core Network (CN), The UMTS Radio Access Net-work (UTRAN) and User Equipment (UE). The core netNet-work uses the same core netNet-work standard as GSM/EDGE. Although the same structure is supported which indicates easy migration for existing GSM operators, the cost of purchasing spectrum licenses and over-laying UMTS is high. UTRAN consists of one or multiple base stations which directly provide connection to mobile equipments.
CMDA2000as a family of 3G standards uses Code Division Multiple Access (CDMA) as the multiplexing technique to provide broadband data rate up to 14.7 Mbps3. CDMA2000 transmits on one or several pairs of 1.25 MHz radio channels, while UMTS transmits on a pair of 5 MHz-wide radio channels. Unlike UMTS, CDMA2000 is backward compatible with its former generation known as cdmaOne, which was first standardized in 1993.
2.1.1.4 Fourth Generation (4G)
As a successor of 2G and 3G technologies, 4G is the fourth generation of wireless com-munication standards, the requirements of which have been specified by the International Telecommunications Union (ITU)4. 4G technologies are required to support peak bitrate of 100Mbps for high mobility communications and 1Gbps for low mobility communications. 4G provides a flexible channel bandwidth between 5 and 20 MHz. Another requirement of 4G standards is smooth handover within various types of networks and dynamical resource allocation to improve efficiency and user experience.
3GPP Long Term Evolution [25], normally referred as LTE was developed by the 3GPP to provide higher speed and network capacity. LTE Advanced [26] is the current 3GPP proposal for 4G standards and is an enhancement of the LTE standard. It introduces
3
http://www.qualcomm.com/media/documents/wireless-networks-rev-b-enhanced-mobile-broadband-all,2010.
multicarrier which enables the use of wide bandwidth for high speed data transmissions. Another significant contribution of LTE Advanced is the wise use of advanced topology networks with deployment of low power nodes.
2.1.2 Wireless Metropolitan Area Network (WMAN)
IEEE 802.16 [18] is a set of standards as basic techniques for Wireless Metropoli-tan Area Network (WMAN) and is commercialized under the name Worldwide Inter-operability for Microwave Access(WiMAX). WiMAX was designed to remove line of sight requirements (or passing small obstructions such as buildings etc.) and to provide broadband wireless access up to 50 km for fixed stations and 5-15 km for mobile de-vices. The common architecture of a WMAN is similar to WLAN which consists of access points as central coordinator and mobile devices. But the main differences lie in the protocol specifications thus the data speed and coverage area of each standard. Two standards including 802.16, formally known as 802.16.1, and 802.16.2 were released with an amendment 802.16c at first, followed by the standardization of 802.16a, 802.16-2004 and 802.16e-2005. 802.16e-2005 was approved in 2005 and was announced as being de-ployed around the world in 2009. 802.16e uses Scalable OFDMA to carry data, supporting channel bandwidths of between 1.25 MHz and 20 MHz. It supports adaptive modula-tion at physical layer which means the coding mechanism varies according to the signal condition. Multiple Input Multiple Output (MIMO) which improves communication per-formance by adding antennas at both transmitter and receiver sides is incorporated in the standard. 802.16k was standardized in 2007 as an amendment to IEEE 802.1D, which is an IEEE MAC Bridges standard. 802.16-2009, with amendment 802.16j and extension 802.16j, is standardized in 2009 and is used as the current IEEE 802.16 standard. 802.16m, also known as Mobile WiMAX Release 2 or WirelessMAN-Advanced aims at fulfilling the ITU-R IMT-Advanced requirements on 4G systems.
Table 2.1 802.16 Family
Standard Release
Year
Description
802.16.1 2001 Fixed Broadband Wireless Access (1066 GHz) 802.16.2 2001 Recommended practice for coexistence 802.16c 2002 System profiles for 1066 GHz
802.16a 2003 Physical layer and MAC definitions for 211 GHz 802.16.2-2004 2004 Recommended practice for coexistence
(Mainte-nance and rollup of 802.16.2-2001 and P802.16.2a) 802.16e 2005 Mobile Broadband Wireless Access System
802.16k 2007 Bridging of 802.16 (an amendment to IEEE 802.1D) 802.16-2009 2009 Air Interface for Fixed and Mobile Broadband
Wire-less Access System 802.16j 2009 Multihop relay
802.16h 2010 Improved Coexistence Mechanisms for License-Exempt Operation
802.16m 2011 Advanced Air Interface with data rates of 100 Mbps mobile and 1 Gbps fixed
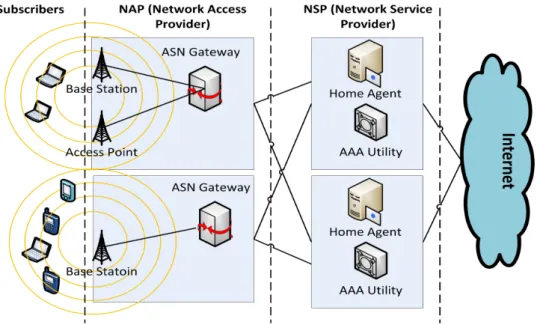
The basic architecture of WiMAX is shown in Figure 2.3. WiMAX consists of four major components: Internet, Network Service Provider (NSP), Network Access Provider (NAP), and subscribers. The Internet provides Internet content to a user/subscriber and connectivity to a NSP. The main function of NSP is to provide IP connectivity services. The NAP is composed of one or more base stations and Access Service Network (ASN) gateways which connect the NAP with NSP. And the subscribers include all user mobile devices, such as mobile phones, PDAs, laptops, etc.
Figure 2.3 WiMAX architecture
2.1.3 Wireless Local Area Networks (WLAN)
WLAN, also known asWireless Fidelity(Wi-Fi), is based on theIEEE 802.11[27] family of standards. WLAN is one of the main wireless communication technologies de-signed for wireless devices. It basically consists of multiple mobile stations including laptops, PDA etc. and an access point which carries data to and from those stations for the purpose of communication, as illustrated in Figure. 2.4.
The standard family has a series of techniques built in the basic protocols. In 1997, the Institute of Electrical and Electronics Engineers (IEEE) created the first standard 802.11-1997[27] within this framework. The standard only supports a maximum bandwidth of 2 Mbps which is far from enough for most applications and therefore was substituted by other standards very soon. 802.11b[28], standardized in 1999, is the first widely accepted stan-dard. 802.11b increases network bandwidth to 11 Mbps, which is comparable to Ethernet. 802.11b operates in the unregulated 2.4 GHz ISM band which means all channels overlap and serious interference with other devices using the same frequency such as microwave oven and Bluetooth can occur. To prevent signal interference, a signalling method such as Direct-Sequence Spread Spectrum (DSSS) is employed by 802.11b. On the other hand,
Figure 2.4 WLAN architecture
due to the frequency used, 802.11b is widely used due to low cost in manufacturing and production. At the same time when 802.11b was created, another amendment to 802.11 called 802.11a [29] was developed by IEEE as well. 802.11a provides up to 54 Mbps of bandwidth and uses a regulated frequency spectrum around 5GHz. Higher frequency indicates shorter coverage area and low ability of penetrating obstructions and more im-portantly higher costs, and therefore 802.11a is more frequently used in business networks, rather than private deployments. 802.11g[30] is a standard created in 2003 which is de-signed to combine the advantages of both 802.11a and 802.11b. It supports high data rate of up to 54 Mbps and operates in the 2.4 frequency to cover wider range. It applies Orthogo-nal Frequency-Division Multiplexing (OFDM) to solve the problem of sigOrthogo-nal interference.
802.11n [31], standardized in 2009, is an amendment to the IEEE 802.11-1997 standard and achieves a significant improvement in data rate over the previous standards. It adds to existing standards Multiple Input Multiple Output (MIMO) which adds antennas at both sides of the communications in order to improve communication performance. Multiple wireless signals are utilized to offer higher signal intensity and greater range. 802.11 also doubles the channel width at the physical layer which enables operation in both 5 GHz and 2.4 GHz band. The range of a Wi-Fi network is normally 30-100m. However, the deploy-ment of 802.11n involves higher costs and some difficulties due to the different technology
used. The development of 802.11 standards and general specification of each standard is shown in Table 2.2.
The IEEE 802.11 Task Group ”k” recently developed an amendment to IEEE 802.11 wireless LAN standard, which is referred to as 802.11k [32]. IEEE 802.11k provides information to the wireless devices so that they can find the best available access point to associate with. It is one of the key industry standards that enables seamless basic service set transition in WLAN. It was designed to improve the way traffic is distributed within a WLAN. In traditional WLAN, devices are always connected to the AP with the strongest signal, which might lead to overloading on one AP. To solve the problem, a wireless device is connected to one of the under-utilized AP if the AP with the strongest signal is loaded full.
IEEE 802.11s [33] is another amendment to IEEE 802.11 standardized in 2011 and was designed for mesh networking. It defines how wireless devices can be connected among themsevels to organize a mesh network, which is often used for static topologies and ad hoc networks. IEEE 802.11s inherently depends on one of the existing 802.11 standards, such as 802.11a, 802.11b, 802.11g or 802.11n, for the purpose of carrying the actual traffic and requires an additional routing protocol.
2.1.4 Wireless Personal Area Network (WPAN)
Wireless Personal Area Network (WPAN) is a wireless network used for short range communications. Multiple types of technologies support WPAN including ZigBee [34], Bluetooth [35] and so on. One of the mostly applied technologies in practice isBluetooth
defined by IEEE 802.15 standard. It is a wireless technology designed to provide a uni-versal short-rage data exchange capability with high level of security. The motivation of WPAN Bluetooth is based on the fact that most people spend the majority of the day within 10m of some kind of Internet access port 5. A typical Bluetooth network consists of a dynamic group of less than 255 devices connected within themselves without any central
5Towards 4g: wpan and the person-centered concept. http:
Table 2.2 802.11 Family
Standard Release Description
Year
802.11-1997
1997 First 802.11 standard, very low data rate
802.11b 1999 Pros: low cost, modest signal range. Cons: signal interference, low data rate 802.11a 1999 Pros: fast speed, regulated frequency prevents signal interference. Cons: high cost, short signal range
802.11g 2003 Pros: fast speed, good signal range. Cons: high cost, signal interference 802.11n 2009 Pros: fast speed, best signal range,
more resistant to signal. Cons: high cost
802.11k 2008 Improves seamless basic service set transition in WLAN
802.11s 2011 Supports mesh networking
Figure 2.5 Bluetooth architecture
router, as illustrated in Figure 2.5.
Bluetooth [35] uses radio technology frequency-hopping spread spectrum, and data is divided into chunks before transmitted in the range of 2400-2483.5 MHz. The standard allows data exchange between portable and stationary devices which can share up to 720 kbps of capacity within 10 m. Bluetooth, designed as a replacement of wired communica-tions, avails of low power consumption short range data exchange on low-cost transceiver
Figure 2.6 Wireless technologies– speed VS. mobility
microchips devices6.
Zigbee [34], as another widely used technology, provides a defined rate of 250 kbit/s, and it is best suited for periodic or intermittent data or a single signal transmission. It is mostly deployed for short-range wireless data transfer with low data rate, while providing long battery life. Zigbee is a simpler and less expensive solution than other WPANs, such as Bluetooth. The technology is widely deployed in wireless light switches, electrical meters with in-home-displays, traffic management systems etc.
Figure 2.6 provides an overview of the wireless technologies in terms of mobility and speed. It can be seen that traditional wireless cellular networks such as GSM, UMTS are relatively low in speed while providing high mobility, and wireless technologies such as WMAN and WLAN provides much faster data speed but with lower mobility. WPAN provides only stationary or pedestrian mobility and relatively low speed but still achieves popularity through easy deployment. 4G techniques such as LTE, when compared with other solutions, are more advanced in terms of both mobility and data speed at compensa-tion of high cost.
2.2
Network Protocol Stack
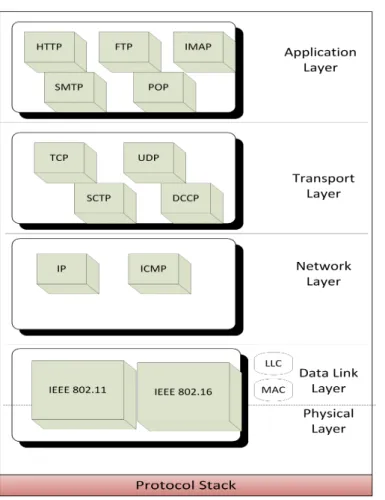
Network rotocol stack provides an overall view of the implementation of computer networking protocol suite, and simplifies the design and evaluation of each individual pro-tocols in the context of other propro-tocols. Within the stack, propro-tocols are divided into dif-ferent layers, which only relate to their upper and lower counterparts. Protocol stack uses encapsulation to provide abstraction of protocols and services. Generally speaking, the information is passed down from higher to immediate lower layers for being further en-capsulated at each level before being sent out at the sender side, and received data at the receiver side is translated at each corresponding level and forwarded up from the lowest to the highest layers.TCP/IPprotocol suite consists of four [36] or five layers [37] depending on preferences. The four layer model consists of application layer, transport layer, Internet layer and Link layer, while the five layer model is comprised of application layer, transport layer, network layer, data link layer and physical layer. The structure and main standards at each layer of the latter model are shown in Figure 2.7. The Open Systems Intercon-nection (OSI) model is another widely used model and divides the internal functions of a communication system into seven layers including physical layer, data link layer, network layer, transport layer, session layer, presentation layer and application layer. Next, different protocols are discussed in details at each layer.
2.2.1 Application Layer Standards
Application layer protocols on the protocol stack reside the closest to client users, and interact directly with the users and are influenced directly by different requirements of users. Protocols on this layer provide host-to-host connections and service requirements of different applications. There are several widely used protocols at this layer which will be discussed in more details.
The Hypertext Transfer Protocol(HTTP) is the basis of data transfer in the World Wide Web. The version in common use is standardized in RFC 2616 [38], and runs on top
Figure 2.7 TCP/IP protocol suite
of reliable protocols at transport layer such as Transmission Control Protocol (TCP). HTTP mainly defines how the data should be formatted, transferred and the proper way of inter-action between request on the client side and response on the server side. Although UDP is used by many streaming protocols, it may sometimes be blocked by the firewall. In this case, HTTP based streaming provides a solution as it works on the top of TCP and requires a simple web server. For this reason, HTTP streaming has one of the largest penetration and in the market HTTP traffic accounts for a large fraction of Internet bandwidth used for streaming.
The File Transfer Protocol(FTP) is another widely deployed protocol used for file transfer. The protocol is standardized in RFC 0959 [39]. It provides supports for sepa-rate control and data connections between client and server. The main function of control connection is to perform user authentication and command exchange and remains open