_____________________________________________________________________________________________________ *Corresponding author: E-mail: [email protected];
www.sciencedomain.org
Study of Association between Platelet Function and
Anthropometry of Blood Donors in a Single
Institution
Somesh Raju
1, Narsingh Verma
2*, Sunita Tiwari
2, Tulika Chandra
3,
Rina Kumari
4and Kshitij Bhardwaj
21
GCRGIMS, Lucknow, U.P, India. 2
Department of Physiology, King George’s Medical University, Lucknow, UP, India. 3
Department of Transfusion Medicine, King George’s Medical University, Lucknow, UP, India. 4
Sahara College of Nursing, Lucknow, UP, India.
Authors’ contributions
This work was carried out in collaboration between all authors. Author SR managed the literature searches, experimental process and compilation of data. Authors NV and ST designed and supervised the study. Author TC managed the experimental process and supervised the data collection process. Author RK analyzed and illustrated of data. Author KB drafted the manuscript and performed the proof reading process. All authors read and approved the final manuscript.
Article Information
DOI: 10.9734/IBRR/2016/28567 Editor(s): (1) Shinichiro Takahashi, Department of Laboratory Medicine, Tohoku Medical and Pharmaceutical University Hospital,
Sendai, Japan. (2)Armel Hervé Nwabo Kamdje, University of Ngaoundere-Cameroon, Ngaoundere, Cameroon. Reviewers: (1) Burak Uz, Gazi University Faculty of Medicine, Turkey. (2)Jorge Paredes Vieyra, Universidad Autonoma De Baja California Campus Tijuana, Mexico. (3)Anonymous, G. Papanikolaou Hospital, Greece. (4)Bruno Deltreggia Benites, Hematology and Hemotherapy, University of Campinas, Brazil. Complete Peer review History:http://www.sciencedomain.org/review-history/17115
Received 26th July 2016 Accepted 21st October 2016 Published 3rd December 2016
ABSTRACT
Objective: To determine the association between obesity indices e.g. body mass index, waist
circumference and platelet function in healthy blood donors.
Methodology and Procedures: A cross-sectional study conducted on 100 healthy blood donors in
Transfusion Medicine Department of King George’s Medical University, Lucknow. Subject selection based on inclusion and exclusion criteria. Anthropometric measures were recorded and sample of blood taken after blood donation and platelet count and platelet release test performed by specific
method. Collected data analysed by Student’s t tests to assess the associations.
Results: According to body mass index, 44% subjects have normal BMI and remaining 27% and
24% of the subjects have BMI within range from 23 to 24.9 and >25 respectively. Subjects based on waist circumference, 54% of subject have WC <85.9 cm and 21% of the subject have WC >90 cm. platelet count shows significant association with body weight and waist circumference of the healthy blood donor subject. However, no significant correlation was found between platelet function (Platelet release test) and anthropometric variables.
Conclusion: Anthropometric variables like body weight, body mass index, and waist circumference
can give a quantitative idea of platelet function including platelet count in blood of normal healthy donors.
Keywords: Body mass index; waist circumference; platelet count; platelet release test.
1. INTRODUCTION
Platelets are essential for primary hemostasis and endothelial repair, but also play a key role in atherogenesis and thrombus formation [1]. Platelet counts are hematologic parameters that can provide useful information regarding the risk for various health conditions. Platelets function mainly in activating the blood clotting mechanism and are also markers of inflammation. Platelet play major role in the increased cardiovascular risk, which show an increased activation and a reduced sensitivity to the physiological and pharmacological antiaggregating agents [2].
Obesity, defined by the World Health
Organization [3] as a BMI ≥ 30 kg/m2, is also associated with cardiovascular diseases and other outcomes such as premature death, type II diabetes, osteoarthritis, sleep apnea, respiratory problems, and some cancers [4].
According to Seidell J et al. [5] BMI is not a reliable measurement of body composition in individuals particularly in older and younger people. Waist circumference (WC) is commonly used to assess abdominal obesity. Individuals with increased WC values are more likely to have hypertension, type 2 diabetes, dyslipidemia and the metabolic syndrome than individuals with normal WC values regardless of weight status [6,7].
According to the guidelines of the Indian Council of Medical Research (ICMR) and the National Institute of Nutrition (NIN) the cut-offs for waist circumstances will now be 90 cm for Indian men (as opposed to 102 cm globally) and 80 cm for Indian women (as opposed to 88 cm at the international level). Obesity is associated with elevated leptin levels, and leptin affects platelet function, increasing the risk for thrombotic complications in obese individuals [8-10].
No studies have been identified who investigated the association of platelet counts with obesity. Decreased platelet counts have been observed among diabetics, [11] however two studies disagree with these results. Chen et al. [12] found that platelet counts were significantly increased among insulin-resistant participants compared with insulin-sensitive participants. Davi et al. [13] demonstrated platelet activation in obese individuals by measuring urine excretion of a thromboxane B2 (TxB2) metabolite (11-dehydrothromboxane B2, 11- dehydro TxB2). In contrast, other studies found no evidence of increased platelet activation in obese individuals, [14] in obese and overweight women [15], in overweight prediabetics [16].
The understanding of change in hematologic indices and platelet indices - platelet count, platelet function according to anthropometric variables in healthy blood donor’s is limited. Aim of this study is to evaluate the relationship between platelet function with anthropometric measurements of different blood donor groups as these parameters affect the response of the patient receiving the transfusion. Blood donors of Indian origin will give reliable and valuable data regarding the quality of blood units for patients with special requirement. It can help in forming new protocol in transfusion medicine.
2. MATERIALS AND METHODS
weight 45 kg or more, pulse rate: 60 to 100 per minute and regular, blood pressure: systolic 100 to 180 mm Hg; diastolic 50 to 100 mm of Hg [17]. Exclusion criteria were: subjects having weight above 70 kg and donors with previous transfusion within 6 month or previous donation within 3 month. Donor with known cardiac problem, endocrinal disorder, thyroid disorder, diabetes (on insulin therapy), hypertension, subjects undergoing medication like non-steroidal anti-inflammatory drugs (NSAIDs), steroids, anticancer drugs, were also excluded from the study. Physical parameters of donors were measured using standard protocol: height (in meter), weight (in kilogram), waist circumference (in centimeter) and body mass index (kg/m2) was calculated using the following formula.
BMI= weight (kg)/ (height in meter) 2 [3]
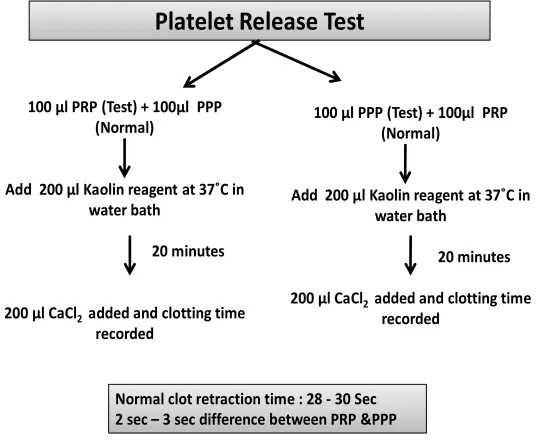
After donation of 350 ml of blood, 5 ml of blood sample were collected for analysis. Analysis done by well calibrated cell counters and also crossed checked by Rees-Ecker method of cell count under cell counting chamber (Neubauer chamber). Platelet function was assessed by platelet factor 3 (PF-3) tests or platelet release test. This tests the antiplatelet activity of serum which is used to detect circulating antiplatelet antibodies. This test compares the clot retraction
time between platelet rich and platelet poor plasma by adding Kaolin reagent and calcium chloride in both solutions separately. Shortening of clotting time results from release of Hageman factor, plasma thromboplastin antecedent (PTA), coagulation factor and release of platelet factor-3 (PF-3) and prolongation of clotting time may be due to reduced availability of PF-3.
Donors blood (3 ml)
Centrifuge in cryofuge 6000 at 1750 rpm for 8 minutes at 22°C
Platelet rich plasma (PRP)
PRP again centrifuged at 3850 rpm for 8 minutes
Platelet poor plasma (PPP)
Fig. 1. Flow chart showing preparation of platelet rich and platelet poor plasma
100 µl PRP (Test) + 100µl PPP (Normal)
Add 200 µl Kaolin reagent at 37˚C in water bath
20 minutes
200 µl CaCl2 added and clotting time recorded
Platelet Release Test
100 µl PPP (Test) + 100µl PRP (Normal)
Add 200 µl Kaolin reagent at 37˚C in water bath
20 minutes
200 µl CaCl2 added and clotting time recorded
Normal clot retraction time : 28 - 30 Sec 2 sec – 3 sec difference between PRP &PPP
Classification of Subjects
Group-1 According to weight.
a) 50 – 60 kg b) 61 – 70 kg
Group-2 According to body mass index [18]
a) Underweight ≤ 18.5 b) Normal 18.5-22.9 c) Overweight 23-24.9 d) Obese ≥ 25
Group-3 According to waist circumference [7,19]
a) Underweight < 85 cm b) Normal 85-90 cm c) Overweight > 90 cm
3. OBSERVATION AND RESULTS
In our study out of 100 subjects, frequency of subject according to body mass index showed 44% subjects having normal BMI and remaining 27% and 24% of the subjects have BMI within normal range and >25 respectively (Table 1). Distribution of subjects based on waist circumference showed that 54% of subjects have WC <85.9 cm, 21% of the subjects have WC >90 cm (Table 2).
Mean of platelet count according to weight is 1.92 (±0.43) in 50-60 kg group and 2.01 (±0.53) in 60-70 kg group and there is significant association (p= 0.004) between them. There is found no association between platelet function and weight of study subjects (p= 0.86) (Table 3). Mean of platelet count according to body mass index of subjects showed 1.96 (SD 0.41) in <22.9 group and 2 (SD 0.57) in >22.9 group. There is found no association between platelet function and body mass index of study subjects (Table 4).
Distribution of subjects based on waist circumference (WC) showed that 54% of
subjects have WC <85.9 cm, 21% of the subjects have WC >90 cm (Table 2). Mean of platelet count according to WC is 1.98 (SD 0.51) in <90 cm and 1.95 (SD 0.44) in >90 cm group accordingly. Platelet count of study subjects showed significant association with WC and there is found no association with platelet function (Table 5).
Table 1. Frequency distribution of subjects based on BMI (Body Mass Index)
Body Mass Index (BMI)
Parameter f %
1 < 18.5 5 5%
2 18.5 - 22.9 44 44%
3 23 -24.9 27 27%
4 > 25 24 24%
Table 2. Frequency distribution of subjects based on waist circumference
Waist circumference
Parameter F %
1 < 84.9 cm 54 54%
2 85 - 90 cm 25 25%
3 > 90 cm 21 21%
4. DISCUSSION
Frequency distributions of subjects based on weight parameter signifies that the subjects who come for donation was mostly overweight or obese. It may be due to the fact that many donor having lesser weight do not come for donation due to myth that blood donation makes them weak. Study performed by Booth M et al. supported our finding, in his study he found that prevalence of obesity in men based on BMI and waist circumference combined was greater for men. According to waist circumference (WC), 25% of subjects were having normal waist circumference and 21% of subjects had waist circumference more than 90 cm.
Table 3. Association of weight of subject with platelet parameters
P
a
ra
m
e
te
rs 50-60 kg 60-70 kg Weight T P R
Mean SD Mean SD
Platelet 1.92 0.43 2.01 0.53 0.81 0.004 0.76
Table 4. Association between body mass index of subjects and platelet parameters
P
a
ra
m
e
te
rs
o
f
Mean
Platelet 1.96
PRT 2.19
Table 5. Association between waist
Graph 1. Subjects based on BMI (Body
Mean value of platelet count according to weight showed strong positive linear relation. While association with body mass index (BMI) showed increase in platelet count but this change is not statistically significant whereas it showed significant association with waist circumference. In contrast to our findings Tangorra et al. and Meade et al. [20] found no correlation between obesity and platelet count. Whereas Ferreira et al. [21] found weak correlation of obesity with platelet count. Increased platelet count in obese subjects may be due to higher
0 5 10 15 20 25 30 35 40 45
< 18.5 18.5 - 22.9
P
a
ra
m
e
te
rs
Mean
Platelet 1.98
PRT 2.89
Association between body mass index of subjects and platelet parameters
BMI
<22.9 >22.9 t P
Mean SD Mean SD
1.96 0.41 2 0.57 0.35 0.72
2.19 0.23 2.19 0.22 0.03 0.97
Table 5. Association between waist circumference of subjects and platelet parameters
Subjects based on BMI (Body Mass Index)
Mean value of platelet count according to weight showed strong positive linear relation. While association with body mass index (BMI) showed increase in platelet count but this change is not statistically significant whereas it showed on with waist circumference. In contrast to our findings Tangorra et al. [19] ] found no correlation between obesity and platelet count. Whereas
found weak correlation of obesity with platelet count. Increased platelet count in obese subjects may be due to higher
body fat mass which itself as a low subclinical inflammatory condition. A large proportion of IL-6 in the circulation originates from the adipose tissue that in turn may contribute to atherogenesis and thrombosis, by promoting inflammation. There are some studies which support our findings like Luanda C et al. [22] performed a study on police officers, found no association between platelet count and obesity in male officers whereas observed significant association between obesity and waist circumference in female officers.
23 -24.9 > 25
Body Mass Index (BMI) f Waist circumference
< 90 cm > 90 cm T P
Mean SD Mean SD
0.51 1.95 0.44 0.26 0.001
0.23 2.19 0.24 0.04 0.96
Association between body mass index of subjects and platelet parameters
R
0.72 0.46
0.97 0.21
circumference of subjects and platelet parameters
body fat mass which itself as a low-grade subclinical inflammatory condition. A large 6 in the circulation originates om the adipose tissue that in turn may contribute to atherogenesis and thrombosis, by promoting inflammation. There are some studies which support our findings like Luanda C et al. ] performed a study on police officers, found telet count and obesity in male officers whereas observed significant association between obesity and waist
Body Mass Index (BMI) f R
0.001 0.67
Graph 2. Association of platelet function (PRT) with Weight, BMI & Waist circumference
Platelet function is slightly compromised with increase in weight but this was not statistically significant and platelet function showed no association with BMI, whereas association of waist circumference with platelet function was compromised with increase in WC and change in platelet function shows weak correlation with WC. Platelet function was not affected by increasing obesity. Studies of Tangorra et al. [19] and Meade et al. [20] support our finding as they also demonstrated that there was no correlation between obesity and the susceptibility of platelets to aggregating agents. The ambiguity exists in the literature regarding the role of platelet activation in obese individuals. Davi et al. [13] and Licata et al. [14] used 11-dehydro-TxB2 excreted in urine to evaluate platelet activation and observed increased levels of excreted 11-dehydro-TxB2 in obese compared to non obese women associated with android obesity. In the present study we studied the platelet function by assessing the platelet factor 3 (PF-3) availability in donor’s blood. Our study revealed no evidence of change in platelet activation in obese subjects despite the fact that obese subjects exhibited chronic inflammation. Finding were supported by studies of Chandra T, et al. [23] who demonstrated that the mean value of platelet count, platelet factor-3 and platelet aggregation showed no significant difference in additive solution whereas PF-3 showed significant
difference on day 7 without additive solution. Studies of Samocha D, et al. [24] also support
our statement as he declared in his study that obesity is not associated with increased platelet activation. However study done by Lazarus et al. [25] found significant fall in donor’s hematocrit, mean platelet count and platelet distribution width decreased significantly after each plasmapharesis.
5. CONCLUSION
In the present study; platelet count shows significant association with body weight and waist circumference of the healthy blood donor subject. However, no significant correlation was
found between platelet function and
anthropometric variables. Authors results show no association between the studied parameters and platelet function.
COMPETING INTERESTS
Authors have declared that no competing interests exist.
REFERENCES
1. Thompson CB, Jakubowski J, Quinn G, Deykin D, Valeri R. Platelet size and age
0 10 20 30 40 50 60
< 2
sec 2 -3
sec > 3
sec < 2
sec 2 -3
sec > 3
sec < 2
sec 2 -3
sec > 3
sec < 2
sec 2 -3
sec > 3
sec < 2
sec 2 -3
sec > 3
sec < 2
sec 2 -3
sec > 3
sec < 2
sec 2 -3
sec > 3
sec < 2
sec 2 -3
sec > 3
sec < 2
sec 2 -3
sec > 3
sec
50-60 KG 60-70 KG > 18.5 18.5-22.9 23-24.9 > 25 < 85 Cm 85-90 Cm > 90 Cm
WEIGHT BMI WAIST CIRCUMFERENCE
PLATELET RELEASE TEST (PRT)
determine platelet function independently. Blood. 1984;63:1372–1375.
2. AnfossiI G. Russo M. Platelet dysfunction in central obesity Diabetes Unit, Department of Clinical and Biological Sciences of the Turin University, San Luigi Gonzaga Faculty of Medicine, San Luigi Gonzaga Hospital, I-10043 Orbassano, Turin, Italy.
3. World Health Organization. Obesity: Preventing and managing the global epidemic: Report of a WHO consultation on obesity. Geneva, Switzerland: World Health Organization; 1998.
4. Kruger J, Bowles R, Jones D, Ainsworth B, Kohl W. Health-related quality of life, BMI and physical activity among US adults (≥18 years): National Physical Activity and Weight Loss Survey, 2002. Int J Obes (Lond). 2007;31:321–7.
5. Seidell C, Meinders E, Kok P. The value and limitations of the body mass index (BMI) in the assessment of the health risks of overweight and obesity. Ned Tijdschr Geneeskd. 2004;148(48):2379-82.
6. Janssen I, Heymsfield S, Allison D, Kotler D, Ross R. Body mass index and waist circumference independently contribute to the prediction of nonabdominal, abdominal subcutaneous and visceral fat. Am J Clin Nutr. 2002;75:683-8.
7. Misra A, Vikram N, Gupta R, Pandey M: Waist circumference cutoff points and action levels for Asian Indians for identification of abdominal obesity. Int J Obes (Lond). 2006;30(1):106-11.
8. Konstantinides S, Schafer K, Loskutoff J. The prothrombotic effects of leptin: Possible implications for the risk of cardiovascular disease in obesity. Ann N Y Acad Sci. 2001;947:134–41.
9. Konstantinides S, Schafer K, Koschnick S, Loskutoff J. Leptin-dependent platelet aggregation and arterial thrombosis
suggests a mechanism for
atherothrombotic disease in obesity. J Clin Invest. 2001;108:1533–4.
10. Tungtrongchitr R, Pongpaew P, Phonrat B, Tribunaytkul S. Leptin concentration in relation to body mass index (BMI) and hematological measurements in Thai obese and overweight subjects. Southeast Asian J Trop Med Public Health. 2000; 31(4):787-94.
11. Brown S, Hong Y, Belder A.
Megakaryocyte ploidy and platelet
changes in human diabetes and
atherosclerosis. Arterioscler Thromb Vasc Biol. 1997;17:802–7.
12. Chen LK, Lin MH, Chen ZJ, et al. Association of insulin resistance and hematologic parameters: Study of a
middleaged and elderly Chinese
population in Taiwan. J Chin Med Assoc. 2006;69:248–53.
13. Davi G, Guagnano T, Ciabattoni C. Platelet activation in obese women: Role of inflammation and oxidant stress. Journal of the American Medical Association. 2002; 288(16):2008–2014.
14. Licata G, Scaglione R, Giammarresi C, Davi G. No evidence of platelet activation in obesity. Thrombosis and Haemostasis. 1993;70(3):544.
15. Dogru T, Tasci I, Sonmez A. The plasma levels of soluble P-selectin in subjects with prediabetes. International Journal of Clinical Practice. 2006;60(9):1048–1052. 16. Blood donor selection. Guidelines on
assessing donor suitability for blood donation. Annex 3. Geneva: World Health Organization; 2012.
[17 August 2012].
17. New revised BMI criteria for Indian population jointly released on October 2008 by Diabetes Foundation of India (DFI), All-India Institute of Medical Science (AIIMS), Indian Council of Medical Research (ICMR), National Institute of Nutrition (NIN).
18. Obesity criteria based on waist
circumference in Indian population by National Institute of Nutrition (NIN); 2008. 19. Tangorra A, Ferretti G, Curatola G. Altered
properties of platelet membrane in
childhood obesity. Biochemistry
International. 1988;17(5):837–846. 20. Meade T, Vickers M, Thompson S, Stirling
Y, Haines A, Miller G. Epidemiological characteristics of platelet aggregability. British Medical Journal. 1985;290(6466): 428–432.
21. Nascimento C, Ferreira L, Bras R.
Relationship between lipid and
hematological profiles with adiposity in obese adolescents. Hematol Hemoter. 2013;35(13):163-164.
among police officers. Obesity (Silver Spring). 2007;15(11):2846-54.
23. Chandra T, Gupta A, Kumar A. In vitro
function of random donor platelets stored for 7 days in composol platelet additive solution. Asian Journal of Transfusion Science. 2011;5(1).
24. Samocha D, Justo D, Rogowski O. Platelet counts and platelet activation markers in
obese subjects. Hindawi Publishing Corporation Mediators of Inflammation. 2008;Article ID 834153:6.
25. Lazarus E, Browning J, Norman J, Oblitas J, Susan F. Sustained decreases in platelet count associated with multiple, regular plateletpheresis donations. Transfusion. 2001;41:756-61
_________________________________________________________________________________
© 2016 Raju et al.; This is an Open Access article distributed under the terms of the Creative Commons Attribution License (http://creativecommons.org/licenses/by/4.0), which permits unrestricted use, distribution, and reproduction in any medium, provided the original work is properly cited.
Peer-review history: