DOI 10.17148/IJIREEICE.2015.3538
Artificial Neural Network Controlled
DSTATCOM for Power Quality Improvement
S. Sherin JasperM.E. Department of Power electronics and drives, Sri Shakthi Institute of engineering and technology, Coimbatore, Tamil Nadu. India
Abstract: The paper intends to develop the artificial neural network control algorithm for the control of DSTATCOM
for the improvement of power quality. The presence of nonlinear loads makes the voltage to be deviated and current to be distorted from its sinusoidal waveform quality. Thus harmonics elimination, load balancing and voltage regulation is the heavy task that has to be accomplished to maintain the quality of the power. The performance of any device depends on the control algorithm used for the reference current estimation and gating pulse generation scheme. Thus the artificial neural network based Back Propagation (BP) algorithm has been proposed to generate the triggering pulses for the three phase H bridge inverter (DSTATCOM).The fundamental weighted value of active and reactive power components of load currents which are required for the estimation of reference source current is calculated by using BP-based control algorithm. Based on the difference of the target voltage and the generated voltage, the triggering pulse for the inverter is obtained by the BP algorithm. Then the voltage is injected at the point of common coupling to compensate the reactive power. Thus by regulating the voltage and compensation of reactive power, the power quality can be improved. The simulation modelling of the Back propagation algorithm controlled DSTATCOM and the PWM controlled DSTATCOM and the comparative analysis of the algorithms is presented in this paper.
Index Term: DSTATCOM, Artificial Neural Network, Back propagation (BP) control algorithm, Reference current
Estimation, Power quality.
I. MOTIVATION
Power quality in distribution systems affects all the electrical and electronics equipment that are connected. This measures the deviation in the measurement of frequency, current and Voltage of the system. The use of power converters in power supplies, adjustable speed drives, is continuously increasing in recent years. This equipment draws harmonics currents from AC mains and increases the supply demands. The classification of loads includes linear (lagging power factor loads), nonlinear (current or voltage source type of harmonic generating loads), unbalanced and mixed types of loads. The power quality problems associated with these loads include, load unbalancing, harmonics, high reactive power burden, voltage variation.
The power quality problems are compensated in a distribution system by the Custom Power devices. These custom power devices are classified as the DSTATCOM (Distribution Static Compensator), DVR (Dynamic Voltage Restorer) and UPQC (Unified Power Quality Conditioner). The power quality at the Point of common coupling is governed by standards such as IECSC77A , IEEE-519-1992, IEEE-1531-2003 and IEC- 61000, etc.
The effectiveness of DSTATCOM depends upon the control algorithm used for generating the switching signals for the voltage source converter and value of interfacing inductors. Many control algorithms are reported in the literature based on the instantaneous reactive power theory, deadbeat or predictive control instantaneous
symmetrical component theory nonlinear control
technique , modified power balance theory, enhanced phase locked loop technique, Adaline control technique, synchronous reference frame control technique, ANN and fuzzy based controller, SVM based controller, correlation and cross-correlation coefficients based control algorithm for the control of DSTATCOM. In this Paper, the designed system will be applied to detect transient voltage in electrical power systems. The problem of power quality is detected by artificial neural network based BP algorithm. The performance of the designed system will be tested through a simulation platform designed in MATLAB/Simulink.
II. BLOCK DIAGRAM OF ANN CONTROLLED
DSTATCOM
The block diagram of the proposed system consists of the three phase supply supplying the nonlinear load, DSTATCOM block, interfacing inductor, and the DSTATCOM controller. The DSTATCOM controller used in this project is the Back Propagation method, which is the neural network controlled algorithm.
Figure 1: Block diagram of the ANN controlled DSTATCOM
III. DSTATCOM
The D-STATCOM is a three phase shunt connected reactive power compensation equipment, whose output can be varied so as to maintain control of specific parameters of the electric power system by the generation and /or absorption of the reactive power. The D-STATCOM consists of three phase GTO/IGBT voltage source inverter (VSI), a coupling transformer with a leakage reactance and DC capacitor. The DSTATCOM topologies can be classified based on of switching devices, use of transformers for isolation, use of transformers for neutral current compensation.
The ac voltage difference across the leakage reactance power exchange between the Power system and the DSTATCOM at the bus bar can be regulated to improve the voltage profile of the power system. This constitutes the primary duty of the DSTATCOM. However a secondary damping function is added in to the D-STATCOM for enhancing power system oscillation stability.
The D-STATCOM employs solid state power switching devices and provides rapid controllability of magnitude and the phase angle of the phase voltages. The D-STATCOM provides operating characteristics that of the rotating Synchronous compensator without the mechanical inertia. The D-STATCOM has an inverter to convert the
DC link voltage Vdc on the capacitor to a voltage source of
adjustable phase and magnitude. Therefore the D-STATCOM can be treated as a voltage controlled source or current controlled source.
Figure 2: Circuit Diagram of VSC- Based DSTATCOM A voltage source converter (VSC)-based DSTATCOM is connected to a three phase ac mains feeding three phase linear/nonlinear loads with internal grid impedance. The device is realized using six IGBTs (insulated gate bipolar transistors) switches with anti-parallel diodes. Three phase loads may be a lagging power factor load or an unbalance load or a nonlinear load. A RC filter is connected to the system in parallel with the load and the compensator to reduce switching ripples in the PCC voltage injected by switching of DSTATCOM. For reducing ripples in compensating current, interfacing inductors are used at AC side of VSC. The performance of DSTATCOM depends upon the accuracy of harmonic current detection. For
controlling the DSTATCOM, the Back propagation, a neural network based control algorithm is used.
The DSTATCOM is operated for the compensation of lagging power factor balanced load to correct the power factor at source side or to regulate the voltage at PCC. In ZVR mode, DSTATCOM injects currents to regulate the PCC voltage at the desired reference value of the voltage and the source currents may be leading or lagging currents depending on the reference value of PCC voltage.
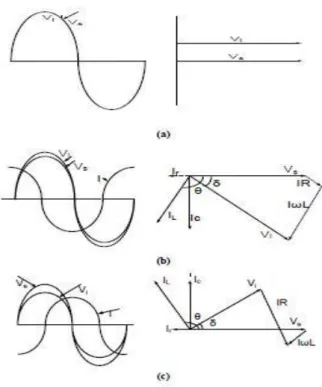
The three basic operation modes of the D-STATCOM for
the output current, I vary depending upon Vi.
Figure 3: Operation of DSTATCOM (a) No load mode
(Vs=Vi),(b) Capacitive mode, (c) Inductive mode
The DSTATCOM currents (iCabc) are injected as required
compensating currents to cancel the reactive power components and harmonics of the load currents so that loading due to reactive power component/harmonics is reduced on the distribution system. The controller of the D-STATCOM is used to operate the inverter in such a way that the phase angle between the inverter voltage and the line voltage is dynamically adjusted so that the D-STATCOM generates or absorbs the desired VAR at the point of connection. The phase of the output voltage of the
inverter Vi, is controlled in the same way as the
distribution system voltage.
The DSTATCOM is operated for the compensation of lagging power factor balanced load to correct the power factor at source side or to regulate the voltage at the point of common Coupling.. In ZVR mode, DSTATCOM injects currents to regulate the PCC voltage at the desired reference value of the voltage and depending on the reference value of PCC voltage the source currents may be leading or lagging currents.
IV.DSTATCOM VOLTAGE CONROLLER
The aim of the control scheme is to maintain constant voltage magnitude at the point where a sensitive load is connected. urbances. The control system only measures the r.m.s voltage at the load point, i.e., no reactive power measurements are required. The VSC switching order is based on a sinusoidal PWM technique which offers simplicity and good response. PWM methods offer a more flexible option for a low power application which is the existing system. Thus the new approach of using the artificial neural network controlled controller for DSTATCOM is proposed in this project.
A. EXISTING SYSTEM: Sinusoidal Pulse Width
Modulation control
In pulse width modulation control, the converter switches are turned on and off several times during a half cycle and output voltage is controlled by varying the width of the pulses. The gate signals are generated by comparing a triangular wave with a DC signal. The lower order harmonics can be eliminated or reduced by selecting the number of pulses per half cycle. However increasing the number of pulses would also increase the magnitude of higher order harmonics which could easily be filtered out. The width of the pulses can be varied to control the output voltage. However the pulse width of pulses could be different. It is possible to choose the widths of pulses in such a way that certain harmonics can be eliminated. The most common way of varying the width of the pulses is the Sinusoidal Pulse Width Modulation. In SPWM the displacement factor is unity and the power factor is improved. The lower order harmonics are eliminated and reduced. The SPWM pulses are generated and the DSTATCOM was controlled in the open loop response.
B. PROPOSED SYSTEM: Artificial Neural
architecture
A BP algorithm is implemented in a three phase shunt connected custom power device known as DSTATCOM for the extraction of the weighted value of load active power and reactive power current components in nonlinear loads. The BP algorithm is used for harmonic suppression and load balancing in PFC and zero voltage regulation (ZVR) modes with dc voltage regulation of DSTATCOM. In this BP algorithm, the training of weights has three stages.
Feed forward of the input signal training,
Calculation and BP of the error signals,
Upgrading of training weights.
Figure 4 : Standard model of BP algorithm
The BP algorithm has one or more than one layer. It is based on a mathematical formula and does not need special features of function in the learning process. It also has smooth variation on weight correction due to batch updating features on weights. It is slow during the training process due to more number of learning steps, but after the training of weights, the algorithm produces very fast trained output response. Continuity, non-decreasing monotony and differentiability are the main characteristics of BP algorithm. In this application, the proposed control algorithm on a DSTATCOM is implemented for the compensation of nonlinear loads.
The initial output pattern is compared with the desired output pattern and the weights are adjusted by the algorithm to minimize the error. The iterative process finishes when the error becomes near null.
IV. REFERENCE CURRENT GENERATION
A BP training algorithm is used to estimate the three phase weighted value of load active power current components
(wap, wbp and wcp) and reactive power current components
(waq , wbq , and wcq) from polluted load currents using the
feed forward and supervised principle.
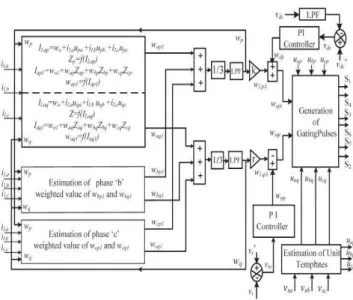
A. DERIVATION OF REFERENCE
CURRENTS
Figure 5 : Proposed modeling of BP algorithm In this estimation, the input layer for three phases (a, b, and c) is expressed as ILap=wo+ iLauap+ iLbubp+ iLcucp (1) ILbp=wo+ iLbubp+ iLcucp+ iLauap (2) ILcp=wo+ iLcucp+ iLauap+ iLbubp (3)
Where wo is the selected value of the initial weight and uap
,ubp ,and ucp are the in-phase unit templates.
In-phase unit templates are estimated using sensed PCC
phase voltages (vsa ,vsb and vsc).It is the relation of the
phase voltage and the amplitude of the PCC voltage
(vt).The amplitude of sensed PCC voltages is estimated as
vt=√[2 (vsa2 + vsb2 + vsc2)/3]
(4)
The in-phase unit templates of PCC voltages (uap ,ubp , and
ucp) are estimated as [13]
uap=vsa/vt ubp=vsb/vt
ucp=vsc/vt (5)
The extracted values of ILap ,ILbp and ILcp are passed
through a sigmoid function as an activation function, and
the output signals (Zap , Zbp , and Zcp) of the feed forward
section are expressed as
Zap =f(ILap) = 1/(1 + e−ILap)
(6)
Zbp=f(ILbp) = 1/(1 + e−ILbp)
(7)
Zcp=f(ILcp) = 1/(1 + e−ILcp)
(8)
The estimated values of Zap ,Zbp and Zcp are fed to a hidden
layer as input signals. The three phase outputs of this layer
(Iap1 , Ibp1 and Icp1 ) before the activation function are
expressed as Iap1 =wo1 + wapZap+ wbpZbp+ wcpZcp (9) Ibp1 =wo1 + wbpZbp+ wcpZcp+ wapZap (10) Icp1 =wo1 + wcpZcp+ wapZap+ wbpZbp (11)
Where wo1 ,wap , wbp , and wcp are the selected value of the
initial weight in the hidden layer and the updated values of three phase weights using the average weighted value
(wp)of the active power current component as a feedback
signal, respectively.
The updated weight of phase “a” active power current
components of load current “wap” at the nth sampling
instant is expressed as
wap(n) = wp(n) + μ {wp(n) − wap1(n)} f
„
(Iap1)zap(n)
(12)
Where wp (n) and wap (n) are the average weighted value
of the active power component of load currents and the updated weighted value of phase “a” at the nth sampling
instant, respectively, and wap1 (n) and zap (n) are the phase
“a” fundamental weighted amplitude of the active power
component of the load current and the output of the feed forward section of the algorithm at the nth instant,
respectively. f (Iap1 ) and μ are represented as the
derivative of Iap1 components and the learning rate.
Similarly, for phase “b” and phase “c,” the updated weighted values of the active power current components of the load current are expressed as
wbp(n)=wp(n)+μ {wp(n)−wbp1(n)} f‟(Ibp1)zbp(n)
(13)
wcp(n)=wp(n)+μ {wp(n)−wcp1(n)} f‟(Icp1)zcp(n)
(14)
The extracted values of Iap1, Ibp1, and Icp1 are passed
through a sigmoid function as an activation function to the estimation of the fundamental active components in terms
of three phase weights wap1, wbp1 , and wcp1 as
wap1 =f(Iap1) = 1/(1 + e−Iap1)
(15)
wbp1 =f(Ibp1) = 1/(1 + e−Ibp1)
(16)
wcp1 =f(Icp1) = 1/(1 + e−Icp1)
(17)
The average weighted amplitude of the fundamental active
power components (wp) is estimated using the amplitude
sum of three phase load active power components (wap1
,wbp1 and wcp1 ) divided by three. It is required to realize
load balancing features of DSTATCOM. Mathematically, it is expressed as
wp= (wap1 + wbp1 + wcp1)/3
(18)
First-order low-pass filters are used to separate the low frequency components. “k” denotes the scaled factor of the extracted active power components of current in the algorithm. After separating the low-frequency components and scaling to the actual value because the output of the activation function is between 0 and 1, it is represented as
wLpA. Similarly, the weighted amplitudes of the reactive
power components of the load currents (waq, wbq, and wcq)
of the fundamental load current are extracted as
ILaq=wo+ iLauaq+ iLbubq+ iLcucq
(19)
ILbq= wo+ iLauaq+ iLbubq+ iLcucq (20)
ILcq= wo+ iLauaq+ iLbubq+ iLcucq (21)
Where wo is the selected value of the initial
weight and uaq, ubq and ucq are the quadrature components
of the unit template.
The quadrature unit templates (uaq, ubq, and ucq) of the
uaq=(−ubp+ ucp)/ √3, ubq=(3uap + ubp − ucp)/2√3; ucq=(−3uap
+ ubp − ucp)/2√3
(22)
The extracted values of ILaq, ILbq, and ILcq are passed
through a sigmoid function as an activation function to the
estimation of Zaq, Zbq, and Zcq
Zaq=f(ILaq) = 1/(1 + e−ILaq) (23)
Zbq=f(ILbq) = 1/(1 + e−ILbq)
(24)
Zcq=f(ILcq) = 1/(1 + e−ILcq) (25)
The estimated values of Zaq, Zbq, and Zcq are fed to the
hidden layer as input signals. The three phase outputs of
this layer (Iaq1, Ibq1, and Icq1) before the activation function
can be represented as Iaq1 =wo1 + waqZaq+ wbqZbq+ wcqZcq (26) Ibq1 =wo1 + waqZaq+ wbqZbq+ wcqZcq (27) Icq1 = wo1 + waqZaq+ wbqZbq+ wcqZcq (28)
Where wo1, waq, wbq, and wcq are the selected value of the
initial weight in the hidden layer and the updated three weights using the average weighted value of the reactive
power components of currents (wq) as a feedback signal,
respectively.
The updated weight of the phase “a” reactive power
components of load currents “waq” at the nth sampling
instant is expressed as
waq(n) = wq(n) + μ {wq(n) − waq1(n)} f‟(Iaq1)zaq(n)
(29)
wq(n) and waq(n) are the average weighted value of the
active power component of load currents and the updated weight in the nth sampling instant, respectively, and
waq1(n)and zaq(n) are the phase “a” weighted amplitude of
the reactive power current component of load currents and the output of the feed forward section of the algorithm at
the nth instant, respectively. f(Iaq1) and μ are presented as
the derivative of Iaq1 components and the learning rate.
Similarly, for phase “b” and phase “c,” the updated weighted values of the reactive power current components of the load current are expressed as
wbq(n) =wq(n) + μ {wq(n) − wbq1(n)} f‟(Ibq1)zbq(n) (30)
wcq(n) =wq(n) + μ {wq(n) − wcq1(n)} f‟(Icq1)zcq(n)
(31)
The extracted values of Iaq1, Ibq1, and Icq1 are passed
through an activation function to the estimation of the fundamental reactive component in terms of three phase
weights waq1, wbq1, and wcq1 as
waq1 =f(Iaq1) = 1/(1 + e−Iaq1)
(32)
wbq1 =f(Ibq1) = 1/(1 + e−Ibq1)
(33)
wcq1 =f(Icq1) = 1/(1 + e−Icq1)
(34)
The average weight of the amplitudes of the fundamental
reactive power current components (wq) is estimated using
the amplitude sum of the three phase load reactive power
components of the load current (waq1, wbq1, and wcq1)
divided by three. Mathematically, it is expressed as
wq= (waq1 + wbq1 + wcq1)/3 (35)
First-order low-pass filters are used to separate the low frequency component. “r” denotes the scaled factor of the extracted reactive power components in the algorithm. After separating low-frequency components and scaling to the actual value because the output of the activation
function is between 0 and 1, it is represented as wLqA.
A. Amplitude of Active Power Current
Components of Reference Source Currents
An error in the dc bus voltage is obtained after comparing
the reference dc bus voltage vdc*and the sensed dc bus
voltage vdc of a VSC, and this error at the nth sampling
instant is expressed as
vde(n) = vdc*(n) − vdc(n). (36)
This voltage error is fed to a proportional–integral (PI) controller whose output is required for maintaining the dc bus voltage of the DSTATCOM. At the nth sampling instant, the output of the PI controller is as follows
wdp(n)= wdp(n−1)+kpd {vde(n) − vde(n−1)}+kid vde(n) (37)
Where kpd and kid are the proportional and integral gain
constants of the dc bus PI controller. vde(n) and vde(n − 1)
are the dc bus voltage errors in the nth and (n − 1)th
instant, and wdp(n) and wdp(n − 1) are the amplitudes of the
active power component of the fundamental reference current at the nth and(n − 1)th instant, respectively. The amplitude of the active power current components of
the reference source current (wspt) is estimated by the
addition of the output of the dc bus PI controller (wdp) and
the average magnitude of the load active currents (wLpA) as
wspt= wdp+ wLpA. (38)
B. Amplitude of Reactive Power Components of
Reference Source Currents:
An error in the ac bus voltage is achieved after comparing
the amplitudes of the reference ac bus voltage vt*and the
sensed ac bus voltage vt of a VSC. The extracted ac bus
vte(n) = vt*(n) − vt(n) (39)
The weighted output of the ac bus PI controller wqq for
regulating the ac bus terminal voltage at the nth sampling instant is expressed as
wqq(n) = wqq(n−1)+kpt {vte(n) − vte(n−1)}+kit vte(n) (40)
Where wqq(n) is part of the reactive power component of
the source current and it is renamed as wqq. Kpt and kit are
the proportional and integral gain constants of the ac bus voltage PI controller.
The amplitude of the reactive power current components
of the reference source current (wsqt) is calculated by
subtracting the output of the voltage PI controller (wqq)
and the average load reactive currents (wLqA) as
wsqt= wqq–wLqA
(41)
C. Estimation of Reference Source Currents and
Generation of IGBT Gating Pulses:
Three phase reference source active and reactive current components are estimated using the amplitude of three phase (a, b and c) load active power current components, PCC voltage in-phase unit templates, reactive power current components, and PCC quadrature voltage unit templates as
isap=wsptuap, isbp= wsptubp, iscp= wsptucp
(42)
isaq=wsqtuaq, isbq= wsqtubq, iscq= wsqtucq.
(43)
The addition of reference active and reactive current components is known as reference source currents, and these are given as
Isa*= isap+ isaq, Isb*= isbp+ isbq, Isc*= iscp+ iscq (44)
The sensed source currents (isa, isb, isc) and the reference
source currents (isa*, isb*, isc
*
) are compared, and current error signals are amplified through PI current regulators; their outputs are fed to a pulse width modulation (PWM) controller to generate the gating signals for insulated-gate bipolar transistors(IGBTs) S1 to S6 of the VSC used as a DSTATCOM
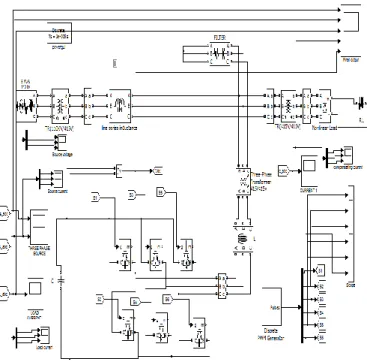
V. SIMULATION AND RESULTS
A. EXISTING SYSTEM: PWM CONTROLLED
DSTATCOM
This shows the Simulink modeling of DSTATCOM in which the gate signals are generated by the PWM controller The VSC switching strategy is based on a sinusoidal PWM technique which offers simplicity and good response. Since custom power is a relatively low-power application, PWM methods offer a more flexible option which is the existing system.
Figure 6 : Simulink modeling of PWM controlled DSTATCOM
B. RESULTS OF PWM CONTROLLED
DSTATCOM
The below figure shows the waveform of source currents
(isa, isb,isc) load currents (iLa, iLb, iLc) and compensating
currents (iCa,iCb, iCc) with PCC line voltage (vab) under
unbalancednonlinear loads.
Figure 7 :Dynamic performance of DSTATCOM with
PWM controller
a)VSabc b)ISabc c)ILabc d)ICabc e)Vdc
C. THD ANALYSIS OF PWM CONTROLLED
DSTATCOM
Harmonic spectra of phase „a‟ voltage at PCC (vsa), source
current (isa) and load current (iLa) are shown in figure.
THDs of the phase „a‟ at PCC voltage, source current, load current are observed 0.01%, 18.61% and 14.25% respectively.
Figure 8: Waveforms and harmonic spectra of PCC voltage of phase „a‟
Figure 9: Waveforms and harmonic spectra of Source current of phase „a‟
Figure 10: Waveforms and harmonic spectra of load current of phase „a‟
D. PROPOSED SYSTEM: Neural Network
Controlled DSTATCOM
The figure shows the modeling of artificial neural network
controlled algorithm in the MATLAB/Simulink
environment.
Figure 11 : Simulink Modeling of Neural Network Controlled DSTATCOM
E. UNIT TEMPLATE ESTIMATION
The figure shows the mathematical modeling of Unit template estimation which is essential for the reference current calculation in MATLAB/Simulink environment.
Figure 12: Mathematical modeling of Unit templates
F. REFERENCE CURRENT CALCULATION
The figure shows the mathematical modeling of reference current calculation in MATLAB/Simulink environment.
Figure 13: Mathematical modeling of Reference currents calculation
G. DSTATCOM CONTROLLER
Figure 14: Mathematical Modeling of DSTATCOM controller
H. RESULTS OF NEURAL NETWORK
CONTROLLED DSTATCOM
The figure shows the waveform of source currents (isa,
isb,isc) load currents (iLa, iLb, iLc) and compensating currents
(iCa,iCb, iCc) with PCC line voltage (vab) under unbalanced
Figure 15 : Dynamic Performance of DSTATCOM under Non Linear Load in PFC mode
a)VSabc b)ISabc c)ILa d) ILb e) ILc f)ICa g)ICb h)ICc i)ILabc j)Vdc
I. THD ANALYSIS OF NEURAL NETWORK
CONTROLLED DSTATCOM
Harmonic spectra of phase „a‟ voltage at PCC
(vsa), source current (isa) and load current (iLa) are shown in
figure. THDs of the phase „a‟ at PCC voltage, source current, load current are observed 0.02%, 2.46% and 11.50% respectively.
Figure 16: Waveforms and harmonic spectra of PCC voltage of phase „a‟ in PFC mode.
Figure 17 : Waveforms and harmonic spectra of Source current of phase „a‟ in PFC mode
Figure 18 : Waveforms and harmonic spectra of load current of phase „a‟ in PFC mode
VI. ANALYSIS ON THE PERFORMANCE OF
DSTATCOM Performance parameters DSTATCOM With PWM controller-Non Linear load ( 3 Phase uncontrolled rectifier with RL load)
DSTATCOM With BP controller-Non Linear load ( 3 Phase uncontrolled rectifier with RL load) PCC voltage (V), %THD 338.8 V,0.01% 338.5 V,0.02% Source current (A), % THD 12.55 A,18.61% 30.1A,2.46% Load current (A),% THD 40.06A, 14.25% 36.97%, 11.50% Dc bus voltage (V) 700V 700V
Table 1: Comparative analysis on Performance of DSTATCOM in PFC mode
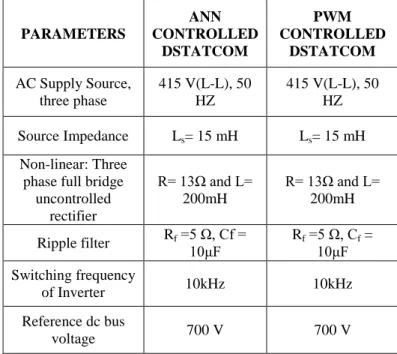
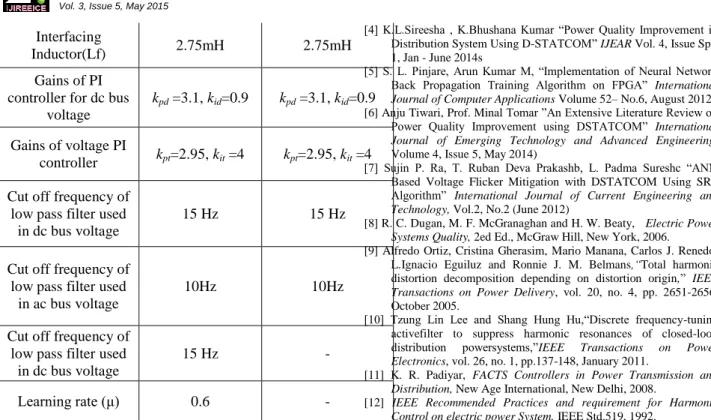
VII. PARAMETERS USED IN SIMULATION:
This table shows the parameters that are considered to simulate the PWM controlled DSTATCOM and the Artificial Neural Network controlled DSTATCOM.
PARAMETERS ANN CONTROLLED DSTATCOM PWM CONTROLLED DSTATCOM AC Supply Source, three phase 415 V(L-L), 50 HZ 415 V(L-L), 50 HZ Source Impedance Ls= 15 mH Ls= 15 mH Non-linear: Three phase full bridge
uncontrolled rectifier R= 13Ω and L= 200mH R= 13Ω and L= 200mH Ripple filter Rf =5 Ω, Cf = 10μF Rf =5 Ω, Cf = 10μF Switching frequency of Inverter 10kHz 10kHz Reference dc bus voltage 700 V 700 V
Interfacing
Inductor(Lf) 2.75mH 2.75mH
Gains of PI controller for dc bus
voltage
kpd=3.1, kid=0.9 kpd=3.1, kid=0.9
Gains of voltage PI
controller kpt=2.95, kit=4 kpt=2.95, kit=4
Cut off frequency of low pass filter used in dc bus voltage
15 Hz 15 Hz
Cut off frequency of low pass filter used in ac bus voltage
10Hz 10Hz
Cut off frequency of low pass filter used in dc bus voltage
15 Hz -
Learning rate (μ) 0.6 -
Table 2: Parameters of the PWM controlled DSTATCOM and ANN controlled DSTATCOM
VIII. CONCLUSION
A three phase VSC based DSTATCOM has been implemented for compensation of nonlinear loads using BPT control algorithm to verify its effectiveness. The proposed algorithm has been used for extraction of reference source currents to generate the switching pulses for IGBTs of VSC of DSTATCOM. Various functions of DSTATCOM such as, load balancing and harmonic elimination have been demonstrated in PFC mode with DC voltage regulation of DSTATCOM.
From simulation and implementation results, it is concluded that DSTATCOM and its control algorithm have been found suitable for compensation of nonlinear loads. These results show satisfactory performance of the BP control algorithm for harmonics elimination according to IEEE-519 guidelines in order of less than 5%. The DC bus voltage of the DSTATCOM has also been regulated to rated value without any overshoot or undershoots during load variation. Large training time in the application of complex system, selection of number of hidden layer in system is the disadvantage of this algorithm.
REFERENCES
[1] Bhim Singh, P. Jayaprakash, D. P. Kothari, Ambrish Chandra, Kamal Al Haddad “Comprehensive Study of DSTATCOM
Configurations” IEEE Transactions on Industrial Informatics, VOL.
10, NO. 2, MAY 2014
[2] Bhim Singh, Sabha Raj Arya “Design and control of a DSTATCOM for power quality improvement using cross correlation function
approach” International Journal of Engineering, Science and
Technology Vol. 4, No. 1, 2012, pp. 74-86, April 2012
[3] Alpesh Mahyavanshi, M. A. Mulla, R. Chudamani “Reactive Power
Compensation by Controlling the DSTATCOM” International
Journal of Emerging Technology and Advanced Engineering, Volume 2, Issue 11, November 2012
[4] K.L.Sireesha , K.Bhushana Kumar “Power Quality Improvement in
Distribution System Using D-STATCOM” IJEAR Vol. 4, Issue
Spl-1, Jan - June 2014s
[5] S. L. Pinjare, Arun Kumar M, “Implementation of Neural Network
Back Propagation Training Algorithm on FPGA” International
Journal of Computer Applications Volume 52– No.6, August 2012 [6] Anju Tiwari, Prof. Minal Tomar ”An Extensive Literature Review on
Power Quality Improvement using DSTATCOM” International
Journal of Emerging Technology and Advanced Engineering,
Volume 4, Issue 5, May 2014)
[7] Sujin P. Ra, T. Ruban Deva Prakashb, L. Padma Sureshc “ANN Based Voltage Flicker Mitigation with DSTATCOM Using SRF
Algorithm” International Journal of Current Engineering and
Technology, Vol.2, No.2 (June 2012)
[8] R. C. Dugan, M. F. McGranaghan and H. W. Beaty, Electric Power
Systems Quality, 2ed Ed., McGraw Hill, New York, 2006. [9] Alfredo Ortiz, Cristina Gherasim, Mario Manana, Carlos J. Renedo,
L.Ignacio Eguiluz and Ronnie J. M. Belmans,“Total harmonic
distortion decomposition depending on distortion origin,” IEEE
Transactions on Power Delivery, vol. 20, no. 4, pp. 2651-2656, October 2005.
[10] Tzung Lin Lee and Shang Hung Hu,“Discrete frequency-tuning activefilter to suppress harmonic resonances of closed-loop
distribution powersystems,”IEEE Transactions on Power
Electronics, vol. 26, no. 1, pp.137-148, January 2011.
[11] K. R. Padiyar, FACTS Controllers in Power Transmission and
Distribution, New Age International, New Delhi, 2008.
[12] IEEE Recommended Practices and requirement for Harmonic
Control on electric power System, IEEE Std.519, 1992.
[13] Tzung-Lin Lee, Shang-Hung Hu and Yu-Hung Chan, “DSTATCOM
with positive-sequence admittance and negative-sequence
conductance to mitigate voltage fluctuations in high-level
penetration of distributed generation systems, ”IEEE Transactions
on Industrial Electronics, vol.60, no. 4, pp. 1417-1428, April 2013. [14] B. Singh, P. Jayaprakash and D.P. Kothari,“ Power factor correction
and power quality improvement in the distribution system,” Journal
ofElectrical India, pp. 40-48, April, 2008.
[15] Jinn-Chang Wu, Hurng Liahng Jou, Ya Tsung Feng, Wen Pin Hsu, Min Sheng Huang, and WenJet Hou, “Novel circuit topology for
three-phase active power filter, ”IEEE Transactions on Power
Delivery, vol. 22, no. 1, pp. 444-449, January 2007.
BIOGRAPHY
S. Sherin Jasper did her Bachelor of
Engineering in Electrical & Electronics Engineering at Government college of Engineering, Tirunelveli and doing M.E degree in Electrical engineering
with specialization in Power
Electronics & Drives at Sri Shakthi Institute of Engineering and Technology, Coimbatore, India. Her research interests include Power Electronics, Power Quality.