Project funded by the European Commission
under the Seventh Framework Programme for Research and Development Contract Number: 218647
D 3.1.2
FUNCTIONAL REQUIREMENTS AND
CLASSIFICATION FOR
INTERMODAL TRANSPORT HUBS
Version v2
Date of issue October 31st, 2010
Nature of Deliverable External / Internal Dissemination Level
Status Final
Issued by SP Leader Project Director
SUMMARY SHEET
Programme Seventh Framework Programme
Contract N. 218647
Project Title European Bus System of the Future Acronym EBSF
Coordinator UITP – International Association of Public Transport Project Director Umberto Guida, [email protected]
Web-site www.ebsf.eu
Starting date 1 September 2008 Number of months 48 months Deliverable N. D.3.1.2
Deliverable Title FUNCTIONAL REQUIREMENTS AND CLASSIFICATION FOR INTERMODAL TRANSPORT HUBS
Version Final
Date of issue October 31st, 2010 Distribution
Internal Project Results
Dissemination level Confidential
Status Final Draft
Filename Abstract
This document first analyses the importance of the intermodality in the transport systems, and sets a classification of the different “points of connection” depending on their function in the general mobility of the city or metropolitan area.
The document identifies the functional requirements of an interchange, focusing in the factors of success and innovation of them to get an optimal attractiveness, as the strategic location, the integration of the different modes, the transfer time reduction (thus in the total journey time), the information provided, the quality of the waiting areas and environment, etc.
Keywords
This report is subject to a disclaimer and copyright. This report has been carried out under a contract awarded by the European Commission, contract number:
No part of this report may be used, reproduced and or/disclosed, in any form or by any means without the prior written permission of UITP and the EBSF consortium. All rights reserved.
Persons wishing to use the contents of this study (in whole or in part) for purposes other than their personal use are invited to submit a written request to the following address:
UITP International Association of Public Transport Rue Sainte-Marie 6- 1080 Brussels
INTERNAL DISTRIBUTION – via Web-Site
# Partner Short name Country
1 International Association of Public transport UITP Belgium
2 D’Appolonia DAPP Italy
3 ACTIA SA ACTIA France
4 Init INIT Germany
5 ASSTRA ASSTRA Italy
6 Berends-consult BERENDS Germany
7 BKV BKV Hungary
8 SYTRAL SYSTRAL France
9 Certu CERTU France
10 Chalmers CHALMERS Sweden
11 Union Transport Public UTP France
12 Consorcio Regional de Transportes de Madrid CRTM Spain
13 TEKIA TEKIA Spain
14 Evobus EVOBUS Germany
15 Franhofer IVI Dresden FRAUNHOFER Germany
16 Transyt, University Madrid TRANSYT- UMP Spain
17 HÜBNER GmbH HUEB Germany
18 Irisbus/Iveco IRISBUS France
19 Fit Consulting FIT Italy
20 Hogia Public Transport Systems AB HPTS Sweden
21 Nantes Metropole NMCU France
22 MAN MAN Germany
23 Newcastle University UNEW United Kingdom
24 PE International GmbH PE Germany
25 RATP RATP France
26 Azienda Trasporti Verona ATV Italy
27 Regia Autonoma De Transport Bucaresti R.A RATB Romania
28 Scania SCANIA Sweden
29 Vultron Trade American- Hungarian Developing & Trading CO. Ltd VULTRON TRADE Hungary
30 INRETS INRETS France
31 SRWT-TEC S.R.W.T Belgium
32 Digigroup Digigroup Italy
33 Vasttrafik VTAB Sweden
34 ATAC Rome ATAC Italy
35 VDV VDV Germany
36 Azienda Trasporti Milanesi ATM Italy
37 Volvo Technology AB VOLVO Sweden
38 University of Rome 3 UNIROMA 3 Italy
39 Bremerhaven Bus BHVBUS Germany
40 EUROLUM EUROLUM France
41 University of Rome- DITS DITS Italy
42 INEO SYSTRANS INEO France
43 Pilotfish Networks PILOTFISH Sweden
44 Consultores em Transportes, Inovaçao e Sistemas SA TIS.PT Portugal
45 CEIT CEIT Spain
46 CRF CRF Italy
48 Bremerhaven Tourist Board BIS Germany
EXTERNAL DISTRIBUTION
Entity Short name Country Contact person
European Commission DG-RTD EC DG-RTD - Patrick Mercier-Handyside
DOCUMENT CHANGE LOG
CONTRIBUTING PARTNERS
Company Names Company Info
CRTM
Carlos Cristóbal Laura Delgado José Joaquín Lozano Javier Aldecoa
Consorcio Regional de Transportes de Madrid Plaza Descubridor Diego de Ordás, 3 28003 Madrid - SPAIN
www.ctm-madrid.es
Email: [email protected]
Email: [email protected]
RATP Marc Bedier Patrick Skrzypek
RATP
54 Quai Rapee
12EME 75599 Paris - FRANCE www.ratp.fr
Email: [email protected]
Email: [email protected]
UNEW Roberto Palacin
UNEW, Newcastle Univeristy 6 Kengsinton Terrace
NE1 7RU Newcastle Upon Tyne – UK www.ncl.ac.uk
Email: [email protected]
ASSTRA
Guido del Mese Daniela Carbone Francesca Pico Emanuele Proia Elisa Meko
ASSTRA, Associazione Trasporti Piazza Cola di Rienzo 80/A 00192 Roma – ITALY www.asstra.it
Email: [email protected]
Email: [email protected]
VEOLIA-EUROLUM Jean-Laurent Franchineau Lucie Pham
VEOLIA - EUROLUM 15 rue du Louvre 75001 Paris - FRANCE
Email: [email protected]
Email: [email protected]
CERTU Patrick Gendre
CETE Mediterranee (DCEDI/TIER) CS 70499
13593 Aix-en-Provence cedex 3 – FRANCE www.cete-mediterranee.fr
Email: [email protected]
EVOBUS Erich Mecha
EVOBUS GMBH
Hanns-Martin-Schleyer-Str. 21-57 Mannheim 68301 - GERMANY Email: [email protected]
NMCU Damien Garrigue Anne Vicenzotti
Nantes Metropole Cours du champ de Mars 2 44 923 Nantes cedex 9 - FRANCE www.nantesmetropole.fr
Email: [email protected]
Email: [email protected]
MAN Franz Redwitz
MAN Bus Gmbh
Heinrich – Büssing - Str. 1 38239 Salzgitter - GERMANY Email: [email protected]
Company Names Company Info ATAC Marino Lizza Flavia Andreoli Federico Paci ATAC Roma Via Ostiense, 131 00154 Rome – ITALY www.atac.roma.it Email: [email protected] Email: [email protected] Email: [email protected]
RATB Liliana Andrei Florin Dragomir
RATB
Bd. Dinicu Golescu 1
010861, Sector 1 Bucharest - ROMANIA www.ratb.ro
Email: [email protected]
Email: [email protected]
ATM Stefano Milanesi Marco Duranti
Azienda Trasporti Milanesi Foro Buonaparte, 61 20121 Milano– ITALY www.atm-mi.it
Email: [email protected]
Email:[email protected]
VOLVO Maria Tevell
VOLVO TECHNOLOGY AB Goetaversksgatan 10, M1.7 40508, Goeteborg - SWEDEN Email: [email protected] BHVBUS Jörg Fröhlich Bremerhaven Bus Zur Hexenbrücke 11 27570 Bremerhaven – GERMANY www.bremerhavenbus.de Email: [email protected] ACRONYMS
AVMS: Automated Vehicle Monitoring System DoW: Description of Work
DPI: Dynamic Passenger Information
EBSF: European Bus System of the Future
ITS: Information and Telecommunication System
KPI: Key Performance indicators LCC: Life Cycle Cost
PT: Public Transport
SP: Sub-Project
UsG: User Group
WMD: Weapons of Mass Destruction WP: Working Package
INDEX
1. EXECUTIVE SUMMARY... 9
2. INTRODUCTION ... 14
2.1 BACKGROUND... 14
2.2 DESCRIPTION OF THE WORK IN WP3.1 ... 15
2.2.1 objectives and deliverables... 15
2.2.2 methodology of the work... 15
2.2.3 report structure... 16
3. PUBLIC TRANSPORT NETWORKS... 17
3.1 CLASSIFICATION OF DIFFERENT MODES OF PT ... 17
3.1.1 change in public transport systems conception ... 17
3.1.2 a classification of urban public transport modes ... 18
3.2 OPERATION SPEED OF PUBLIC TRANSPORT SYSTEMS: THE EFFECT OF THE DISTANCE BETWEEN STOPS... 19
3.3 THE REALITY OF ON-SURFACE PUBLIC TRANSPORT SYSTEMS... 20
3.4 MOBILITY AND PUBLIC TRANSPORT... 21
3.5 INTERMODALITY AS MAIN FACTOR TO CREATE NETWORK... 24
4. COHESION FACTORS OF THE NETWORK: INTERMODALITY ... 25
4.1 ADMINISTRATIVE INTEGRATION... 26
4.2 TICKET AND FARE INTEGRATION... 27
4.3 MODAL INTEGRATION... 27
5. TYPOLOGIES OF POINTS OF CONNECTION ... 30
5.1 LONG DISTANCE INTERCHANGES... 30
5.1.1 definition... 30
5.1.2 characteristics ... 31
5.1.3 urban context ... 31
5.1.4 present modes ... 31
5.1.5 size and demand... 32
5.1.6 functional analysis... 32 5.2 METROPOLITAN INTERCHANGES... 33 5.2.1 definition... 33 5.2.2 characteristics ... 33 5.2.3 urban context ... 33 5.2.4 present modes ... 34
5.2.5 size and demand... 35
5.2.6 functional analysis... 35
5.3 URBAN INTERCHANGES (OR INTERMODAL AREAS) ... 36
5.3.1 definition... 36
5.3.2 characteristics ... 36
5.3.3 urban context ... 37
5.3.4 present modes ... 38
5.3.5 size and demand... 38
5.3.6 functional analysis... 39 5.4 CONNECTING POINTS... 40 5.4.1 definition... 41 5.4.2 characteristics ... 41 5.4.3 urban context ... 42 5.4.4 present modes ... 43
5.4.5 size and demand... 43
5.4.6 functional analysis... 44
6. FUNCTIONAL REQUIREMENTS OF A HUB OR INTERCHANGE ... 46
6.1 STRATEGIC LOCATION... 46
6.2 URBAN INTEGRATION... 47
6.2.1 functional aspects of urban integration ... 47
6.2.2 aesthetic-urbanistic aspects of urban integration... 49
6.3 INTEGRATION OF DIFFERENT MODES AND MOBILITY DEMANDS... 49
6.4 REDUCE TRANSFER TIME... 50
6.4.1 reducing transfer distances... 50
6.4.2 ticketing systems... 51
6.5 INFORMATION AND SIGNALLING... 52
6.5.1 basic information characteristics... 53
6.5.2 information content ... 55
6.6 QUALITY OF WAITING AREAS AND ENVIRONMENT... 55
6.6.1 lightinng systems ... 56
6.7 ACCESSIBILITY... 57
6.9 MEET OPERATING NEEDS... 59
6.10 INTERCHANGE MANAGEMENT AND OPERATION... 59
6.10.1 user-oriented services plan ... 60
6.10.2 quality parameters ... 61
6.10.3 operator-oriented services plan... 62
6.10.4 maintenance, upkeep and cleaning plan... 63
6.10.5 environmental management plan ... 63
6.10.6 economic profitability ... 64
6.11 SAFETY AND SECURITY... 64
7. RELATION WITH BASIC FUNCTIONAL SYSTEM REQUIREMENTS ... 66
8. CONCLUSIONS ... 70
9. ANNEXES ... 74
9.1 ANNEX 1:BIBLIOGRAPHY... 74
9.2 ANNEX 2:ANALYSIS OF REQUIREMENTS... 75
INDEX OF FIGURES Figure 1 – Estructure of the EBSF ... 14
Figure 2 – Classification for urban public transport modes ... 19
Figure 3 –Speed operation function of the maximum speed of the vehicle... 20
Figure 4 – Journey time comparision between light rail and standard metro ... 21
Figure 5 – Modal split of public transport vs private cars in different European metropolitan areas ... 22
Figure 6 – Mobility typologies in metropolitan areas ... 22
Figure 7 – Modal share in Madrid metropolitan area... 23
Figure 8 – Examples of BHLS systems in Europe according to the type of mobility they cover ... 24
Figure 9 – Example of modal integration in Madrid (Spain) ... 28
Figure 10 – Príncipe Pío metropolitan interchange station (Spain)... 35
Figure 11 – La Rotonde urban interchange, Strasbourg (France) ... 36
Figure 12 – Piazza dei Cinquecento, Rome... 37
Figure 13 – Passenger demand distribution in Pavones urban interchange, Madrid... 39
Figure 14 – Cuatro Caminos connecting point, Madrid ... 42
Figure 15 – Piazza Venezia, Rome... 44
Figure 16 – Avenida de América interchange, Madrid ... 48
Figures 17 and 18 – Urban integration in Plaza Elíptica interchange station, Madrid... 49
Figure 19 – Integration of modes in Madrid... 50
Figure 20 – Use of escalators to reduce tranfer time ... 51
Figure 21 – Validation systems ... 52
Figures 22 and 23 – Information and signalling ... 55
Figure 24 – Diaphanous spaces and environmental quality... 56
Figure 25 – Use of natural light ... 57
Figures 26 and 27 – Universal accessibility ... 58
Figure 28 – Vehicles area in an interchange station ... 59
Figure 29 – Management centre ... 60
Figure 30 – Organisation of activities in the Operator-Oriented Services Plan ... 62
1. EXECUTIVE
SUMMARY
This document is focused in intermodality, as key factor to give shape to an efficient transport system, addressing the conditions of an optimal integration of the transport modes to ensure the bus system its best efficiency, and to contribute to a seamless mobility.
The document is structured in three main parts: first (corresponding to section 3 and 4), analyses the importance of the intermodality in the transport system; second (section 5), sets a classification of the different “points of connection” depending on their function in the general mobility of the city; and third (section 6 and 7), identifies the functional requirements of a hub or interchange focusing in the factors of innovation and success of an interchange to get an optimal attractiveness of the public transport system.
Mobility requirements are not merely growing and diversifying, above all they are becoming increasingly complex, as consequence among others of a less integrated urbanism. That means that trips start increasingly further away from the destination and therefore include a higher number of stages and transfers, experienced as real breaks within the journey due to the uncertainty passengers experience. It is very important, therefore, to ensure that the public transport user perceives his trip as a “unit”, to which end it is necessary to reduce the sense of “trip fragmentation” caused by transfers.
In order to be able to compete with the private vehicle, which is more capable of providing this continuity, an integrated planning, coordination and management of public transport is required, essentially focused on three basic aspects: administrative integration, fare integration and modal integration. These three aspects give rise to intermodality, given that the aim is to optimise each portion of the trip by choosing the mode, fare or operator most suited to the user’s needs and circumstances, facilitating the transfer from one to another and supporting the sense of seamless journey.
One of the most important factors when coinciving an intermodal system is the conception of interchange or transfer points as main nodes of the transport network. These nodes must be optimised by making them maximally functional and pleasant, requiring thorough groundwork and planning, taking account of local characteristics, oportunities and constraints. According to these, four types of “connection points” have been defined:
• Long distances interchanges: transfer points with long distance transport hubs
(airport, port, train station, long distance bus services, etc.) mainly used to connect long distance trips with the urban centres. They have good road connections, big parking facilities, car sharing-car pooling facilities, etc. usually connected with rail or metro network, where also buses play an important role.
• Metropolitan interchanges: located in metropolitan or regional area, or in the
limits of the urban area, with predominance of metropolitan mobility: used in metropolitan/medium distance trips, to connect the outer/metropolitan area with the urban modes or rail network, or with ports and ferries. In general, they are constructed with several levels and some underground infrastructure.
• Urban interchanges (or intermodal area): located in the urban area, mainly used
for medium-short distance trips, to connect different urban modes (bus, metro, light rail, etc.). They are significant points in the public transport network and/or city
context (leisure centre, hospital, etc.), usually with specific infrastructure to facilitate the connection.
• Points of connection: also located in the urban area and used for medium-short
distance trips but with no specific infrastructure for the interchange, that means they are “natural” connections in the street network where several modes stop. Therefore, they are usually located on surface, but can have underground infrastructure if connecting with metro or light rail.
The implementation of a transport interchange must result in the users’ total journey time being less than it would be if the interchange did not exist. The design criteria to be adopted must seek to avoid or reduce the disadvantages the transfer or break point may generate. To do so, they must meet the following functional requirements:
• Location and urban integration
The location of an interchange within an integrated transport system must pursue the following objectives: to connect the feeder modes (generally buses and private vehicles) with the transport system’s structuring modes (metro, light rail and commuter rail), and to
maximise access to trip-attracting centres, increasing the number of opportunities
(economic, business, work, leisure, etc.) accessible through the transport system and the convenience of reaching them. In this respect, it is worth considering the possibility of setting major trip-attracting centres (university, hospital, offices, shopping centres, etc.) in the vicinity of the interchange.
The interchange is located in an urban environment into which it must be integrated functionally and aesthetically. From a functional point of view, the interchange station
must: resolve the connection between the street network around the interchange and other public transport services nearby; reduce the conflicts between access/dispersion flows and “passing by” flows; and facilitate access to the interchange, especially for pedestrians.
• Integration of different modes and mobility demands
Due to its high capacity, the rail network (metro and commuter railway) is the main mode of transport in cities. It should be the capillary network through which metropolitan mobility in the city is channelled, complemented by the urban bus network. Therefore, interchanges must offer good access to the metro and to the urban bus network.
But also a very important factor in an interchange is to offer different types of mobility solutions in an integrated manner, not only through the various modes of public transport but also through complementary modes or mobility services (including
pedestrians, bikes, park&ride, kiss&ride, car sharing, etc.), trying to adapt to users demand and promoting a more sustainable transport.
• Reduce transfer time
The fundamental design criterion for ensuring that an interchange is regarded as such is
minimising the transfer time between modes, which can be considered practically
equivalent to minimising the distance and time which the user must cover when changing from one mode of transport to another.
Together with the physical disposition and integration of modes, an important factor in reducing transfer time is the availability of information and the ticketing system. Looking
for information or lack of it in case of breakdown is actual loss of time, even worse because is perceived as very negative by the user. This can be avoided with good signalling and effective multimodal real time information systems.
The journey time also includes the time it takes to purchase and validate the transport ticket. Ticket issue and validation systems must facilitate ticket purchase and validation by making the process quicker and more convenient.
• Information and signalling
In order to ensure this functional viability of intermodality, a medium of rapid and efficient data and information exchange is required. This medium must offer the user
a comfortable environment in which he perceives safety, speed and integration in the modes of transport through clear, intuitive, easy-to-find, efficient and, above all, coherent information.
This information must make the traveller feel that he is making a single trip which, in spite of being divided into stages, does not seem to consist of several unconnected journeys which just happen to coincide in the interchange. The traveller, the end user of the interchange, should choose public transport instead of private transport, and therefore he must perceive a quality, rapid, easy and comfortable service.
• Quality of waiting areas and environment
One of the main factors of success of an interchange from the user’s point of view is based on his perception of a single space whose functionality is easy to understand and whose environmental characteristics make for a pleasant stay.
In this respect, the design of diaphanous spaces is considered to be very important,
with visual connections that allow the whole interchange to be perceived, and with references, such as natural light, that allow users to get their bearings. As soon as the
user enters the interchange, he must know where he is and sense where he has to go. The signage used must be complete, uniform and easy to interpret.
Environmental quality is achieved through ventilation (pollutant gases must be extracted
near their source), temperature and noise control (with conditioned waiting areas). This is a very important aspect when the interchange is underground, such that it may well determine its future success, especially if it is used intensively by both travellers and vehicles.
• Accessibility
Likewise, the elements necessary for the accessibility of all groups of users (people
with reduced mobility, occasional users, etc.) must be considered when designing the infrastructure. The accessibility measures to undertake in an interchange station cover a range of different aspects and their objective is to integrate them from the vey
beginning of the design process. Such aspects include the design of the building,
furniture, signalling, evacuation, specific measures for visually impaired, etc.
• Other services
The subjectively perceived waiting time can also be reduced if the wait or transit in the interchange is made more pleasant. Thus, a library or book-lending service, cafeterias, shopping and/or leisure area, baggage store, etc. can promote the use of the interchange not only as a part of the transport network, but also as a place of interest in the city.
The provision of complementary services (such as information points, shopping area,
toilets, etc.) that give an added value to the use of the interchange is important, since continued use reinforces the feeling of security and can contribute to a reduction of time loss feeling.
• Operating needs
Firstly, the entrances to the interchange need to be well connected to the corresponding lines, seeking, whenever possible, to reduce journey times in relation to non-interchange solutions. In this sense, tunnels entering in the interchange to avoid congested areas in the surroundings reduce significantly the journey time, causing a benefit for
travellers and operators.
The transport service provider and its operation needs must also be considered when designing a good interchange. In this respect it is necessary to try to reduce the operating costs of the modes of transport that operate in it.
• Interchange management and operation
The management of the interchange, a task performed by the different authorities involved, is a crucial aspect for its day-to-day operation. This is another aspect which needs to be considered thoroughly, and includes the need to create the figure of interchange manager, with responsibilities vis-à-vis the operators and users, and with
the powers to impose penalties if necessary.
The User-Oriented Services Plan takes shape to ensure a rapid, accessible and
comfortable service for users with all the services that this entails. The aim of this Plan is to achieve a service of optimal quality. The ultimate purpose of this strategy is to keep users satisfied and to attract new users to the public transport system.
Given that many interchanges are situated below ground level and can be used by modes of transport (buses) that emit harmful gases and increase the ambient temperature, special attention must be paid to the Environmental Management Plan, monitoring the environmental conditions: temperature, ventilation, humidity, and detection and control
of airborne pollutant gases.
The possibility of obtaining direct income through management of the interchange
the social profitability, as is the case with other public works, and to consider using the administrative concession system for its construction and operation.
• Safety and security
Safety and security are two of the most important pillars of any transport infrastructure, and particularly so in the case of transport interchanges, given that they are used intensively by tens of thousands of people on a daily basis. We have seen these aspects affect the general design of the interchange, thus must be considered when meeting other requirements, for instance in information and signalling, accessibility, interchange management and operation, etc.
Safety must be developed and improved from the design point of view, in order to facilitate the rapid evacuation and clearance of these buildings, as well as the rapid evacuation of the fumes caused by a fire.
2. INTRODUCTION
2.1 Background
The European Bus System of the Future (EBSF) project is conceived as a driver to increase the attractiveness and raise the image of the bus systems in urban and suburban areas, by means of new technologies on vehicles and infrastructure in combination with operational best practices, in a system approach.
The main project objective is to design and validate a new breakthrough generation of urban bus systems, which will stimulate European cities to improve the existing services, making public transport more attractive and improving the competitive position of European bus manufacturers and operators worldwide.
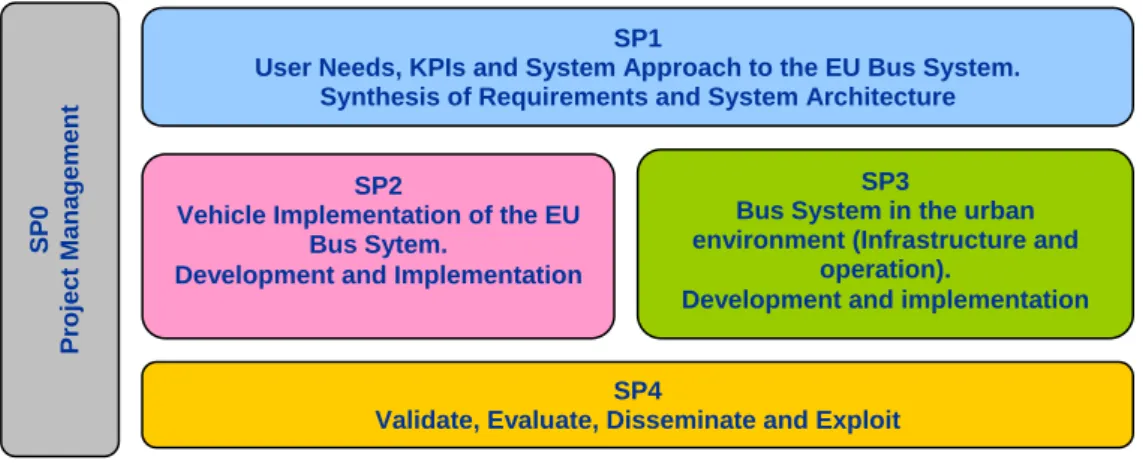
The project is structured in five subprojects shown in the following picture.
Figure 1 – Estructure of the EBSF
SP1 define the needs of the passengers, operators and authorities. It also identifies Key Performance Indicators and establish evaluation methodology to assess the performance of the bus system. SP2 defines vehicular technologies concepts and prototypes based on the user needs and requirements of SP1. SP3´s objective is to ensure a smooth integration of the bus sytem in the urban environment, and to enhance the organization of the intermodality in the urban area. And SP4 will validate and test the results of SP2 and SP3 in seven European “showcase cities” (Bremerhaven, Brunoy, Budapest, Gothenborg, Madrid, Rome and Rouen). It will also develop a vision of the “European Bus System of the Future” and carry out dissemination activities.
The scope of SP3 is to incorporate the statements and findings of SP1 “System Approach”, and to transform them into practical operational issues, as resulting from daily operations, as far as operation and infrastructure are concerned. As well as SP1 will provide inputs to SP2, SP3 will indeed build on the outputs from SP1, assuring that the vehicular technologies and the prototypes developed in SP2 are harmoniously integrated in the urban environment, thus turning into the European Bus System of the Future. These achievements will be made taking into account key factors like intermodality (WP 3.1), information systems (WP 3.2) and operational costs (WP 3.3).
SP1
User Needs, KPIs and System Approach to the EU Bus System. Synthesis of Requirements and System Architecture
SP2
Vehicle Implementation of the EU Bus Sytem.
Development and Implementation
SP3
Bus System in the urban environment (Infrastructure and
operation).
Development and implementation
SP4
Validate, Evaluate, Disseminate and Exploit
SP0
Project Mana
g
e
WP 3.1 is the heart of SP3 as it incorporates and mixes bus vehicle, operational and infrastructure components. It explores the various types of bus services, with outputs focussing on the problematics that can differ from one type to another one: regular bus services operating in mixed traffic in the core parts of large urban areas, bus services operating on dedicated lanes, or feeder bus services connected to heavy modes in suburban areas. It will also address the conditions of an optimal integration with other transport modes, whichever public or private - intermodality issues -, to ensure the bus system its best efficiency and to contribute to a seamless mobility for all categories of customers.
2.2
Description of the work in WP 3.1
2.2.1 OBJECTIVES AND DELIVERABLESWP 3.1 will start with an assessment of transport and traffic policies, in various urban contexts, which constitute the urban environment of bus systems operations, and address the intermodality issues:
Task 3.1.1: Analysis of specific requirements on intermodality coming from SP1 Task 3.1.2: Multimodal coordination with other PT modes: integrated fare system
between different modes and operators; real time and fixed information (bus in correspondence with tram, metro, commuter rail); space and other infrastructure requirements, etc.
Task 3.1.3: Multimodal intermodality with complementary modes: cycling and
pedestrian; parking policies, including park & ride; car sharing; taxi and other modes, etc.
Task 3.1.4: Coordination with general transport traffic and other related policies:
road traffic and local policy; impact of various traffic policies including congestion charging; integrated master plans and sustainable transport plans, etc.
Task 3.1.5: Intermodality / Connection hubs / Transit centres: attractive design and
architecture participating to the public space; appropriate alternatives to the different urban contexts; intermodal articulation between buses and other public transport modes, and with individual modes (intermodal connection hubs).
WP3.1 will then address a limited number of issues directly related to bus system operations in Task 3.1.6 Optimised monitoring of operations, Task 3.1.7 Passenger navigation inside PT networks and Task 3.1.8 Station design.
This deliverable D3.1.2 Functional requirements and classification for intermodal transport hubs is the result of the assessment done in tasks 3.1.2, 3.1.3, 3.1.4 and 3.1.5.
The objective is to set a typology of connection hubs according to the size of the city and the transport modes, and assess the most important parameters to be optimised to get an optimal attractiveness: time scheduling, facilities layout, information on urban surroundings, etc.
2.2.2 METHODOLOGY OF THE WORK
The work team is composed by 14 partners associated to the WP3.1: European bus manufacturer: EvoBus, Man, Volvo
Transport operators and national transport associations: Asstra, ATM, BHVBUS, RATP, RATB, ATAC Roma, Veolia/Eurolum
Public transport authorities: CRTM, NMCU
During our first meeting we decided to create a tool to structure our analysis. The work should be the logical continuation of the works already made in the project. Indeed, we had to guarantee that our work will meet the needs and requirements which have been identified in SP1. Thus to help us to lead our analysis we have built a sheet which have been used for each task.
For each task we have identified in refer to D1.1.1, the areas of investigation, the user needs and the requirements that had a link with the topic of the task, in this case, intermodality. Then, each partner has been invited to complete the sheet (see Annex 2 as example of the table), and the technical recommendations and technical solutions have been included in the different factors of success and innovation of a hub.
Requirements area Task Performance and Technical Recommendation Technical solution Urban context Barriers Favourable conditions Counterpart / negative impact of proposed actions Contrasted examples 2.2.3 REPORT STRUCTURE
The document was thought to make a classification of transport hubs and define the factors that make them successful. To do so, first the different modes of transport have been analysed, and the role of the bus in the transport network. But there is a need of coordination of different modes and stakeholders at different levels to offer good quality efficient public transport able to compete with private car. Intermodality is one of the answers, and its main representation are the interchanges or transfer points.
Thus, this deliverable D3.1.2 Functional requirements and classification for intermodal transport hubs is structured in the following main parts:
• Public Transport networks:
Classification of different modes of Public Transport Operation speed of public transport systems
The reality of on-surface public transport systems Mobility and public transport
Intermodality as main factor to create network
• Cohesion factors of the network: intermodality
• Typologies of points of connection Long distance interchanges Metropolitan interchanges
Urban interchanges (or intermodal areas) “Connecting points”
• Functional requirements of a hub or interchange
3. PUBLIC
TRANSPORT
NETWORKS
3.1
Classification of different modes of PT
3.1.1 CHANGE IN PUBLIC TRANSPORT SYSTEMS CONCEPTION
Cities in the end of 19th century and beginning 20th century understood that they could restructured their growth around the public transport infrastructures existing at that time, that were mainly rail modes such metro, tram and suburban railway. Many examples of this integration of public transport with urban growth can be found throughout the world, such as the Arturo Soria’s “Linear City” and its integration with the tram, which was 100% private funded, in the surroundings of the former Madrid municipality (Spain).
However, in the second half of 20th century, the massive emergence of the private vehicle and the strong parallel development of bus networks, led in many cities to the disappearance of the public transport systems that shared street infrastructure with cars and were less flexible, like trams first and trolleybuses then. The private companies’ creation and the welfare state progress made us forget many of these basic aspects, such as the integration, the private financing or the space reserve for public transport.
In this context the number of options of public transport offer was limited to basically two options for urban transport (metro or urban bus) and two for metropolitan transport (suburban railway or metropolitan bus), in such a way that rail systems run on segregated independent infrastructure, and buses or tire-based systems run on share infrastructures with the rest of the traffic.
Under this conception, it was clear that fast public transport systems in big cities and metropolitan areas were rail systems, which could reach considerable speed and capacity due to their exclusive infrastructure. Thus, a theory arise in the second half of 20th century, on which rail rolling stock technology should run on separated infrastructure, while bus was left to share street network with the rest of the traffic. It is in 80s and 90s when some kind of space reservation for buses appears, by means of side bus lanes marked with paint or separated by some type of protection.
This conception starts to break at the end of 70s, when cities and countries that had kept the trams, as Germany, understood that the solution was to foster them by giving the trams a reserved running-way or some self space for their circulation, aiming at increasing their capacity, their speed and in short, their transport quality. It is then when the later-called light rail or modern tram appears, as a new mode of transport which improves the operation conditions and the service quality of the public transport thanks to the reserved space. This separated running-way is what gives sense to the term “light”, not making reference to the vehicle, but to the infrastructure (vs. “heavy” rail), contrary to what is thought.
With the appearance of the reserved running-way for on-surface public transport, a new conception of public transport modes was highlighted, in such way that it was not only the technology what characterized the different transport modes, but also the support infrastructure opened possibilities to develop new modes, so called “medium capacity systems”.
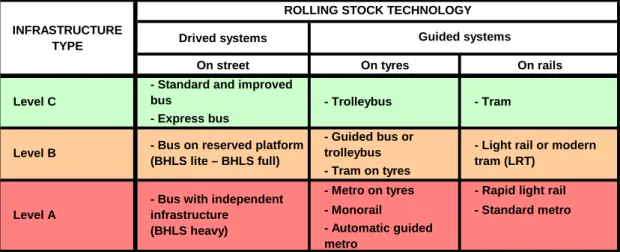
3.1.2 A CLASSIFICATION OF URBAN PUBLIC TRANSPORT MODES
This new conception of public transport modes starts from the three-elements system approach, which combination make the difference between modes. That means a public transport mode is defined by a group of integrated measures on a support infrastructure over which a certain rolling stock runs with specific service operation and explotaiton conditions. Thus, infrastructure, rolling stock and operation are the three elements which define and classify the different modes of public transport. This classification was developed by Vuchic in the early 80s, and is widely accepted by the international community.
In a system approach, these three elements differentiate the modes, making untrue the thought that is the rolling stock what makes the difference. Today we know that the level of segregation of the infrastructure or collective transport right-of-way (ROW) from the rest of the traffic is what does make the difference. This level of segregation or ROW have an influence on the different functional characteristics of the public transport (commercial speed, supply capacity, comfort, safety, regularity, punctuality,etc.) as well as in the implementation costs and operation costs, to a greater extent than the technology itself. This explains the significance of such characteristic in the transport systems.
From the infrastructure point of view, three levels or categories are differentiated regarding the level of segregation of the infrastructure over the rest of the traffic, vehicles and pedestrians, from more to less segregation:
• A Category or A Level: Independent right-of-way, or fully segregated, no
at-level crossings with vehicles or pedestrians, therefore completely independent infrastructure. The route can run in tunnel, viaduct or on surface. In exceptional cases there might be some crossings at same level, though they will be spreaded and protected by means of barriers or signals to minimize their incidence on the functional requirements of the line.
• B Category or B Level: Partially controlled or reserved infrastructure, refers
to public transport modes that are physically separated from the rest of the traffic, but with at-level crossings with vehicles and/or pedestrians, including junctions. This physical segregation is made with kerbs, elevations of the street level, or segregated running-ways.
• C Category or C Level: On street shared infrastructure, or without reservation, refers to on street infrastructure on which collective transport is mixed
with the rest of the traffic, though some preferential treatment to public transport can be provided, such as bus lanes.
There is a clear evidence that modes with higher levels of segregation or infrastructure independency have greater supply capacity and better functional features than those with lower level of infrastructure segregation or those shared with other traffic.
Last years have been highlighted that bus-based systems can reach almost same functional characteristics in quality service than the rail-based systems, by giving a fully segregated infrastructure to the bus. These are cases in South America, first in Curitiba (Brasil), then in United States, initially with BUS-HOV systems. All of them have driven the change in conception that is actually applicable in Bus Rapid Transit (BRT). This has led
to plan bus systems with innovative infrastructure proposals, not only with reserved running-way (as the Busway in Nantes), but also with an independent platform or exclusive right-of-way in some sections (as the BUS-HOV in Madrid).
On this basis, the figure below represents the different public transport modes regarding the level of segregation of the infrastructure and the technology of the rolling stock. We can conclude that systems with same category on infrastructure deliver more similar functional characteristics than those in the same category of rolling stock. For example, light rail transit is more like to bus on reserved platform than to a metro.
With this approach, EBSF project (European Bus System of the Future), www.ebsf.eu,
together with the COST Action BHLS (Buses with High Level of Service), www.bhls.eu, try
to highlight the potential of bus systems in our cities, especially when the bus has a space reservation, BHLS, from the BHLS lite option to the BHLS full.
Also the bus running on shared infrastructure (Category C) has a great facility to enhance, with small actions on the infrastructure but significant improvements on vehicles and operation.
Figure 2. Classification of urban public transport modes
3.2
Operation speed of public transport systems: the effect of the
distance between stops
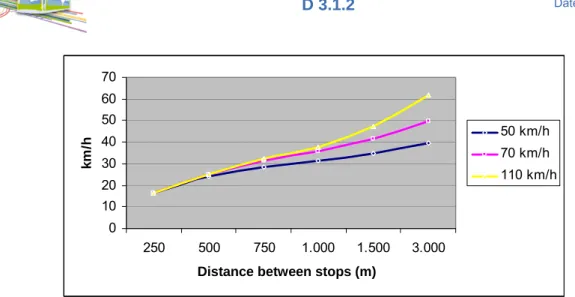
One of the most relevant aspects in public transport, though usually is not considered such as, is the distance between stops or stations in a line, whether it is a rail or tyre-based system. It is probably the main characteristic to determine the commercial or operational speed of a line, therefore, its attractiveness for the passenger.
Considering a hypothetic line, with uniform distance between stops and with no geometric considerations, we can conclude that for short distances between stops (250 m) the speed operation is very low (16 km/h), independently of the maximum speed of the vehicle. As the inter-stop distance increases, the commercial speed also increases, and the longer the distance, the greater is the effect on the speed of the vehicle (Figure 3), up to 40 km/h in systems with independent infrastructure which are able to run over 50 km/h.
INFRASTRUCTURE
TYPE Drived systems
On street On tyres On rails
- Standard and improved bus
- Express bus
- Guided bus or trolleybus - Tram on tyres
- Metro on tyres - Rapid light rail
- Monorail - Standard metro
- Automatic guided metro
Level B - Bus on reserved platform
(BHLS lite – BHLS full)
- Light rail or modern tram (LRT)
Level A
- Bus with independent infrastructure (BHLS heavy)
ROLLING STOCK TECHNOLOGY Guided systems
Figure 3. Speed operation function of the maximum speed of the vehicle
If we consider public transport lines in urban context, with inter-stop distances around 500 m, we obtain theoretical speed operation hardly over 25 km/h in metro systems and 20 km/h in bus or light rail systems. But if the distance reduces down to 250 m, as it is usual in many urban bus systems, the theoretical speed operation rarely will reach 15 km/h. This is a key aspect when planning new infrastructures: a choice have to be made between building many stops to satisfy most of the citizens thus slower speed, or increase the distance between stops to reach higher velocities.
Reserved platform or independent infrastructure systems must be planned to obtain the maximum potential of them according to the urban context where it is implemented. This mean the distance between stops might be larger aiming to increase the attractiveness of the system for the potential users.
This inter-stop distance increase has a disadvantage: the passengers will have to walk longer distances to reach the stops, but the bus has the advantage of possibiliting different functional types of lines, more or less structurant or trunk role, with longer distances between stops, vs other proximity or feeder lines with shorter inter-stop distances. The first ones are focused on a longer distance mobility, and the second ones are oriented to shorter distance mobility.
3.3
The reality of on-surface public transport systems
A recurrent issue is that the public transport user has a natural preference to travel on surface, not only because of claustrophobia troubles, but also because it is more pleasant to see and enjoy the city than travelling underground. Only the speed, regularity, frequency and certainty of the service provided by the underground systems with independent infrastructure, can make the user choice favour them in front of the on-surface systems.
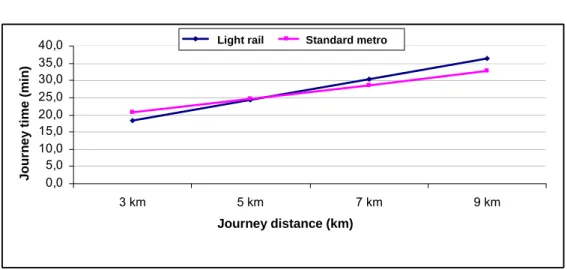
But the rapidity and the journey time are influenced not only by the operational speed of the system, but also by other components as the distance between stops, as we have seen before, because it has an influence in the walking time to reach the stop (going/returning to/from the stop), access time to entry or leave the station. All these time components can lead to shorter journey times in on-surface modes for short travels, and in independent infrastructure modes (case of the underground in many city centres) for longer trips (Figure 4).
0 10 20 30 40 50 60 70 250 500 750 1.000 1.500 3.000
distancia entre paradas (m)
km
/h
50 km/h 70 km/h 110 km/h
Distance between stops (m)
0 10 20 30 40 50 60 70 250 500 750 1.000 1.500 3.000
distancia entre paradas (m)
km
/h
50 km/h 70 km/h 110 km/h
Figure 4. Journey time comparison between light rail and standard metro
Note, general hipothesys:
- Walking speed: 4 km/h
- Light rail or bus bhls: distance between stops 500 m; service frequency 6 min; commercial
speed 20 km/h
- Standard metro: distance between stops 800 m; service frequency 3 min; access time
street-platform 1.5 min; commercial speed 30 km/h
This figure tries to highlight the potential of on-surface reserved platform systems in relation with the journey time, fact that should not be discounted, where the bus can play a significant role with the BHLS or reserved platform systems.
But also we must highlight that the longer the distance to travel, there is a need of greater speed, thus more need of segregated infrastructure to provide such speed, and need of greater maximum speed of the rolling stock. In this sense, the suburban railway is the most suitable mode of transport in metropolitan aglommerations for trips from the surrounding metropolitan areas to the city centres, due to its high speed. The development of express suburban rail networks with passing lines, well integrated in the city centres with metro, tram and bus networks, makes it an essential mode, as in Paris, London, Berlin, Madrid, etc. However, the bus can have a very significant role in this metropolitan mobility, as it has been demonstrated in the BUS-HOV in Madrid, where the metropolitan bus in that corridor channels more passengers than the suburban railway.
3.4
Mobility and public transport
Public transport systems must give answer to the different mobilities that exist in our cities and metropolitan areas. To do so, we must know the modal share between public and private transport in European cities, in order to identify the weaknesses of public transport and the potential areas to promote it.
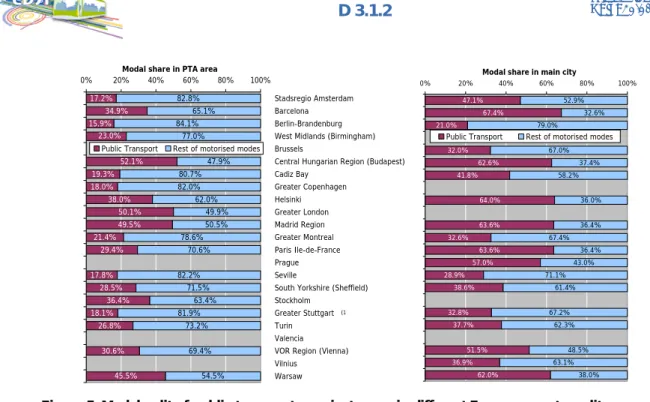
According to EMTA Barometer 2008 (Association of European Metropolitan Transport Authorities) (Figure 5), considering motorised trips, the share public transport vs private vehicle is favoured to public transport in main cities, as in Barcelona, Brussels, Copenhagen, Helsinki, Madrid, etc. However, considering the whole metropolitan area, the share is clearly favoured to the private vehicle.
0,0 5,0 10,0 15,0 20,0 25,0 30,0 35,0 40,0 3 km 5 km 7 km 9 km
Logitud del viaje (lm)
Ti e m po V ia je ( m in )
Metro ligero Metro convencional
Journey distance (km) J o u rn e y tim e ( m in )
Light rail Standard metro
0,0 5,0 10,0 15,0 20,0 25,0 30,0 35,0 40,0 3 km 5 km 7 km 9 km
Logitud del viaje (lm)
Ti e m po V ia je ( m in )
Metro ligero Metro convencional
Journey distance (km) J o u rn e y tim e ( m in )
Figure 5. Modal split of public transport vs private cars in different European metropolitan areas (Source: EMTA Barometer 2008)
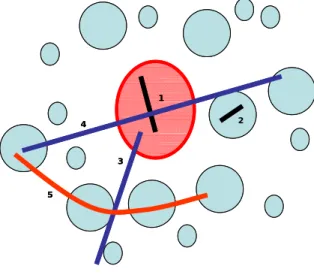
Analysing more in detail what happens in our European cities, which are of different sizes, usually developed in metropolitan areas around a main or principal city, we can differentiate at least 4 types of mobility (Figure 6):
1. Mobility inside the main city, marked in the figure as (1);
2. Radial mobility between metropolitan cities and main city, marked in figure as (2); 3. Mobility inside cities of the metropolitan crown, marked in the figure as (3); 4. Mobility between cities of the metropolitan crown, marked in the figure as (4). Mobilities marked as (1) and (3) are urban trips, while mobilities signed as (2) and (4) are metropolitan trips, that is between metropolitan cities. We can also point out that mobilities (1) and (2) are trips related with the main city, while (3) and (4) are not.
Figure 6. Mobility typologies in metropolitan areas 1 2 4 3 1 2 4 3 Modal share in PTA area
34.9% 15.9% 52.1% 19.3% 18.0% 38.0% 50.1% 49.5% 21.4% 29.4% 17.8% 28.5% 36.4% 18.1% 26.8% 30.6% 45.5% 82.8% 65.1% 84.1% 77.0% 47.9% 80.7% 82.0% 62.0% 49.9% 50.5% 78.6% 70.6% 82.2% 71.5% 81.9% 73.2% 69.4% 54.5% 17.2% 23.0% 63.4% 0% 20% 40% 60% 80% 100% Stadsregio Amsterdam Barcelona Berlin-Brandenburg West Midlands (Birmingham) Brussels
Central Hungarian Region (Budapest) Cadiz Bay Greater Copenhagen Helsinki Greater London Madrid Region Greater Montreal Paris Ile-de-France Prague Seville
South Yorkshire (Sheffield) Stockholm
Greater Stuttgart Turin Valencia VOR Region (Vienna) Vilnius
Warsaw Public Transport Rest of motorised modes
Modal share in main city
67.4% 21.0% 32.0% 62.6% 41.8% 64.0% 63.6% 32.6% 63.6% 57.0% 28.9% 38.6% 32.8% 37.7% 51.5% 36.9% 62.0% 52.9% 32.6% 79.0% 67.0% 37.4% 58.2% 36.0% 36.4% 67.4% 36.4% 43.0% 71.1% 61.4% 67.2% 62.3% 48.5% 63.1% 38.0% 47.1% 0% 20% 40% 60% 80% 100%
Public Transport Rest of motorised modes
As an example or case study, we analyse below (Figure 7) the mobility situation in Madrid metropolitan area to understand better the public transport potential and the mobility policy it should be followed, underlining that:
• Internal trips in Madrid city (1) represent half (50.3%) of the total trips, which is coincident with the weight of population in the whole area, same proportion. Public transport trips are the majority (40.1%) due to the extensive metro and urban bus networks and the integrated ticket, what makes the public transport attractive for most of the trips. In second place with a third of the mobility (33.5%) are the walking trips, so much forgotten in many European cities, but so important in Madrid because of the density and the city type (though it is truth that bikes occupy this place in many European cities). Lastly, the private vehicle has less than one fourth of trips (23.4%). In total, we could say that almost 75% of the mobility in Madrid city is sustainable, keeping in mind that Madrid is a big city, with more than 600 km2.
• Internal trips in the rest of metropolitan cities (3) represent almost a fourth (24.8%) of all trips, which is a very high percentage. This urban mobility shows the importance of the walking trips (56.3%), very common in medium sized cities, reaching sometimes 200,000 inhabitants but usually smaller than that. However, what is surprising is the weight of trips on private vehicles (33.3%) against the small share of trips on public transport (8.1%), even more when trips are rarely longer than 5-6 km distance.
• Radial mobility between metropolitan crown and main city (2) has a weight of 15.4%. In this case, the share between public transport and private vehicle is equally balanced, slightly favoured to private car (49.2%), what shows the potential of the suburban or commuter railway and also of the metropolitan bus, to channel this mobility.
• Finally, the transversal mobility (4) has a weight of almost 10% (9.5%) but continuously growing. It is in this kind of mobility where private vehicles show their maximum potential, more than 2/3 of the mobility (67.9%), and so where the public transport must look for new formulas to gain the market part with higher growth potential, and where the bus can be one of the best solutions due to its characteristics.
Figure 7. Modal share in Madrid metropolitan area
Walking Public transport Private vehicle Rest of modes Inside (to and from) Madrid municipality
Urban trips [1] 50,3% 33,5% 40,1% 23,4% 2,9%
External to/from Madrid municipality
Radial trips [2] 15,4% 0,6% 46,4% 49,2% 3,8%
Inside municipalities, rest of the region
Urban trips [3] 24,8% 56,3% 8,1% 33,3% 2,4%
External municipalities, rest of the region
Transversal trips [4] 9,5% 2,1% 24,4% 67,9% 5,7%
31,1% 31,6% 34,1% 3,2%
Total modal share in the region Trips typology
Modal share Share by
We can observe that so many different types of mobility need different solutions: faster and direct services for longer metropolitan distances, feeder services to trunk services, more spatial coverage in shorter trips, etc. Bus sytems have the versatility to give answer to them with efficient systems, especially those systems with reserved space (BHLS), due to the speed, regularity, reliability, comfort and image they can provide. These types of solutions already exist in many places in Europe, as those shown in Figure 8. There we find some examples of BHLS systems in Europe, where the solutions range is very extensive providing different options according to the urban setting of each city.
Figure 8. Examples of BHLS systems in Europe according to the type of mobility they cover
3.5
Intermodality as main factor to create network
The complexity of the mobility explained before makes necessary in metropolitan areas to use more than one transport line in the majority of trips, independently of the metropolitan area size. This turns out in the importance of the intermodality, understood as a whole in terms of physical integration; fare, schedule and information integration; administrative integration (with the presence of the unique authority), etc.
The bus has the advantage of the adaptability to these intermodality needs, giving different answers in each case, with feeder lines connecting with massive transport networks or more rapid lines as the suburban or commuter railway or metro, and even tram, etc.
But also the bus can play the role of trunk or structural lines, with full or lite BHLS systems, which might be one of the major challenges for the future in medium-sized cities (Castellon, Nancy, Lorient, etc.) or in specific contexts in big metropolitan areas (TVM-Paris, Zuidtangent-Amsterdam, Jokeri line-Helsinki, etc.)
In any case, the lines of different public transport modes, and specially bus lines, must be developed in a way for the citizen to see them as a whole network. However, this is the weakest aspect of the bus systems, because the users see the bus as a group of certain number of bus lines (4 or 5 lines he knows) but never as an integrated network which can be used with a single transfer. This is the point where a big effort can be made, to break this barrier, to get the public transport users supported on intermodality to acquire a conception of the whole bus network.
1 3 5 2 4 1. Castellon 2. Almere 3. Nantes 4. Lorient 5. TVM 1 3 5 2 4 1. Castellon 2. Almere 3. Nantes 4. Lorient 5. TVM
4.
COHESION FACTORS OF THE NETWORK:
INTERMODALITY
Public transport forms an essential part of society and offers great opportunities to integrate the latter with health, education, work and leisure, which results in better social and economic systems and a higher quality of life for all. A well designed and properly integrated and managed transport system helps us to achieve the objective of sustainable mobility in our cities.
However, mobility presents increasingly complex patterns, a consequence of a less integrated urbanism, which means that trips start increasingly further away from the destination and therefore include a higher number of stages. Given that the user regards the trip as a continuous activity, it is advisable not to divide it into different parts if we want to achieve a sustainable balance of the system. It is very important, therefore, to ensure that the public transport user perceives his trip as a “unit”, to which end it is necessary to reduce the sense of “trip fragmentation” caused by transfers.
KEY CONCEPT:
In order to be able to compete with the private vehicle, which is more capable of providing this continuity, an integrated planning, coordination and management of public transport is required, essentially focused on three basic aspects: administrative integration, fare integration and modal integration.
These three aspects give rise to intermodality, given that the aim is to optimise each portion of the trip by choosing the mode, fare or operator most suited to the user’s needs and circumstances, facilitating the transfer from one to another and increasing the sense of “seamless trip”. Therefore, the integration of all these aspects is necessary in order to encourage the use of public transport and favour a more efficient and sustainable mobility.
Hence, we can highlight the main benefits of an effective intermodal coordination:
• Lowering transport costs by allowing each mode to be used for the portion of the trip for which it is best suited (this concept addresses the notion of “co-modality”,
introduced by the EC in 2006)
• Increasing economic productivity and efficiency, thereby enhancing the global competitiveness
• Reducing the load on overstressed infrastructure components by shifting use to infrastructure with excess capacity
• Generating higher returns from public and private infrastructure investments
• Improving mobility for the elderly, disabled, isolated, and economically disadvantaged
• Reducing energy consumption and contributing to improved air quality and environmental conditions.
In the following sections, the three main aspects of intermodality are explained:
• administrative integration,
• ticket and fare integration, and
• modal integration.
4.1 Administrative
integration
Administrative integration corresponds to the coordination of all public transport networks in a single body within a certain functional geographical area which has a socio-economic unity of action and an all-encompassing and harmonious development. These Public Transport Authorities (PTAs) coordinate and plan the management of the different public transport systems in an agglomeration or metropolitan area, and therefore it is advisable that the relevant powers of other administrations be transferred to or conferred upon these bodies. However, the single body is not the only solution, depending on the political and geographic context of the metropolitan area it might be advisable to have the cooperation amongst more flexible bodies to manage the transport systems and other related issues. For instance, there is a very strong relationship between land use and mobility, ought to lead to better integration of urban planning. Land use should take into account of transport policy and vice-versa, easing a good planning and the anticipation of potential future changes that will go a long way towards heading off possible future mismatches between supply and demand. Cooperation between the actors (transport authorities, planners, private developers, etc.) is therefore crucial at local and regional levels if an integrated, coherent policy is to result.
Another example is the parking policy, which deals very much with public transport. If parking control and restrictions are implemented, public transport should be shown as a mobility alternative to leave the private car at home, or provide spaces (park&ride for example) to facilitate the transfer to public transport.
This institutional component of integration of different sectors and levels is increasingly important. New mobility patterns require new and innovative services that satisfy new market sectors which have lower demand volume but different service quality requirements, for example. It is these innovative mobility services, which focus more on the customer and less on the general demand, what can compete with the private vehicle, given that they meet the needs and expectations of each user at any given time. The Public Transport Authorities provide the necessary framework for the appearance of these services in the General Urban Mobility System, where the rules are defined within the stable environment of the Authority and the dynamic and innovative aspects are developed by the operators and service providers. However, the more operators and services to integrate, the more complex and expensive is the process of integration.
Many different forms of administrative integration exist, but there is a clear tendency to concentrate powers not only in public transport, but also in other forms of mobility (bicycle, private vehicle, car sharing, car pooling, etc.), that we could call Mobility Agencies, with the aim of carrying out an integral management of mobility, promoting the use of public transport (supply) while at the same time managing demand at all levels.
4.2
Ticket and fare integration
Ticket and fare integration is a broad concept, but it can be summed up in terms of a single ticket, i.e. a multimodal transport ticket which is valid for the different modes that operate in a coordinated manner within a certain geographical area (metropolitan area, agglomeration, region, etc.) under the control and supervision of the corresponding transport authority.
The ticket integration earns lots of time and simplifies the access to public transport. It can result from the integration of different operators, modes, networks, or even other services (parking, toll roads, electronic purses, theatres, etc.) up to a ticketing nearly virtual, using new and faster electronic ticketing and innovative fare systems. This integration results in the need of dealing with the distribution or allocation of the ticket revenues to the different operators involved in the transport system, thus sometimes complex systems of payments between PTA and/or operators.
From the perspective of the public transport system, fare integration allows the different lines to function as part of a network, optimising routes and the supply of vehicles. A disadvantage of this type of action is that it entails, at least initially, a system deficit increase, since the average weighted fare is reduced by virtue of the fact that some trips (transfers) which previously had to be paid for no longer generate revenue. Nevertheless, this deficit can be alleviated in part by an across-the-board increase in fares, which is justified by the better supply that results from integration, as well as by a possible increase in passengers arising from this integration, and taking into account in the payment to the operator some induced demand.
The spectacular advances made in computer and telecom technology are playing a vital role in solving problems of fare collection and allocation. Fare integration does not necessarily require technical enhancement, but the integration of new technologies can be a great help.
4.3 Modal
integration
If public transport is able to compete with the private vehicle on an equal footing, the user should ideally be able to make his trip from door to door in a shorter or similar journey time. For this purpose, it is necessary to significantly improve public transport by making their networks simple in terms of transfers, easy to understand and attractively safe.
Information is an integral and essential part of any public transport service, and is a prerequisite for its use. It is vital to offer integrated transport information, taking account of the various service providers, to provide the modal integration. Information on public transport (pre-trip, during and post-trip) must be readily available, complete, clear and presented in a uniform manner. Consequently, information should be presented in an utterly consistent way throughout the network. Latest technologies can help to offer high-quality, user-friendly information, but it may not let us forget that extensive passenger information can already be provided using cheap and traditional means of communication. Within the modal integration, the operational integration is fundamental (for example, schedules coordination). That will contribute to decrease the waiting time in changing
mode or line (therefore the total journey time), and promotes the image of an integrated system.
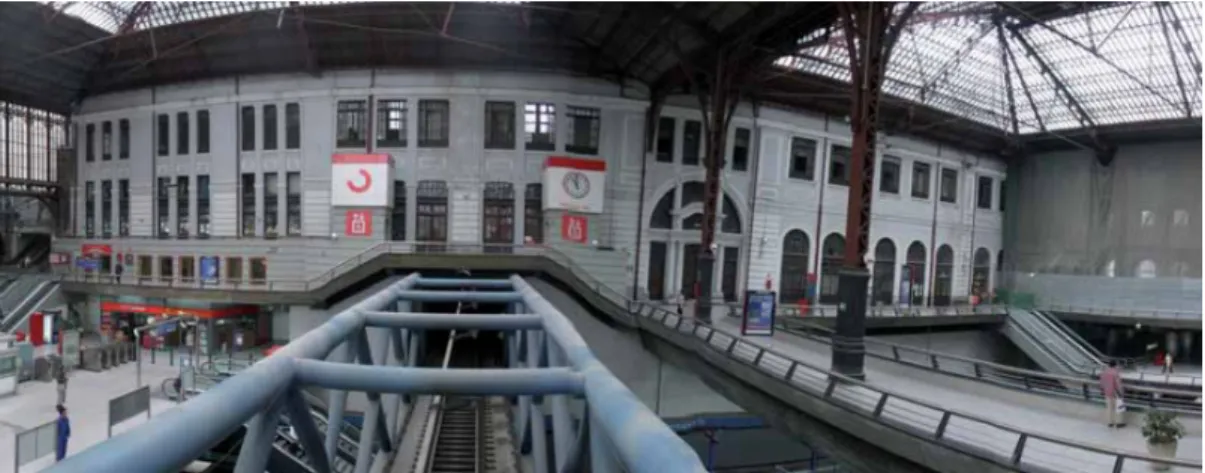
In addition to the information and operational integration, it is necessary to design a public transport network that maximises its connectivity and minimises the drawbacks inherent in any transfer by means of transport interchanges. Interchanges constitute a crucial part of the public transport system, in that they allow passengers to make a wide range of trips in a comfortable and convenient manner, and contributing to a seamless mobility. If we want more and more people shifting from private transport to public transport, it is obvious that the old concept of train or coach stations is no longer valid, giving way to multimodal interchange stations.
Figure 9 – Example of modal integration in Madrid (Spain)
A transport interchange point should therefore be an area permanently devoted to facilitate the interchange of passengers between different modes of transport, in which a suitable design reduces walking distances to a minimum and the waiting environment meets the needs of the passenger. To this end, the following goals and objectives must be achieved.
The main goals for developing transport interchanges are:
• To promote the use of public transport
• To increase the environmental efficiency of the transport system
• To improve the quality of life in urban agglomerations and metropolitan areas. According to these goals the following objectives must be on focus:
• To facilitate transfers between modes
• To integrate the interchange into its urban environment both aesthetically and functionally
• To design fare systems that minimise the issue of different tickets and validation times
• To establish a management system that facilitates the coordination of services and operators
• To implement information, signalling and lighting systems that facilitate the understanding of the interchange.