Elliptical Dot Arrays
Orhan Bulan
, Student Member, IEEE
, and Gaurav Sharma
, Senior Member, IEEE
Abstract—We present a new high capacity color barcode. The barcode we propose uses the cyan, magenta, and yellow (C,M,Y) colorant separations available in color printers and enables high capacity by independently encoding data in each of these sepa-rations. In each colorant channel, payload data is conveyed by using a periodic array of elliptically shaped dots whose individual orientations are modulated to encode the data. The orientation based data encoding provides beneficial robustness against printer and scanner tone variations. The overall color barcode is obtained when these color separations are printed in overlay as is common in color printing. A reader recovers the barcode data from a conventional color scan of the barcode, using red, green, and blue (R,G,B) channels complementary, respectively, to the print C, M, and Y channels. For each channel, first the periodic arrangement of dots is exploited at the reader to enable synchronization by compensating for both global rotation/scaling in scanning and local distortion in printing. To overcome the color interference re-sulting from colorant absorptions in noncomplementary scanner channels, we propose a novel interference minimizing data en-coding approach and a statistical channel model (at the reader) that captures the characteristics of the interference, enabling more accurate data recovery. We also employ an error correction methodology that effectively utilizes the channel model. The experimental results show that the proposed method works well, offering (error-free) operational rates that are comparable to or better than the highest capacity barcodes known in the literature.
Index Terms—Color barcodes, color interference aware en-coding, elliptical dot barcodes, high capacity barcodes, sequential decoding.
I. INTRODUCTION
B
ARCODES that encode digital data on physical media are commonly utilized in commercial applications for tracing/tracking of trade items, in security applications forManuscript received March 11, 2010; revised September 11, 2010; ac-cepted October 30, 2010. Date of publication November 15, 2010; date of current version April 15, 2011. This work was supported in part by a grant from Xerox Corporation and by a grant from New York State Office of Sci-ence, Technology & Academic Research (NYSTAR) through the Center for Emerging and Innovative Sciences (CEIS). A precursor of this work was presented at the 2009 IS&T/SPIE Electronic Imaging Symposium [1]. The associate editor coordinating the review of this manuscript and approving it for publication was Dr. Maya R. Gupta.
O. Bulan is with the Department of Electrical and Computer Engineering, University of Rochester, Rochester, NY 14627-0126 USA (e-mail: bulan@ece. rochester.edu).
G. Sharma is with the Department of Electrical and Computer Engineering, the Department of Biostatistics and Computational Biology, and the Department of Oncology, University of Rochester, Rochester, NY 14627-0126 USA (e-mail: [email protected]).
Color versions of one or more of the figures in this paper are available online at http://ieeexplore.ieee.org.
Digital Object Identifier 10.1109/TIP.2010.2092437
linking personal documents with a user, or in other applications as an auxiliary channel to encode additional information on a physical medium. By carrying a stream of digital data in phys-ical media, which are fundamentally analog, these methods can add security and functionality and features that are associated with digital techniques at the expense of consuming space on the media.
In several barcode applications, small barcodes with high storage density (i.e., high capacity) are desirable. For instance, in personal IDs, driving licenses and passports, high capacity can enable the encoding of a sample speech signal, a picture, or other identifying personal information which in turn may be used to establish authenticity of the printed document and/or the identity of the user. Particular examples proposed in the literature include identification cards based upon biometrics [2] and print signatures for document authentication [3]. Similarly, in a document workflow application high capacity barcodes offer an attractive mechanism for improving scanned image quality—where the barcode can be utilized to store the addi-tional information for improving the image quality [4]. Several of these applications favor a push toward higher data rates for barcodes, which is the specific goal that we address in our work. Several 2-D barcode technologies have been proposed in the literature [5]–[11] to enable high capacity barcode applications. Though these techniques typically offer higher data payloads than their 1-D counterparts, many of these technologies are primarily based upon monochrome (i.e., single ink) printing [5]–[7], [10], [11]. Color barcodes, on the other hand, offer another attractive method for increasing capacity, which is increasingly accessible with desktop color printing becoming commonplace. Care must, however, be exercised in designing color barcodes to ensure that they are robust to variations in the color printing and scanning processes—which have a greater impact when considering color rather than black/white reproduction and capture.
In this paper, we propose a high capacity color barcode by using the cyan, magenta, and yellow colorant channels avail-able in color printers to independently carry payload data, and thereby offer an increase in capacity over monochrome realiza-tions. In individual print colorant channels, we convey data by using a periodic array of printed elliptically shaped dots and modulate the orientation of these dots in order to encode the data. The technique is motivated by and utilizes elements from a print-scan resilient data hiding method that we recently pro-posed [12]–[14] for clustered-dot halftones in a monochrome printing scenario. Since printer and scanner tone variations do
not impact orientation of these dots, the method is inherently ro-bust against typical printer and scanner tonal variations across devices and over time. Furthermore, fairly high data densities are enabled by the orientation modulation based data embed-ding. At the receiver, we exploit the complementary spectral (wavelength) characteristics of the cyan, magenta, and yellow colorants of a printing device, and the red, green, and blue chan-nels of scanners, respectively, and estimate the data carried by a colorant channel from its complementary scan channel. We mit-igate the interference among color channels, that arises from un-desired colorant absorptions and wide band scanner spectral re-sponsivities, by using the characteristics of color interference in both: a) the data encoding stage, where we choose the encoding orientations for the separations so as to minimize interference and b) the data extraction stage, where we utilize a statistical modeling of the channel, capturing the predominant effects of the color interference. In order to realize an error-free practical scheme, we employ error-correction coding to compensate for the errors due to color interference and other channel distortions. We demonstrate experimentally that the (error-free) operational rates of the proposed method are comparable to, or better than, the highest capacity barcodes in the literature.
Several other color barcode schemes have also been pre-sented in the literature [8], [9], [15]–[19]. Among these, color DataGlyphs operate by simply encoding the same data in all colorant channels [8], [9]. While this overcomes the color in-terference challenges, it fundamentally does not offer increased capacity over the monochrome setting. Another approach for color barcodes has been recently proposed [15]–[18]. In this approach, data is encoded as small triangles/rectangles in one of four (C,M,Y,K) or six (C,M,Y,R,G,B) colors where the color is chosen based upon the data. Encoding data in the color of small shapes, however, can be sensitive to printer/scanner tonal variations, which may degrade the performance across different devices and over time as the tonal response of a printing/scanning system varies. This is particularly true if the number of colors is increased in order to enable higher data rates because the number of distinct colors required for encoding scales exponentially with the number of bits encoded per triangular/rectangular region. Colorzip [19] represents yet another system for encoding information using color that offers better aesthetic appeal than conventional barcodes but rather low data rates.
In order to offer increased capacity, our proposed barcode system exploits the spectral “diversity” enabled by the use of cyan, magenta, and yellow colorant separations and red, green, and blue scanner channels, which are utilized in common color printing and scanning, respectively. Interestingly, alternate forms of spectral diversity have also been exploited for data encoding by utilizing specialized colorants that are invisible under normal lighting but can be detected with customized image capture devices [20], [21]. These offer the advantage that the barcodes are non obtrusive, similar to the situation with watermarks in image content [22, p. 4] albeit with the obvious disadvantages associated with specialized colorants and detectors.
The rest of this paper is organized as follows. In Section II, we outline the opportunities and challenges associated with
per-col-orant channel data encoding. We describe the proposed high ca-pacity barcode method in Section III. We present our experi-mental results in Section IV. Section V discusses many key as-pects of the proposed barcode scheme. Section VI concludes the paper by summarizing our main findings.
II. INDEPENDENTDATAENCODING PERCOLORANTCHANNEL: OPPORTUNITIES ANDCHALLENGES
Consider a color barcode system where the barcode is printed with CMY colorants and a RGB color scan is used for recov-ering the payload data. The red, green, and blue channels of a scanner have spectral sensitivities that are complementary, re-spectively, to the cyan, magenta, and yellow colorants used in the printing. The cyan, magenta, and yellow colorants, respec-tively, absorb primarily in the spectral regions over which the red, green, and blue scanner channels are responsive. This com-plementarity naturally suggests an opportunity for color bar-codes that offer increased capacity over their black and white counterparts by conveying independent payload data in the C, M, and Y colorant channels which are then recovered from the complementary R, G, and B channels of the scanned image, respectively.
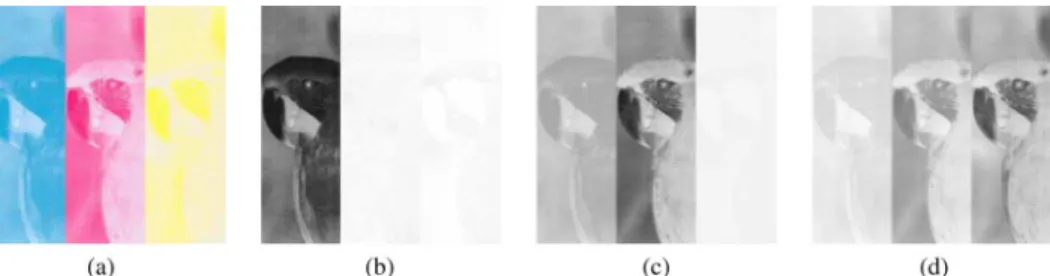
In practice, however, the complementarity is far from perfect and the spectral region over which each of the C, M, and Y col-orants absorb include wavelengths over which scanner channels other than the complementarily related ones are also responsive. This results in an undesirable (from our perspective) coupling between the colorants and the scanner channels, which we refer to as color interference. We illustrate this color interference in Fig. 1 using a specially generated image where a CMY image is partitioned into vertical stripes and within each stripe only one of the C, M, and Y separation is printed resulting in the print shown in Fig. 1(a). The R, G, B channels obtained from a scan of the print are shown,respectively, in Fig. 1(b)–(d). We see that the green channel, which ideally captures only the information in magenta colorant, in practice also sees interference from the cyan colorant. Similarly, the blue channel captures the informa-tion in the yellow colorant but also gets significant interference from the magenta colorant. In Fig. 1, we can also see compo-nents of color interference from additional colorant channels which, however, are much smaller in magnitude and can, there-fore, be safely ignored. Note that the color interference depends both upon colorant spectral characteristics and scanner spectral response. This behavior of the color-print-scan channel com-bined with other channel distortions1poses a significant
chal-lenge for methods that encode data independently per-colorant channel, suggesting the following desirable characteristics for a data encoding method:
• the technique for encoding data in individual color sep-arations must be robust to variations in graylevel (also tonal value) because interference from other colorant chan-nels and printer/scanner tone variations may significantly change the graylevel value in a color separation;
1These distortions include print-scan geometric distortions and print-scan channel noise [14]. Although both of these distortions are addressed in the literature individually, here we consider independent per-channel encoding as a mechanism for increasing capacity and the attendant challenge of color interference.
Fig. 1. Cross-channel interference from CMY colorants in RGB scanner channels. (a) CMY striped print. (b) Scan R channel. (c) Scan G channel. (d) Scan B channel.
• the global and local geometric distortions introduced by print-scan process (e.g., global rotation/scaling and local perturbations) must be compensated to synchronize with the encoded data in each colorant channel;
• the characteristics of the color interference among the channels should ideally be comprehended in the data encoding stage in order to mitigate the effect of color interference at the detector;
• the print-scan channel model used for estimating the en-coded data at the decoder, should ideally capture the char-acteristics of the color interference among the colorant channels to fully exploit the information extracted from scanner sensor channels;
• error correction coding is necessary to overcome inevitable errors due to channel distortions—including interference between color channels.
III. DATAENCODING PERCOLORANTCHANNEL VIA
ORIENTATIONMODULATION INELLIPTICALDOTARRAYS A. Overview
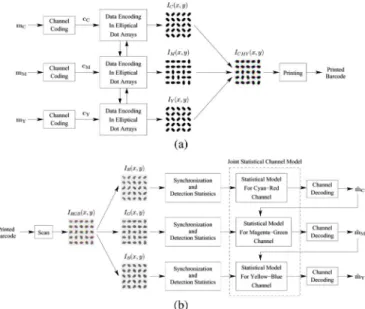
Motivated by the desired characteristics of a methodology for per-colorant channel data encoding listed in the preceding section, we propose a new high capacity color barcode. Fig. 2 illustrates an overview of the proposed scheme. Here , , and represent the message data to be conveyed through the cyan, magenta, and yellow print channels, respectively. In order to allow error recovery at the receiver, a channel coding stage is interjected before the per-colorant separation data encoding step, which adds redundancy to the messages , , and , producing corresponding payload data , , and , respectively. In each colorant channel, the corresponding payload data is conveyed. To enable global and local synchro-nization, we define a 2-D rectilinear (usually square) tiling of the barcode substrate where at the center of each cell resulting from the tiling, we place an elliptically shaped dot whose orientation is modulated to carry a payload data bit/symbol. An identical tiling is employed for the different color separations. While encoding data in each colorant channel, orientations for modulation are carefully selected so that the effect of color interference on the modulated data is minimized. The resulting binary images , , and are then printed in overlay to produce the color barcode. At the receiver, colorant channels of the printed barcode, carrying the data, are estimated from complementary channels of the scanned barcode. The print-scan process, however, introduces
global and local geometric distortions that change the positions of the dots printed in the individual color separations,—causing desynchronization if these effects are not compensated for. A global and local synchronization is, therefore, incorporated on a per channel basis, details of which are provided in Section III-B. After global and local synchronization, from individual red, green, and blue channels of the scanned barcode, detection statistics are obtained corresponding to each cell in the periodic tiling of the barcode substrate. The statistics are then used in a channel decoder along with a statistical color print-scan channel model to estimate the message data. In this process, the color print-scan channel is modeled jointly to capture the color interference. In order to characterize the behavior of the different components of our proposed barcode system, in particular, the interference aware data encoding and the channel statistical model we propose, we also consider the operational performance of an uncoded system. For the uncoded system, instead of the channel decoding in Fig. 2(b), the payload data is estimated on a cell-by-cell basis using the detection statistics for the cell alone, employing either a simple heuristic detection rule or optimal maximum likelihood (ML) detection based upon our proposed channel model. We describe the individual system elements in detail in the following sections.
B. Data Encoding in Individual Colorant Channels: Arrays of Oriented Elliptical Dots
In each colorant channel, we encode data by using a peri-odic 2-D rectilinear array of elliptically shaped dots and mod-ulating the orientation of elliptical dots in order to encode the data. Fig. 3 shows a zoomed version of a barcode in a mono-chrome printing scenario, where (the major axes of) the indi-vidual dots are oriented along vertical, horizontal, and diagonal ( 45 ) directions, i.e., each orientation may be thought of as representing a binary symbol. Individual cells, containing one modulated dot each, are tiled vertically and horizontally over the barcode substrate as shown in Fig. 3. A convenient way for generating a 2-D array of elliptical dots with arbitrary orienta-tions, that we utilize in our work, operates by comparing a 50% graylevel against an asymmetrically modulated threshold tion. For this purpose, we modify the analytical threshold func-tion that we propose in our recent work [14] for halftone data hiding. The modified threshold function for the th cell can be expressed as
Fig. 2. Proposed high capacity color barcode system. Data is encoded per col-orant channel via dot-orientation modulation in elliptical dot arrays in a color interference aware fashion. A joint statistical channel model that captures the impact of the color interference in a sequential framework enables more effec-tive decoding/recovery of barcode message data. (a) Data encoding. (b) Data extraction.
Fig. 3. Data encoding via dot-orientation modulation in a monochrome printing scenario.
where and represent the frequency of the rectilinear tiling along and directions so that the cells in the tiling correspond to rectangles with width ( dimension) and height ( di-mension) . The value of this threshold function ranges be-tween 0 and 1, which is assumed to represent the normalized range of image values from no colorant coverage through full colorant coverage, respectively. A 50% graylevel corresponds to a value of 0.5.2The nonnegative exponents and vary
from cell to cell based upon the data to be encoded within the cell and determine the ellipticity and orientation of a dot in the th cell. Specifically, if is greater than comparing a con-stant image value against the threshold function generates an elliptically shaped dot oriented along the vertical direction and similarly if is greater, the resulting dot is oriented along the horizontal direction. Although comparing against a con-stant image value can only generate elliptical dots oriented along vertical and horizontal directions, a simple coordinate rotation
2The actual value may be adjusted for printer dot gain.
can be performed on the threshold function to generate ellip-tical dots with arbitrary orientations [14]. In pracellip-tical applica-tions, however, the detection of the orientation becomes more challenging with increasing orientation directions, especially at high array frequencies (i.e., smaller cell sizes).3In the rest of the
paper, we, therefore, restrict our attention to binary modulation where the dots are oriented along two orthogonal directions.
Note that the threshold function here, unlike the one used for halftone data hiding in [14], does not maintain continuity at the cell boundaries when and are changed to modulate the dot orientation along different directions. While the conti-nuity must be ensured for halftone data hiding to prevent arti-facts in a halftone image, this is obviously not required in the barcode application and, therefore, not imposed on the function in (1). This choice of affords greater flexibility for data encoding, allowing, in fact, for a doubling of capacity over the threshold function for halftone data hiding used in [14]. The orientation modulation method is nicely suited for per-col-orant channel data encoding because it encodes information in the shape of individual dots and, hence, is less sensitive to vari-ations of the tone response of printing and scanning systems. In particular, tonal variations in the print-scan process are in-evitable over time due to device drift, change of components such as toner cartridges and aging of lamps etc, but invariably do not change the orientation of dots seen in the scanned images. With the current technology, the frequency permissible for the rectilinear tiled array can also be quite high allowing for high payload densities.
At the receiver, the 2-D tiling of the barcode substrate de-fines an inherent periodicity that enables global synchroniza-tion. Specifically, the use of the threshold function in (1) im-plies that the resulting printed dots have characteristic peaks at in the Fourier domain which upon scanning with a scaling factor of and a rotation appear in the scanned image at
This is illustrated in Fig. 4, where primary peaks in the Fourier spectrum clearly indicate the global rotation and scaling. The rotation and the scaling parameter can, there-fore, be determined from the location of the peaks, enabling a global synchronization. Since printing systems also introduce local and smoothly varying geometric distortion, the global synchronization alone is usually insufficient. Therefore, we also perform local synchronization that compensates for the locally varying printer geometric distortion. We perform this local synchronization jointly with the computation of detection statistics for each cell—a process we describe next. The local synchronization infers the spatial region that defines the cur-rent cell. Once this is known, for the image data4within the cell
we compute a center of mass (COM) and two moments and
3This is especially pronounced for per-colorant channel data encoding be-cause the color interference in this scenario introduces additional distortion, which further deteriorates detection performance with increasing orientation di-rections as we demonstrate in Section IV.
4We assume that the scanned images are represented using ablack = 1and
white = 0polarity so that the image values in a scanner channel are largest in the regions corresponding to the complementary colorant dot.
Fig. 4. Global synchronization for compensation of scaling and rotation.
along the two orthogonal directions, corresponding to the two modulated dot orientations. Specifically, if the image data is given by the COM over a cell is computed as
(2)
and for horizontally/vertically oriented dots we compute moments
(3)
The moments serve as simple detection statistics for esti-mating the orientation of the dot located within the cell:
for horizontally oriented dots and for vertically ori-ented dots. The moments computed can either be used to esti-mate the encoded data on a cell by cell basis or these can be collectively utilized in a channel decoder to enable error cor-rection. The latter is described in Section III-E. If cell by cell recovery of the encoded data is desired, a decision can be made in each cell based upon a heuristic criteria as
(4) where the orientation is identified as the direction along which the calculated moment is maximum.5For notational purposes,
in the remainder of this paper we use to denote the mo-ment computed along the -axis, for the moment along the -axis, and for the moments calculated along the di-agonal ( 45 and 45 ) directions, respectively.
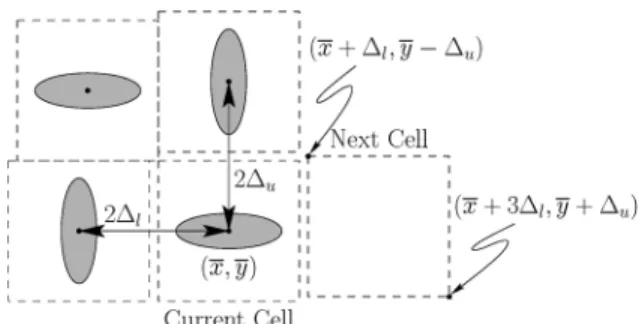
The displacement of the COM of the current cell with re-spect to the COM’s of previously processed adjacent cells is then utilized to estimate the boundaries for the next cell. Specif-ically, when processing in a left to right raster scan fashion the boundary of next cell to the right is estimated, as illustrated in Fig. 5, as the rectangular region
, where is the distance of with respect to (wrt) the x-coordinate for the COM of the cell immediately to the left and is the distance of wrt the y-coordinate of the COM of the cell immediately above. Note that the proposed iterative
5Note that for 4-ary data encoding, four moments (along vertical, horizontal, and diagonal directions) are calculated for each dot, from which the orientation is identified as the direction along which the maximum moment is calculated.
Fig. 5. Local synchronization process to compensate for printer geometric distortions.
method for estimating cell boundaries is well suited for local synchronization here because the printer geometric distortions are smoothly varying across the barcode substrate [14], [23], [24]. Hence, the effect of the distortion on neighboring cells is similar, which is exploited by our local synchronization method. Also note that changing the orientation of elliptical dots does not change the COM of the cell, which suggests that COM can be reliably utilized to identify the cell boundaries regardless of the data encoded within the cell. The order in which the cells are processed is not rigidly constrained. Once a starting COM is estimated for a cell located anywhere in the barcode, the pro-cessing can proceed in either direction from the COM. For in-stance, a first cell can be localized in the center of the barcode by thresholding to locate a printed region followed by detec-tion of the corresponding connected component [25, pp. 645] in the thresholded image as a “dot.” The COM of this thresholded “dot” can then serve as the starting point estimate for the corre-sponding cell COM.
C. Color Interference Aware Data Encoding
Though encoding data in the orientation of elliptical dots is less sensitive to tonal variations in printer response, color in-terference among color planes still constitutes a challenge for data extraction from individual color planes. To limit arbitrary color-interference induced by the interactions between modu-lated dots in different color planes, we generate binary color separations , , or with the same un-derlying tiling of modulated dots.
As shown in Fig. 1, the red and blue channels of a scanned image have almost no interference from yellow and cyan col-orants, respectively. Hence, if data is carried only in cyan and yellow colorant channels, which are the farthest apart in primary spectral absorption bands, they can be estimated with fair relia-bility from red and blue sensor channels as validated in our re-cent work [1]. For three-colorant channel data encoding, how-ever, the use of the magenta channel for data encoding in
ad-Fig. 6. Scanned image data for the blue sensor channel (for a cell) when (a) the same set of orientations is used for encoding data in both magenta and yellow channels, (b) the encoding orientations for the yellow channel are chosen as the 45 rotated versions of the encoding orientations for the magenta channel. In all cases, in addition to the primary signal from the complementary yellow colorant channel (shown in black), a contribution from the magenta colorant, shown in light gray, also appears in blue sensor channel. The impact of this contribution is asymmetric for the configurations in (a) but symmetric for the configurations in (b).
dition to cyan and yellow, causes color interference among the color planes. To consider the impact of color interference, re-call the discussion of Section III-B. The barcode decoder de-cides on the embedded data within each cell by computing, for each of the three colorant planes, two orthogonal moments in the scanner channel complementary to the colorant, where the moments are computed along the two directions chosen for en-coding data in the colorant plane.
When the same set of two orthogonal dot orientations is used for encoding the data in all colorant channels, the color inter-ference affects these two orthogonal moments unequally de-pending upon the data embedded in other (noncomplementary) colorant channels. This situation is illustrated in Fig. 6(a) for the blue sensor channel which represents primarily the information in the yellow colorant but also sees interference from the ma-genta colorant channel. To detect the orientation of the yellow dots in Fig. 6(a) image moments are computed along horizontal and vertical directions. The two leftmost configurations shown in Fig. 6(a) both depict a vertically oriented yellow dot (corre-sponding to identical encoded bit values for the yellow channel) whereas the magenta dot is vertically oriented in the first of these and horizontally in the second, corresponding to different embedded bit values for the magenta channel. The color inter-ference from the magenta channel has an asymmetric impact, causing a relatively large increase in the otherwise small hor-izontal moment for the blue channel for the first of these two configurations and only a relatively small change in the other-wise large vertical moment in the second case. An analogous description applies to the two right most orientations shown in Fig. 6(a), which depict the situation corresponding to a hori-zontal yellow dot. Thus, in the situation shown in Fig. 6(a), the color interference from the magenta channel has the overall im-pact of reducing the difference between the moments for the horizontal/vertical orientations. This corresponds to a reduction in the received signal strength and degrades error performance.
In order to mitigate this effect of color interference, we pro-pose using a configuration that adopts orthogonal encoding di-rections for the magenta channel that are rotated 45 with re-spect to the orthogonal directions employed for the cyan and yellow channels. For data encoding, the cyan and yellow chan-nels employ dot orientations and the magenta channel uses 0/90 orientations. This rotated configuration eliminates
Fig. 7. Signal constellations and corresponding dot orientations for cyan, ma-genta, and yellow colorant channels.
the asymmetry in the impact of (primary) color interferences on the moments for the two embedding orientations. The pre-dominant effect of color interference in the scenario of Fig. 6(b) is to increase, by similar amounts, the two orthogonal moments computed in a given channel along the two directions that are utilized for data encoding. The benefit of the proposed configu-ration is illustrated in Fig. 6(b) where we illustrate the dot ori-entations observed in the blue sensor channel for our proposed signal constellations for the magenta and yellow colorants. The magenta dots oriented along 0/90 have a (largely) symmetric impact on moments computed along the directions along which moments are computed for the detection of the data in the yellow channel (which is the channel complementary to the blue scanner channel under consideration here).
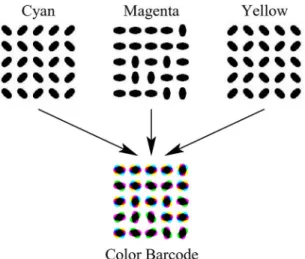
In terms of the moments used for the detection, the proposed encoding configurations can be represented in terms of a signal constellation diagram [26, pp. 34] as shown in Fig. 7. For per-colorant channel data encoding, the proposed encoding scheme reduces the impact of color interference, offering better detection performance at the receiver. This gain arises from a judicious choice of encoding orientations based upon the predominant color interference signals and maintains the data rate—within each cell, a bit of data is encoded in the orientation of the dot printed for each of the cyan, magenta, and yellow colorants supporting a payload of 3-bits per cell. The joint design of signal constellations for independent data encoding in C, M, and Y channels by taking into account cross-channel interference offers performance improvements in a manner analogous to informed coding [22, pp. 138] for watermarking applications. Fig. 8 illustrates the proposed data encoding method and the resulting color barcode.
Note that if the same data is encoded in all colorant channels, using the same constellation for all channels would be advan-tageous because color interference in this case strengthens the detection of a symbol. This is the case for the color instantiation of DataGlyphs [8], [9]. But in this scenario, the encoding rate (i.e., payload density) is compromised to one third the value of our proposed scheme.
D. Channel Modeling and Joint ML Detection
The proposed data encoding method mitigates but does not completely eliminate color interference. Additionally, other dis-tortions such as directional asymmetry in the printing, scan blur, and print-scan tonal variations also impact the detection process at the barcode reader. We, therefore, propose a joint statistical model for our effective “communication channel” that, within each tiling cell, receives as input the vector of orientations of the C, M, and Y colorant elliptical dots within the
Fig. 8. Color interference aware dot orientation based data encoding in cyan, magenta, and yellow colorant channels.
cell and outputs the vector of the moments computed for the tile in the R, G, and B channels, respectively. The communications channel is then statistically characterized by the channel likelihood function which is the condi-tional probability density function (pdf) of the moment vector when the input consists of dots with the given orientation vector
. Estimation of this multidimensional conditional density func-tion is experimentally challenging and we, therefore, develop a simplification as follows. First, note that if the CMY colorant channels were independent and influenced only their, respective, complementary RGB scanner channels, the channel likelihood function would factorize as
(5) Now observe that in Fig. 1, the image captured as the red scanner channel represents the cyan colorant printing rather well and suffers almost no interference from other colorant channels. The image captured as the scanner green channel on the other hand represents not only the complement of the magenta col-orant printing but also encounters significant interference from the cyan channel. Finally the scanner blue channel captures the yellow colorant printing and sees interference from the magenta colorant. Based upon the observation of the color interference in Fig. 1, we propose a simplified joint pdf of our effective com-munications channel that accounts for the predominant effects of color interference while neglecting secondary, less significant effects. Using Bayes’ rule and the simplifications we obtain
(6) where the three conditional pdf factors on the right hand side of the previous equation represent the probabilistic channel model for the complementary cyan-red, magenta-green, and yellow-blue channel pairs, respectively. Note that while the channel model for cyan-red pair accounts only for the monochrome print-scan distortions (i.e., printer directional dis-tortion, scan blur etc.), the channel models for magenta-green and yellow-blue pairs also take into account the predominant
moments from red and green channels. After marginalization, the conditional pdf’s for magenta-green and yellow-blue chan-nels can be expressed as
(7)
(8) We next consider characterization of these channel distributions for each of the channel pairs. Modeling a multidimensional dis-tribution is difficult, especially in the absence of a physically inspired model. To make the problem tractable, we assume con-ditional independence6given by
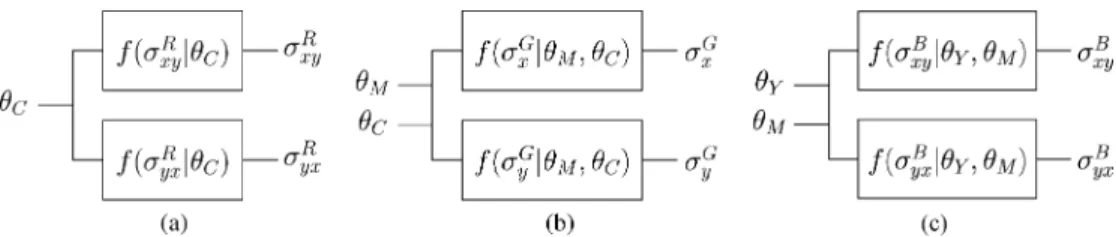
(9) (10) (11) where the joint channel distributions are factorized as the mul-tiplication of conditional pdf’s of moments calculated along two orthogonal directions. The simplified channel models for each colorant are illustrated in Fig. 9. Using the channel statis-tical model, an estimate of the orientations of the dots selected for data encoding can be obtained by jointly maximizing the channel likelihood function over the transmitted orientations as
(12) Although the proposed detection criteria is optimal in the maximum likelihood sense [22, pp. 78], the joint maximiza-tion can increase the detecmaximiza-tion complexity. In order to reduce the complexity at the barcode reader, we approximate the joint
6Following the methodology used for the monochrome case in [14], we have established that empirical 222 covariance matrices of the received moments conditioned on the two received orientations are close to diagonal for all colorant channels, thereby validating our assumption. Specifically, over a collection of estimated 222 covariance matricesfK g of the received random image moments ; conditioned on2 ; 2 for each colorant channel, we com-puted the measure10 log ( kdiag(K )k = kK k )wherekAk de-notes the Frobenius norm of the matrixAanddiag(K )represents a diagonal matrix whose diagonal entries are identical to those inK. The previous measure of the relative power of diagonal entries was evaluated for C, M, and Y colorant channels, yielding numerical values of00.04 dB,00.07 dB, and00.12 dB, respectively. This indicates that the covariance matrices are close to diagonal for all colorant channels (the measure is 0 dB for the ideal diagonal case) and justifies our assumption.
Fig. 9. Simplified channel model for complementary print-scan channel pairs. (a) Cyan-red. (b) magenta-green. (c) Yellow-blue.
maximization in (12) by a simpler sequential decision process on the received orientations in red, green, and blue channels as
(13) (14) (15) Though sequential detection decreases the detection com-plexity, it can also degrade the detection performance at the receiver. In most cases, however, sequential detection closely approximates the joint ML detection and does not cause any noticeable performance loss as we demonstrate in Section IV. The ML detection using the statistical modeling of the channel better captures the channel characteristics and outperforms the heuristic detection of (4). This is validated experimentally in Section IV, in particular, see Fig. 12 for cyan-red channel pair. Note that in practical applications, the detected orienta-tions typically contain errors due to inherent distororienta-tions in the print-scan channel. To recover from these errors and accom-plish an error-free scheme, instead of detecting orientations in each cell, the extracted moments are collectively utilized in the channel decoder. Likelihood probabilities are computed from the moments and the statistical channel model, which are then utilized in the decoding process, which is described in the following section.
E. Error Correction Coding
At the barcode reader, the objective is to reliably estimate the message data from a scan of the printed barcode. If no error cor-rection coding is utilized and decisions on message data values are made on a per cell basis, the distortions due to the print-scan process and color interference among the color planes in-evitably cause errors at the receiver. Fig. 10 illustrates these dis-tortions and interference, where we show the scanned image cor-responding to a printed barcode. The modulated dots in cyan, magenta, and yellow colorants are quite distorted in the print-scan process, which can cause errors in the estimated data. In order to realize an error-free practical system, we, therefore, uti-lize error correction codes.
We specifically investigate the use of convolutional codes and low density parity check codes (LDPC) [28]–[30] for error cor-rection. Our choice of LDPC codes is motivated by their ex-cellent performance over various memoryless channels. Since these codes typically offer error-free operation for rates above a narrow threshold rate region, they allow us to identify error-free
Fig. 10. Scanned color barcodes and individual color channels (red, green, blue) of the scanned barcodes. Note that while all three channels experience print-scan channel distortions, the shapes of the dots in green and blue channels are especially distorted due to color interference in these channels from non-complementary colorants.
operational rates for the proposed barcode scheme. Convolu-tional codes, on the other hand, allow us to illustrate the ad-vantages of the statistical channel model by contrasting soft and hard decoding performance of good codes for a variety of rates [31].
1) Hard Decoding: Hard decoding refers to the scenario where individual bit values, detected for each cell, using either the heuristic detection of (4) or the ML detection of (12), are utilized within an error correction decoder to recover from er-rors. Error correction decoding is then performed based upon extracted bits in each color channel.
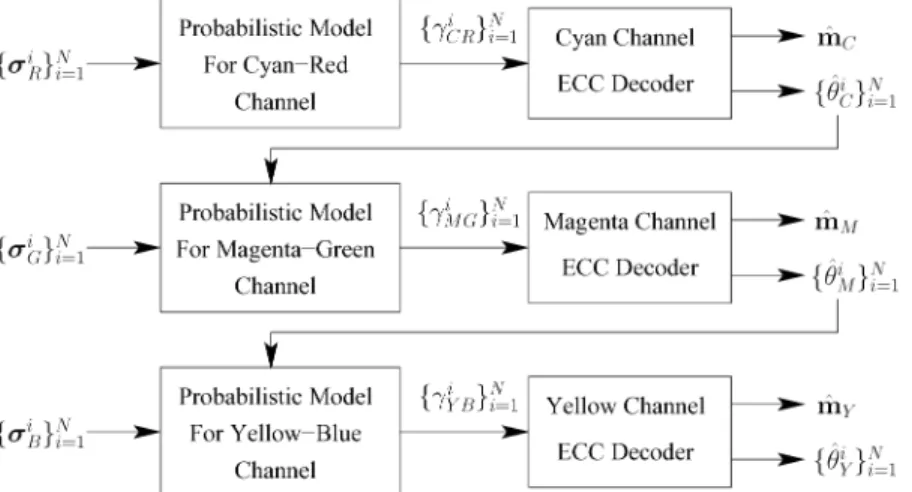
2) Soft Decoding: In communications it is well known that instead of detecting individual bits and then utilizing an error correction decoder, much better performance can be obtained by passing the detection statistics (moments in our case) to a soft decoder that decodes the message bits collectively based upon the detection statistics [26, pp. 515]. Based upon our se-quential factorization of the channel likelihood function in (6), we, therefore, propose a sequential soft decoding process where we decode the message data in cyan, magenta, and yellow col-orant channels sequentially, in that order, as depicted in Fig. 11. Here we denote the number of cells in the barcode array for each of the separations by . The sequential decoding process, estimates the message data embedded in each of the colorant channels, using as inputs log likelihood ratios (LLRs), which are obtained from the computed moments in each of the cells of the barcode array and the decoded data for the preceding col-orant channel. Specifically, the LLRs for the th cell in the cyan,
Fig. 11. Soft decoding using the extracted moments with the statistical channel model. The message data in cyan, magenta, and yellow channels are decoded sequentially, in that order.
magenta, and yellow colorant channels are computed, respec-tively, as
(16)
where and represent the estimated orientations for the th cell in cyan and magenta channels after ECC decoding. Specifi-cally, the LLR computations for the magenta and yellow channel decoders make use of the decoded orientations for the cyan and magenta channels, respectively. The calculated LLRs corre-sponding to each colorant’s barcode array are collectively uti-lized in the error correction code (ECC) decoder for that col-orant channel.
IV. EXPERIMENTALRESULTS
In this section, we test the effectiveness of the proposed barcode scheme across several printer and scanner pairs. Our chosen printers have resolutions of 600 dots per inch (dpi) or higher, which is typical in current color printers. For our barcodes we utilize 2 2 inch square arrays with 75 and 100 cells per inch (cpi) along both directions. This yields cell sizes (in printer pixel units) that provide reasonable flexibility to orient a dot along different directions within a cell. The modu-lation parameters for the dot ellipticity and orientation within
each cell are set as and .
This represents an experimentally determined tradeoff between data detectability and the synchronization (as described in Section V). For our experiments, we use randomly generated message data to create a barcode using our proposed method, which is then printed on a white paper substrate. Plain (un-coated) paper is utilized for the majority of our experiments; limited validation was also performed on glossy coated paper. For reading the barcode, the printed barcode is scanned on an HP Scanjet 8270 flatbed scanner having optical resolution
up to 4800 dpi.7In the first part of our experiments, we
eval-uate the performance of the individual system elements of the proposed barcode scheme, highlighting, in particular, the color interference aware informed encoding technique pro-posed in Section III-C and the channel modeling described in Section III-D. Observing similar results across different printers and array frequencies, here we specifically report our results for 75 cpi barcodes printed on a color printer with a resolution of 600 dpi. We then evaluate the overall performance of the proposed barcode scheme for both 75 and 100 cpi barcodes across three different printers.
We first highlight the benefit of the proposed color in-terference aware informed encoding technique described in Section III-C. Table I lists the bit error rate (BER) performance of blind and the informed encoding techniques based upon the heuristic detection criteria in (4) for scan resolutions from 900 to 1500 dpi (all other scanner settings were at their default values for all our experiments). Here, blind encoding refers to the situation where the same signal constellation, i.e., the same set of two orthogonal orientations, is used for encoding payload data in all the colorant channels. Specifically, in the blind encoding, we utilize 0/90 orientations for all colorant channels. At the barcode reader, for the blind encoding scheme, to mitigate the impact of color interference, we employ Otsu’s thresholding algorithm [32] in the individual color channels of the scanned barcode. For the informed encoding, on the other hand, the signal constellation for the magenta channel is rotated 45 with respect to the signal constellations for cyan and yellow channels. The results presented in Table I indicate that the proposed informed encoding technique significantly improves the BER performance at the receiver. Also note that increasing the scan resolution from 900 to 1200 dpi decreases BER significantly whereas, increasing the resolution further to 1500 dpi offers minimal benefit. Based upon this observation we set the scan resolution at 1200 dpi for the remainder of our experiments. We also evaluated the performance of the informed encoding on a glossy coated paper substrate. For a 1200 dpi resolution scanner capture of this printed barcode
7Limited validation was also conducted on an alternate flatbed scanner having 1200 dpi optical resolution.
TABLE I
BER PERFORMANCE FORBLIND ANDCOLORINTERFERENCEAWAREINFORMED ENCODING FOR75 cpi BARCODES ATTHREEDIFFERENTSCANRESOLUTIONS
TABLE II
SYMBOLERRORRATES FORBINARY(INFORMED)AND4-ARYORIENTATION MODULATIONWHENUTILIZED FORPER-COLORANTDATAENCODING IN
ELLIPTICALCMY DOTARRAYS FOR75 cpi BARCODES
the resulting BER is 0.0094, which is comparable to the BER reported in Table I for plain paper. Thus, the proposed encoding technique shows similar performance on the glossy and plain paper substrates tested.
We also explored the use of more than two orientations for data encoding where higher data rates are allowable due to the larger number of possible orientations, although color interfer-ence aware data encoding is not feasible as proposed. In Table II, we list symbol error rate (SER) performance of the proposed barcode scheme with 4-ary modulation in all colorant channels and compare its performance against binary modulation with color interference aware informed encoding. As is evident from the results in Table II, 4-ary modulation leads to a significantly higher SER, suggesting that it is advantageous, in practical ap-plications, to limit the orientation modulation to only two direc-tions (i.e., binary modulation) where the proposed color inter-ference aware data encoding can be effectively deployed.
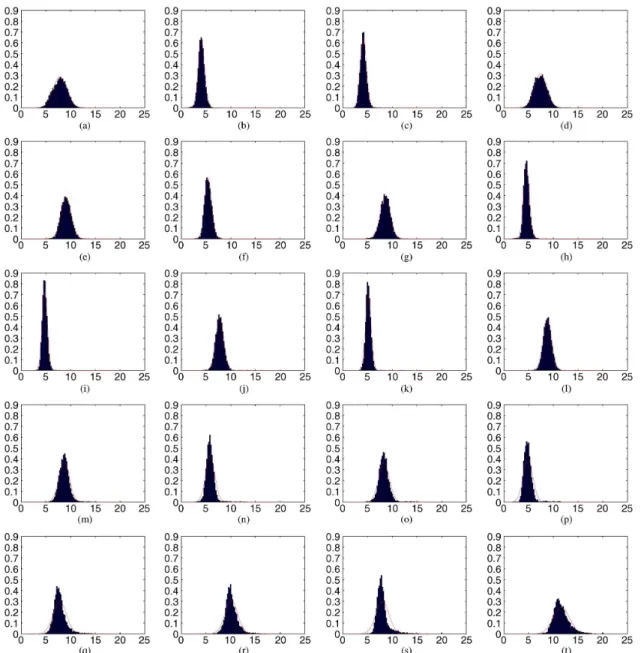
Next, we consider the performance of ML detection that uses the joint modeling of the color channels developed in Section III-D. For this purpose, we first characterize the marginal conditional distributions based upon the observed histograms. Fig. 13(a)–(d) shows normalized histograms of the received moments conditioned on the orientation in cyan channel. And, Fig. 13(e)–(l) shows normalized histograms of extracted moments from green channel, conditioned on the orientations in magenta and cyan channels. Similarly, Fig. 13(m)–(t) shows histograms of extracted moments from blue channel, conditioned on the orientations in yellow and magenta channels. Based upon the observation of histograms of received moments in Fig. 13, we model channel conditional pdf’s via Gaussian distributions and estimate the parameters of distributions via the maximum likelihood estimator. Note that for the yellow-blue channel, the accuracy of the estimated histograms is adversely affected by the fact that the modulated dots in yellow colorant channel interferes with yellow security dots, which are used by several printer companies to encode the serial number of the printer to track counterfeiters [33]. In Table III, we compare the BER performance of heuristic detection in (4) and joint ML detection in (12). As shown in the table, the joint ML detection outperforms heuristic detection and significantly improves the performance in terms of BER, which shows the merit of the proposed statistical
TABLE III
BER PERFORMANCE FORHEURISTICDETECTION ANDJOINT/SEQUENTIAL ML DETECTION FOR75 cpi BARCODES
Fig. 12. ML and heuristic detection boundaries for the cyan-red channel pair. The dashed blue line shows the heuristic detection boundary. ML detection boundary corresponds to the curve where contours of the two conditional distri-butions intersect with each other. The difference between detection boundaries mostly arises from asymmetry in the printing process, which the ML detection comprehends.
channel model. The reason for this is because, as we outline in Section III-D, the statistical channel model captures the characteristics of the channel distortions (i.e., scan blur, printer directional distortion, tonal variations, color interference etc.), whereas, heuristic criteria makes a decision based solely upon the ratio of the extracted moments, ignoring the channel charac-teristics. This is also illustrated in Fig. 12 by showing a contour plot of conditional channel distributions
and for the cyan-red channel pair. Based upon the channel distributions, the ML detector divides the 2-D space of received moments into two regions (i.e., detec-tion regions) with a boundary defined by the curve where the contours of the two conditional channel distributions inter-sect with each other (the curve specified parametrically by
the relation ). The
dashed blue line in the figure indicates the heuristic detection boundary . Note that the heuristic and ML detec-tion boundaries do not coincide since the heuristic detecdetec-tion does not capture the channel characteristics. The gap between the detection boundaries causes the performance gap between the heuristic and ML detectors. Note that we also report the sequential ML detection performance in the last column of Table III. As shown in the table, sequential ML detection does not cause any loss in the detection performance despite its reduced complexity.
Fig. 13. Empirical estimates for the channel conditional pdf’s obtained as histograms of corresponding experimentally observed data using 75 cpi color barcodes printed on a 600 dpi printer and scanned with a 1200 dpi scanner. For each histogram, the corresponding Gaussian approximation, obtained from the mean and variance, is shown as a curve plotted with a solid red line on each of the graphs. (a)^p( j = 0). (b)^p( j = 1). (c)^p( j = 0). (d)^p( j = 1). (e) ^p( j = 0; = 0). (f)^p( j = 1; = 0). (g)^p( j = 0; = 1). (h)^p( j = 1; = 1). (i)^p( j = 0; = 0). (j)^p( j = 1; = 0). (k)^p( j = 0; = 1). (l)^p( j = 1; = 1). (m)^p( j = 0; = 0). (n)^p( j = 1; = 0). (o)^p( j = 0; = 1). (p)^p( j = 1; = 1). (q)^p( j = 0; = 0). (r)^p( j = 1; = 0). (s)^p( j = 0; = 1). (t)^p( j = 1; = 1).
We also evaluate the performance of our statistical channel model by contrasting hard and soft decoding performance for convolutional codes. We generate the payload data for several rates , 2/5, 3/5, 2/3, 3/4, 4/5, which are among the best codes known with low constraint length [31]. In order to reduce the tedium of repeated printing and scanning, we print and scan a number of pages with random data encoded in the C, M, and Y separations. We then simulate our receiver, i.e., the chain from encoding, printing, scanning, and computation of moments, by generating a look-up table. For each of the eight choices of input vector of orientations , the look-up table stores the list of all the observed output moments in the scans of the generated prints.8Each use of the channel is then simulated by
8A total of 67,500 cells were included in the look up table.
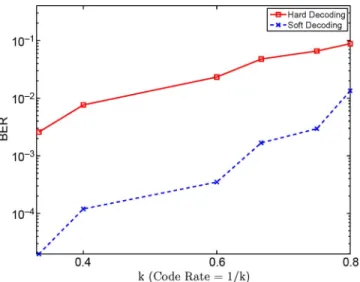
selecting at random from among the list of look up table outputs corresponding to the orientation vector that defines the channel input. This realistic “simulation” offers a close approximation to actual experiments. In the hard decoding of convolutional codes, a detection is made based upon the extracted moments, which is then used in error correction decoding. In the soft decoding, on the other hand, the statistical channel model is also utilized in the decoding process as described in Section III-E.2. In both cases, the ML Viterbi decoding algorithm for convolutional codes [26, pp. 510] is used over coded blocks of , which ensures that number of message bits per coded blocks remains an integer for each of the different rates investigated. Fig. 14 presents results of the experiment in the form of plot of the BER as a function of the code rate for both soft and hard decoding.
Fig. 14. Bit error rates (BERs) for message data after error correction decoding using convolutional codes of various rates. The performance of hard decoding (solid line) is compared against soft decoding (broken line) in order to highlight the advantage of the proposed channel model.
TABLE IV
ERROR-FREEOPERATIONALRATES OF THEPROPOSEDBARCODE TECHNOLOGYACROSSTHREECOLORPRINTERS
As is evident from Fig. 14, soft decoding enabled by the joint modeling of color channels offers a significant reduction in the BER, demonstrating the benefit of the statistical channel model. Finally, we evaluate our complete proposed barcode system by using color interference aware informed encoding and the proposed channel model. For this purpose, we generate the pro-posed barcodes with array frequencies of 75 and 100 cpi for all CMY colorants. For the error correction, we utilize irreg-ular LDPC codes with a block length of 64,800.9The message
data is coded with various code rates using an encoder for the LDPC code to generate the payload data. The digital barcodes are printed on three color printers, and the printed barcodes are then scanned on a flatbed scanner. From the scanned bar-codes, we identify the code rates at which error-free detection is achieved for each printer. In Table IV, we report the error-free operational rates of the proposed barcodes and the corre-sponding code rates. While for 75 cpi barcodes an error-free rate higher than 1750 is achievable, increasing the array frequency to 100 cpi can achieve rates higher than 2800 for all the printers tested. In Table V, we list the error-free operational rates for the existing high capacity bar-codes [7], [17]. As is evident from the tables, in terms of achiev-able error-free rates, the proposed color barcode scheme is in
9Detected rather than decoded values were used in the sequential decoding process of Fig. 11 to allow encoding of the combined data stream for the chan-nels. The block length is chosen to match the DVB-S2 LDPC constructions that offer multiple rates for a common block length [34].
TABLE V
ERROR-FREEOPERATIONALRATES FOREXISTINGHIGHCAPACITYBARCODES. DATA FOR THEMICROSOFT ANDHP COLORBARCODES ISOBTAINED
FROM[15]AND[17]; OTHERDATA ISBASED UPON[7]
the same range or better than other high capacity barcode nologies. It should be noted, however, that several of the tech-nologies compared use lower scan resolutions to enable more versatile decoding devices and may also be subject to improve-ments with higher scanner resolutions.
V. DISCUSSION
Other high capacity barcode technologies in the literature in-clude methods that encode data in the graylevel [7] or color of individual cells [15], [17]. The advantage of our method over these methods is that the proposed method encodes the data in the shape of elliptical dots and is largely robust to variations in printer/scanner tonal responses, which can vary over time or across different devices. These printer/scanner tonal varia-tions can change the intended color or graylevel of individual cells substantially and degrade the detection performance of the techniques modulating the color or graylevel for the purpose of data encoding. The advantage of the proposed method, however, does come at the cost of a fairly high spatial resolution require-ment for accurate detection of the dot shapes. Our experirequire-ments utilized a 1200 dpi resolution, which is to be contrasted with several of the alternative techniques that embed information in (average) graylevel and, therefore, can use lower resolutions of 600 dpi or 300 dpi. The higher spatial resolution requirement, imposed naively, would also require larger file sizes, but this can be mitigated in the proposed barcode by binarizing scanned barcode images to 1-bit per pixel per scanner channel prior to computation of the moments. Preliminary experiments on 75 cpi barcodes generated with the proposed informed encoding show that binarizing individual color channels of the scanned barcode has a small effect on the BER (in our tests the change in BER observed was ).
The encoding rate of the proposed barcode scheme has an ob-vious dependence upon array frequency for the individual col-orant channels. While increasing array frequency creates more room for data encoding, the two orthogonal orientations become less distinguishable in the presence of distortions as the cell size gets smaller (i.e., array frequency gets higher), which in turn impacts the detection performance at the reader. In prac-tical applications, the permissible array frequency will depend upon both printer and scanner resolutions, which continue to increase with technological improvements. Our printer resolu-tions are easily matched or exceeded by current devices. The scanner resolution of 1200 dpi used is also readily available in desktop scanners, though specialized barcode devices may offer a lower resolution.
nificant concern in many barcode applications where the pri-mary objective is to convey the message payload and aesthetics is only a secondary concern. The aesthetics of the proposed scheme cannot unfortunately be improved by the simple mod-ification of displacing different colorant dots in order to make them nonoverlapping because this sacrifices the advantages of color interference aware encoding and the proposed sequential decoding.
The barcode images obtained with the proposed method are bilevel in each of the C, M, and Y separations and, therefore, suitable for directly printing on most printers which are also bilevel devices. Printer drivers used for access to printers may, however, introduce additional unwanted preprocessing such as conversion to a continuous tone representation from which a bilevel version is obtained for printing by halftoning. This undesirable preprocessing can cause significant alterations in shapes of the printed dots degrading performance. Other alternative high rate barcode technologies often encounter the same limitation. This limitation is, however, an artifact of the tools used for accessing the devices rather than of the proposed method and can be overcome by utilizing suitable access to these printers. Our experiments utilized primarily electrophotographic (or laser) printers where the impact of such preprocessing is reduced because these devices use clus-tered-dot-halftones [35], which largely preserve our dot shapes despite the undesired preprocessing.
Encoding data in the orientation of elliptical dots is also utilized in DataGlyphs. Our method, however, has two major distinctions from DataGlyphs. The first distinction is that in the color instantiation of DataGlyphs [8] the same data is encoded in all colorant channels, which fundamentally offers the same capacity as encoding in single channel, whereas, the proposed method encodes the payload data independently in all C, M, and Y colorant channels, tripling the encoding rate of monochrome realizations. The other distinction is in the synchronization methodologies. While DataGlyphs satisfy only the global synchronization, the proposed method compensates for both global and local geometric distortions, which pro-vides better detection performance at the receiver. Our local synchronization algorithm requires that the center of mass of individual dots must be estimated reliably in each cell to estimate the neighboring cell positions. While this is feasible for elliptically shaped dots as demonstrated by our results, the local synchronization is much more challenging when pure lines are used to encode data in colorant channels. Our choice of elliptical dot arrays for data encoding, therefore, represents a tradeoff between data detectability and synchronization.
The proposed method inherently carries an additional secu-rity feature by enabling extraction of the geometric distortion signature from a printed barcode, which can be then utilized to uniquely identify/verify the type of the source printer [36]. This additional feature can be particularly useful in commercial and
In this paper, we propose a high capacity color barcode by ad-dressing the challenges for encoding independent data in indi-vidual print-colorant channels. Data encoded in cyan, magenta, and yellow print-colorants are estimated from the complemen-tary red, green, and blue sensor channels of a scanner, respec-tively. Encoding data by modulating the orientation of ellipti-cally shaped dots in 2-D rectilinear arrays, is effective and pro-vides robustness against variations in printer and scanner tonal responses. A color interference aware data encoding strategy in individual print colorant channels and a statistical channel model that captures the interaction between the print-colorant and scanner sensor channels, mitigate the effect of color interfer-ence on detection performance. An error correction coding uti-lizing the channel model enables error-free detection of the en-coded data. Our experiments conducted on several printers show that the proposed method offers high capacity and presents a vi-able solution for enabling high capacity barcode applications.
ACKNOWLEDGMENT
The authors would like to thank Dr. Vishal Monga who they collaborated with in the earlier work on this problem that was reported in [1] and Dr. Robert Loce for help with printing.
REFERENCES
[1] O. Bulan, V. Monga, and G. Sharma, “High capacity color barcodes using dot orientation and color separability,” inProc. SPIE: Media Forens. Security XI, E. J. D. , III, J. Dittmann, N. D. Memon, and P. W. Wong, Eds., Jan. 2009, vol. 7254, pp. 725 417-1–725 417-7. [2] D. Schonberg and D. Kirovski, “EyeCerts,”IEEE Trans. Inf. Forensics
Security, vol. 1, no. 2, pp. 144–153, Jun. 2006.
[3] B. Zhu, J. Wu, and M. S. Kankanhalli, “Print signatures for docu-ment authentication,” inProc. 10th ACM Conf. Comput. Commun. Sec., 2003, pp. 145–154.
[4] S. Voloshynovskiy, O. Koval, F. Deguillaume, and T. Pun, “Visual communications with side information via distributed printing chan-nels: Extended multimedia and security perspectives,” inProc. SPIE: Security, Steganography, and Watermarking of Multimedia Contents VI, E. J. Delp and P. W. Wong, Eds., Jan. 2004, vol. 5306, pp. 428–445. [5] Data Matrix Barcode FAQ & Tutorial accessed Jan. 2008 [Online].
Available: http://idautomation.com/datamatrixfaq.html
[6] N. Damera-Venkata, J. Yen, V. Monga, and B. Evans, “Hardcopy image barcodes via block-error diffusion,”IEEE Trans. Image Process., vol. 14, no. 12, pp. 1977–1989, Dec. 2005.
[7] R. Villán, S. Voloshynovskiy, O. Koval, and T. Pun, “Multilevel 2D bar codes: Towards high capacity storage modules for multimedia security and management,”IEEE Trans. Inf. Forensics Securityvol. 1, no. 4, pp. 405–420, Dec. 2006.
[8] D. L. Hecht, “Printed embedded data graphical user interfaces,”IEEE Computer, vol. 34, no. 3, pp. 47–55, Mar. 2001.
[9] D. L. Hecht, “Embedded data glyph technology for hardcopy digital documents,” inProc. SPIE: Color Hard Copy Graph. Arts III, J. Bares, Ed., Mar. 2001, vol. 2171, pp. 341–352.
[10] D. Shaked, Z. Baharav, A. Levy, J. Yen, and C. Saw, “Graphical indicia,” inProc. IEEE Int. Conf. Image Process., Oct. 2003, pp. I-485–I-488.
[11] D. Shaked, A. Levy, Z. Baharav, and J. Yen, “A visually significant two dimensional barcode Hewlett-Packard Lab., Haifa, Israel, Tech. Rep. HPL-2000-164, Dec. 14, 2001.
[12] O. Bulan, G. Sharma, and V. Monga, “Adaptive decoding for halftone orientation-based data hiding,” in Proc. IEEE Int. Conf. Image Process., Oct. 2008, pp. 1280–1283.
[13] O. Bulan, V. Monga, G. Sharma, and B. Oztan, “Data embedding in hardcopy images via halftone-dot orientation modulation,” inProc. SPIE: Security, Forensics, Steganography, and Watermarking of Mul-timedia Contents X, E. J. Delp, P. W. Wong, J. Dittmann, and N. D. Memon, Eds., Jan. 2008, vol. 6819, pp. 68 190C-1–68 190C-12. [14] O. Bulan, G. Sharma, and V. Monga, “Orientation modulation for data
hiding in clustered-dot halftone prints,”IEEE Trans. Image Process., vol. 19, no. 8, pp. 2070–2084, Aug. 2010.
[15] High Capacity Color Barcodes accessed Jan. 2010 [Online]. Available: http://research.microsoft.com/en-us/projects/hccb/
[16] D. Parikh and G. Jancke, “Localization and segmentation of A 2D high capacity color barcode,” inProc. IEEE Workshop Appl. Comput. Vis., 2008, pp. 1–6.
[17] S. J. Simske, J. S. Aronoff, and M. Sturgill, “Revenge of the phys-ical—Mobile color barcode solutions to security challenges,” inProc. Opt. Document Security, San Francisco, CA, Jan. 20–22, 2010, pp. 184–197.
[18] J. Mayer, J. Bermudez, A. Legg, B. Uchoa-Filho, D. Mukherjee, A. Said, R. Samadani, and S. Simske, “Design of high capacity 3D print codes aiming for robustness to the PS channel and external distortions,” inProc. IEEE Int. Conf. Image Proc., Nov. 2009, pp. 105–108. [19] Colorzip accessed Feb. 2010 [Online]. Available:
http://www.col-orzip.co.jp/en/
[20] K. Kamijo, N. Kamijo, and M. Sakamoto, “Electronic clipping system with invisible barcodes,” inProc. 14th Annu. ACM Int. Conf. Multi-media, 2006, pp. 753–762.
[21] Xerox Invisible Control Marks, Press Release Oct. 28, 2002, accessed Mar. 2010 [Online]. Available: http://www.advantage-x.com/news/in-visibleinkmark.html
[22] I. Cox, M. Miller, J. Bloom, J. Fridrich, and T. Kalker, Digital Water-marking and Steganography, 2nd ed. San Mateo, CA: Morgan Kauf-mann, 2007.
[23] R. Rauch and M. Rahnavard, “Raster output scanning system having scan line non-linearity compensation means,” U.S. Patent No. 6178031, Jan. 23, 2001.
[24] J. Appel, “ROS bow compensation,” U.S. Patent No. 6232991, May 15, 2001.
[25] R. C. Gonzalez and R. E. Woods, Digital Image Processing, 3rd ed. Upper Saddle River, NJ: Prentice-Hall, 2008.
[26] J. Proakis and M. Salehi, Digital Communications, 5th ed. New York: McGraw-Hill, 2008.
[27] S. M. Kay, Fundamentals of Statistical Signal Processing: Detection Theory. Upper Saddle River, NJ: Prentice-Hall, 1993.
[28] R. G. Gallager, “Low density parity check codes,” IRE Trans. Inf. Theory, vol. IT-9, no. 1, pp. 21–28, Jan. 1962.
[29] T. Richardson and R. Urbanke, Modern Coding Theory. Cambridge, U.K.: Cambridge Univ. Press, 2008.
[30] D. J. C. MacKay, “Good error correcting codes based on very sparse matrices,”IEEE Trans. Inf. Theory, vol. 45, no. 2, pp. 399–431, Feb. 1999.
[31] D. Daut, J. Modestino, and L. Wismer, “New short constraint length convolutional code constructions for selected rational rates,” IEEE Trans. Inf. Theory, vol. 28, no. 5, pp. 794–800, Sep. 1982.
[32] N. Otsu, “A threshold selection method from gray-level histograms,”
IEEE Trans. Syst., Man, Cybern., vol. 9, no. 1, pp. 225–236, Jan. 1979. [33] Machine Identification Code Technology in Color Laser Printers Electronic Frontier Foundation, accessed Dec. 2009 [Online]. Available: http://www.eff.org/wp/investigating-machine-identifica-tion-code-technology-color-laser-printers.html
[34] Digital Video Broadcasting—Satellite—Second Generation (DVB-S2) Standard accessed Sep. 2010 [Online]. Available: http://www.etsi.org/deliver/etsi_tr/102300_102399/102376/01.01. 01_60/tr_102376v010101p.pdf
[35] C. M. Hains, S. Wang, and K. T. Knox, “Digital color halftones,” in
Digital Color Imaging Handbook, G. Sharma, Ed. Boca Raton, FL: CRC , 2003, ch. 6.
[36] O. Bulan, J. Mao, and G. Sharma, “Geometric distortion signatures for printer identification,” inProc. IEEE Int. Conf. Acoust. Speech Signal Process., Taipei, Taiwan, Apr. 2009, pp. 1401–1404.
[37] S. J. Simske, J. S. Aronoff, and M. Sturgill, “Revenge of the physical-mobile color barcode solutions to security challenges,” Hewlett-Packard Lab., Palo Alto, CA, Tech. Rep. HPL-2010-7, Jan. 21, 2010 [Online]. Available: http://www.hpl.hp.com/techre-ports/2010/HPL-2010-7.pdf
[38] D. J. C. MacKay, “Errata for “Good error correcting codes based on very sparse matrices”,”IEEE Trans. Inf. Theory, vol. 47, no. 5, p. 2101, Jul. 2001.
Orhan Bulan(S’10) received the B.S. degree with high honors in electrical and electronics engineering from Bilkent University, Ankara, Turkey in 2006, the M.S. degree in electrical and computer engineering from University of Rochester, Rochester, NY in 2007, and is currently pursuing the Ph.D. degree candidate in the Department of Electrical and Com-puter Engineering at the University of Rochester.
He was with Xerox Webster Research Center, Webster, NY, during the summers of 2009 and 2010 as a Research Intern. He is the recipient of best student paper award at the 2008 Western New York Image Processing Workshop organized by the Rochester Chapter of the IEEE Signal Processing Society. His research interests include signal processing, image processing, multimedia security, halftoning, and error correction coding.
Gaurav Sharma (S’92–M’96–SM’00) received the B.E. degree in electronics and communication engineering from the Indian Institute of Technology Roorkee (formerly the University of Roorkee), India, in 1990; the M.E. degree in electrical communication engineering from the Indian Institute of Science, Bangalore, India, in 1992; and the M.S. degree in applied mathematics and Ph.D. degree in electrical and computer engineering from North Carolina State University, Raleigh, in 1995 and 1996, respectively.
From August 1996 through August 2003, he was with Xerox Research and Technology, Webster, NY, initially as a Member of Research Staff and subsequently as a Principal Scientist. From 2008 to 2010, he served as the Director for the Center for Emerging and Innovative Sciences (CEIS), a New York State-funded center for promoting joint university-industry research and technology development, which is housed at the University of Rochester. He is currently an Associate Professor at the University of Rochester in the Department of Electrical and Computer Engineering, the Department of Biostatistics and Computational Biology, and the Department of Oncology. He is the Editor of theColor Imaging Handbook(Boca Raton, FL: CRC Press, 2003). His research interests include media security and watermarking, color science and imaging, genomic signal processing, and image processing for vi-sual sensor networks
Dr. Sharma is a member of Sigma Xi, Phi Kappa Phi, Pi Mu Epsilon, SPIE, IS&T, and the IEEE Signal Processing Society (SPS) and the IEEE Communi-cations Society. He was the 2007 Chair for the Rochester section of the IEEE and served as the 2003 Chair for the Rochester chapter of the IEEE SPS. He cur-rently serves as the Chair for the IEEE Signal Processing Societys Image Video and Multi-Dimensional Signal Processing (IVMSP) technical committee. He is member of the IEEE SPSs Information Forensics and Security (IFS) technical committee and an advisory member of the IEEE Standing Committee on In-dustry DSP. He is the Editor-in-Chief for theJournal of Electronic Imagingand in the past has served as an Associate Editor for the IEEE TRANSACTIONS ON IMAGEPROCESSINGand the IEEE TRANSACTIONS ONINFORMATIONFORENSICS ANDSECURITY.