1.
Business Development
Business System Economics and
Management
CO-CHAIRS: Dr. Dušan Baran Dr. Jogaila Mačerinskas Dr. Iveta Šimberova SECRETARIES: Laura Aidukien÷COMMODITIES MARKET DEVELOPMENT Dušan Baran
European Polytechnic Institute Ltd. Czech Republic e-mail [email protected]
Abstract. Commodities, whether food, energy, metals and chairs they are sitting on are real, tangible things that are part of our everyday lives. All have different characteristics, different supply and production criteria, demand and other uses. The main commodities traded on major world exchanges with business volumes significantly exceeding the volume of stock exchanges. In addition to these exchanges, large producers and consumers also traded increasingly small investors. This article shows the dynamic of commodities prices and identifies factors influencing this change. There are a lot of investment opportunities in commodities market both for conservative investors and investors accepting a high level of risk.
Keywords: Commodities, business, investors, development, markets, precious metals, agriculture, inflation.
Introduction
Over the last 130 years, humanity has been witness to several growth commodity trends, each lasting an average of eighteen years, and about the same time, then declined. In the penultimate commodity boom in the years 1968 - 1982 experienced a surge in commodity prices. Many of the commodity prices reached their historic highs. But with every boom comes bust and this boom was no exception. After some 20 years of bear market reached the end of the nineties, global commodity prices have bottomed. After the Internet bubble burst in 2000, a dramatic increase in demand for raw materials from emerging markets and insufficient supply, but also to the monetary policy of central banks, commodity prices began to rise significantly again. Given that the markets were growing and becoming much more attractive asset for many funds, but also retail investors. By this time, the commodity markets from the perspective of small investors, the black sheep of the family investment - small banks serving niche markets, consumers and producers to provide price risk management.
The growth of interest in commodity markets by retail investors contributed electrification markets. The revolution in computer technology has changed a method and system of trading, compared to previous periods of electronic trading platforms for all market participants yielded the same access to business data, flexibility, the market is, more liquid, efficient, investors will get the best price, margins are lower, the market disappeared many dealers who retail investor beggaring.
The aim of this article is to analyze recent trends of commodity market. To reach this aim, prices of commodities (precious metals and agriculture products) are analyzed. Factors influencing commodities prices are identified. Analysis of recent trends and factors of commodities market allows predicting price development and identifying investment opportunities.
In this article these methods are applied: analyses, syntheses, comparison, deduction, induction and graphic methods.
Most commodities are traded globally in dollars. Important role in commodity prices and U. S. plays a central bank. Fed with massive incentives that the government keeps the economy in operation since the beginning of the economic crisis, record increases in commodity prices. Quantitative release in 2010 caused a weakening dollar and lower interest rates. These Steps lead investors to invest in assets such as commodities.
Monitoring the dollar cost is an important aspect of support for trade commodity market as commodities and the dollar generally move in the opposite direction. The most frequently used tools to track the dollar's value is called the dollar index. When the dollar against major currencies strengthened, commodity markets tend to fall and the reverse is also true when value of the dollar falls, commodity markets tend to rise. As can be seen on the graph, the value Dollar comparing CRB index of commodity. This situation is the strong signal for growth in prices commodities.
Graph 1 shows the comparison the dollar index with CRB commodity index.
Graph 1 Comparison the dollar index with CRB commodity index Source: [9]
2. Precious Metals
One of the prerequisites for future developments in commodity markets, precious metals will FED policy and central banks. When comes the third wave of quantitative easing, whereof the chairman, Ben Bernanke is not exponent, can not wait for the rising of commodities in those days regarded as a safe haven.
Gold
One such store of value is gold. Investment demand for the metal is the huge. Current events from a macroeconomic point of view are ideal for gold. Riots in Arab countries fear the spread of
comparison the dollar index with gold.
Graph 2 Comparison the dollar index with gold Source: [11]
Graph 3 shows the development of the gold price with moving averages.
Graph 3 Development of the gold price with moving averages Source: [12]
Graph long-term development of the gold price moving averages (20-day, 50-day, 100 days) shows a clear trend. We see that gold since 2008 has experienced price increases, which is the accompanied by corrections. Now, again hits up, which is confirmed by moving averages. I believe that growth could continue in the coming months.
Silver
Another of precious metals, are considered a safe haven in times of uncertainty, is the silver. Unlike gold, silver has, more industrial uses, the demand for it is of nineteen minor part driven by investors and speculators. Never the less, as shown by the graph price of silver tends to move in correlation with the gold. Silver is a good investment when inflation.
Graph 4 shows the development of the gold price and silver price.
Graph 4 Comparison of the gold and silver price development Source: [12, 13]
Graph 5 Growth in silver consumption in new application areas Source: [13]
3. Agriculture
There are several important reports that market participants are watching. Perhaps the most importantis the report published by the U. S. Department of Agriculture (USDA - United States Department of Agriculture), bringing reports of American and world production, cultivation farmers' intentions for the coming harvesting season, and an overview of consumption and stock agricultural crops. During the development of the USDA issued any further reports determining the approximate volume of harvest.
3.1 Corn
The United States is the world's largest producer and exporter of corn. Although exported only 30% of its domestic production, this 30 % represents 80 % of the total volume of world trade in maize. According to the U. S. Department of Agriculture, issued USDA report, the ratio of stocks in 2011 would fall to lowest level since record-season 1995 - 1996. Closing stocks in the United States should move at 675 million bushels. The previous estimate of 745 million counted. USDA therefore expected to rise.
Table 1 show the USD a corn report.
Table 1 USDA corn report Source: [14]
Chart of the development of maize prices moving average (20-day, 50-day, 100 days) indicate an upward trend. Technical analysis suggests that the upward trend could continue, however, may be accompanied by severe corrections. These corrections can be strong good opportunity to buy.
Graph 6 shows the development of the corn price.
Graph 6 Development of the corn price Source: [14]
3.2 Ethanol Graph 7 shows the U S ethanol production.
Conclusions
Prices of commodities in the last decade soared to their historical highs and there are still a lot of assumptions that this growth will continue. One of the main reasons why it is the influence of developing countries as demand for agricultural raw materials, metals, oil, energy, construction materials, as well as the increasing population in these countries, their reaching and changing eating and consumer habits, long-term reduction of cultivated land, all brings with it increased demand for commodities. Another factor is the policy of central banks, whose actions led to an increase in asset prices. In addition, the central bank holds interest rates at such levels that returns are negative after inflation. In such conditions, investors are leaving traditional investment instruments and deposit their money into assets such as commodities. About the where and how to invest, the investor must decide for himself with regard to their knowledge and preferences. Investment ideas and practices are vastly different depending on which side of the investor and lean as a theory take as their own. Because conditions in the markets in recent times often change, trading commodities and commodity indices is need active investment management. But attention to proactively manage the increasingly seems like a necessity in any market, whether stock or commodity. If an investor wants to succeed, he must adapt to the market.
References
1.BARAN, D. Kapitálový trh a podnikové financie, Vydavatelstvo STU Bratislava 2003, 169 s. 2.ESNÍDAL, T.; PODHAJSKÝ, P. Obchodování na komoditních trzích. 2. rozš. vyd. Praha : Grada, 2007. 200 s.
3.ROGERS, J. Žhavé komodity. 1. vyd. Praha : Grada, 2008. 240 s. 4.Jílek, J. Akciové trhy a investování. 1. vyd. Praha : Grada, 2009. 656 s.
5.WILLIAMS, L. Kompletní průvodce obchodováním komodit. Praha : Centrum finančního vzdělávání, 2008. 277 s.
6.Financnik.cz. Více o čtení gafů. [online]. 2009. [cit. 2010-12-31]. Dostupné z WWW: <http://www.financnik.cz/komodity/manual/komodity-grafy-zdarma.html>.
7.U.S. Commodity Futures Trading Commission. Market Reports. [online]. 2011. [cit. 2011-03-01]. Dostupné z WWW: <http://www.cftc.gov/dea/futures/deacbtsf.htm>.
8.Commodity Correlations. [online]. 2009 [cit. 2011-01-13]. Dostupné z WWW:
<http://www.marketoperation.com/index.php?option=com_content&view=article&id=121&Itemid =119&eec86572714ce954078c219351033410=5a548b23da5e0357abe09528ce1c01a5>.
9.U.S. Business Cycles. [online]. 2011 [cit. 2011-02-13]. Dostupné z WWW: <http://www.thumbcharts.com/series/us-business-cycle-graphs-1913-2011>.
10.Investice.ihned.cz. Komoditní ETF fondy. [online]. 1996-2011 [cit. 2011-02-26]. Dostupné z WWW: <http://investice.ihned.cz/c4-10174900-32948990-i00000_d-komoditni-etf-fondy-prijdou-vhod-ii>.
11.SPDR Gold Shares [online]. 2011 [cit. 2011-02-15]. Dostupné z WWW: <http://www.spdrgoldshares.com/sites/us/>.
12.IShares Gold Trust [online]. 2011 [cit. 2011-02-13]. Dostupné z WWW: <http://us.ishares.com/product_info/fund/overview/IAU.htm>.
13.THE SILVER BOOK [online]. 2009 [cit. 2011-02-02]. Dostupné z WWW: <http://www.virtualmetals.co.uk/index.php?inc=products&id=cp11>.
14.United States Department of Agriculture [online]. 2010 [cit. 2011-02-02]. Dostupné z WWW: <http://www.ers.usda.gov/Briefing/Corn/>.
ECONOMIC EVALUATION OF PROJECTS CO FINANCED FROM THE EUROPEAN FUNDS
Dagmar Čámská
University of Economics, Prague, e-mail [email protected]
Abstract. This article is focused on investment projects which are co financed from the European funds. The European funds are important source of money to the Czech economy. The aim of the paper is shown economic evaluation of supported projects. Economic evaluation of these projects will be compared with theoretical approaches of business economics. There are several types of supported programmes. Two will be chosen and compared. Although it seems that economic evaluation follows all theoretical recommendation mistakes can always occur. Classical techniques, wrong estimations and bureaucracy followed by corruption are meant as main failures.
Keywords: investment projects, Czech financial support programmes, European funds, economic evaluation, failures of evaluation.
Introduction
This paper describes economic evaluation of projects co financed from the European funds in the Czech Republic. First the financial support programmes are introduced as an important source of money. Then two financial supported programmes are chosen and their application requirements are shown. The methods of evaluation are discussed. Everything is compared with theoretical approaches and recommendations of business economics in the field of investment projects and investment decision making. If it is possible results are documented with the help of surveys. The last part deals with potential failures of application evaluation.
1. Investment
This article is focused on microeconomic or business approach of investment. According to Scholleova1 in a narrower sense investment is an asset which is not directly consumed but used to creating additional asset, the company then sells on the market. It is hardly imaginable that any company is able to survive for a long time without investment. Each investment is connected at the beginning with one-off (short-term) cash outlay2. There are various sources of finance. Long-term sources are usually used for financing investment. As I have already written3 finance sources can be divided into three categories – traditional internal sources, ownership capital and non-ownership capital. In the Czech Republic the companies most use bank loans and leasing as non-ownership capital. With entering the European Union in 2004 another way to capital was opened. An access to structural funds has been widened. Companies have the possibility to obtain non-returnable subsidies.
2. Financial support programmes
municipalities, regions, ministries, entrepreneurs, owners of transport infrastructure, non-profit organizations, schools, research centres and others.
There are four major groups of programmes for the period of 2007-2013 which are financed thanks to European money:
• Thematic Operational Programs • Regional Operational Programs • Operational Programs Prague • European Territorial Cooperation
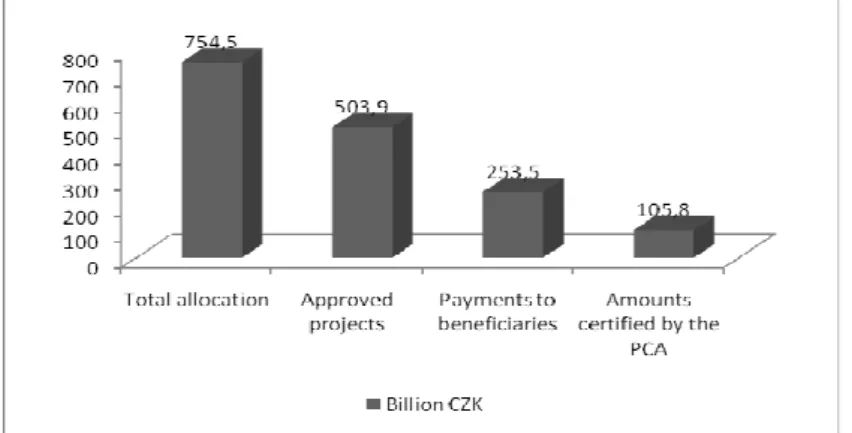
These groups contain together 26 different programmes although this article uses data referring to the state of financial drawing of 19 Czech operational programmes (Objective 1 and 2). The state of financial drawing of other 7 programmes is not included because these programmes are part of the Objective 3 of the economic and social cohesion policy implemented in the Czech Republic. By 3 August 2011 68 958 applications have been submitted in the amount of 1 104.3 billion CZK5. Less than half of projects have been accepted. Figure 1 shows us the latest state of implementation from July 2011. 66.8% of sources have been already allocated and 33.6% of sources have been paid to beneficiaries.
Figure 1 Latest state of implementation of the cohesion policy, Source: own elaboration based on data6 It is obvious that more than half of money is already divided among its beneficiaries but money is still available there. It is time to answer a question how many projects have been supported. Supported projects are distinguished into three groups – cancelled projects during their implementation, already finished projects and ongoing group.
Table 1 show how the projects are divided into specific groups according to different operational programmes. It is necessary to say that numbers are current because the latest update came from 4 August 2011.
Table 1Current number of beneficiaries of European Regional Development Fund, Source: own elaboration based on data7 Number of projects
Opperational programmes All
Canc elled Finali zed Ongo ing
Integrated Operational Program 6942 81 5349 1512
OP Czech Republic-Poland 1638 25 699 914
OP Transport 130 --- 63 67
OP Human Resources and Employment 3120 20 7 3093
OP Enterprise and Innovation 6586 528 2162 3896
OP Prague Adaptability 486 6 66 414
OP Prague Competitiveness 209 11 105 93
OP Fishing 630 26 17 587
OP Technical Assistance 105 4 43 58
OP Research and Development for Innovations 73 --- --- 73
OP Education for Competitiveness 5733 2 7 5724
OP Environment 3578 2 1733 1843
ROP NUTS II South-East 543 7 385 151
ROP NUTS II South-West 552 7 308 237
ROP NUTS II Moravia-Silesia 489 4 273 212
ROP NUTS II North-East 537 5 271 261
ROP NUTS II North-West 291 10 131 150
ROP NUTS II Central Bohemia 490 7 253 230
ROP NUTS II Central Moravia 538 4 419 115
All programmes 32 670 749 12 291 19 630 Getting of support is obviously not automatic because there are many requirements which each project should fulfil. Conditions differ according to different support programmes but some characteristics are common for all programmes.
3. Common requirements
At the beginning the core idea of the project is the most important. First of all each project should contain the general beneficial effect. We mean beneficial in a wide sense because also private companies can ask for money. Secondly the idea of projects has to be consistent with the objectives of the concrete operational program. Third is time because each program has its deadlines when it accepts applications.
Parts of application
There are required parts that each application should include – logical framework, feasibility study, cost-benefit analysis and project budget. If we look at the names and content of these parts they are similar to parts of business plan. Small exception is cost-benefit analysis which is usually not part of typical business plans which are created by profit organisations.
The business plan can be characterized8 as a proposal that sets out a new business venture, direction, product, or course of action. Lamb9 follows that if you write a business plan it is in order
Lamb10 the major plan sections are the general business description, a mission statement, goals, management team, market analysis, the marketing plan, the financial analysis and appendices or supporting documents. We can compare theoretical major plan sections with two handbooks. We have chosen two examples – the handbook of Operational Program Prague Competitiveness and the handbook of ROP NUTS II North-East. It does not matter that one is called feasibility study and the second study of the economic evaluation of the project.
General structure of feasibility study of Operational Program Prague Competitiveness11 includes parts as general information about potential beneficent, description of project, market analysis and estimate of demand, management team and human resource management, technical and technological aspects, impact on the environment, ensure of current assets and investment, project budget, financial plan, evaluation of the effectiveness and sustainability of the project, project schedule, risk management and final project evaluation. On the other hand the document of ROP NUTS II North East12 should contain general business description, market analysis and estimate of demand, technical and technological solution of project, needs and ensure of current assets and investment, financial plan, cost-benefit analysis, risk management and detailed final project evaluation. Both these documents follow theoretical approaches of business economics.
Financial plan and evaluation of project
From business economics point of view the most important parts are financial plan and evaluation of project. Handbooks of financial support programmes specify in detail the components of the financial plan. We do not realize any difference if we study the handbook of Operational Program Prague Competitiveness or the handbook of ROP NUTS II North-East. There are always components as plan of costs and revenues, plan of state property and resources of its coverage and cash flow plan because costs do not have to be expenses in same year as well as revenues are not always incomes at the same period of time.
Each investment project should be evaluated in an economic way if it is enough profitable and it has sense to implement it. Literature describes many methods or criterions for evaluating. Basically the criterions of capital projects are divided into two groups – static and dynamic criterions. The main differences between static and dynamic criterions are written in the article of authors Scholleova, Fotr and Svecova13. Static criterions consider mainly cash flows. They consider time in constraint mode and in principle they do not work with risk. On the other hand dynamic criterions take into account all three factors which mean cash flows, service life and undergone risk as well. Czech companies usually prefer static criterions although they do not consider risk because evaluating is simply. Anglo-American literature does not take into account static criterions such as Anthes14. He points out, despite the difficulty of developing good estimates, especially of benefits, four basic methods for comparing project costs and returns remain in vogue: payback period, ROI, net present value (NPV) and internal rate of return (IRR). Many more have been created, but these four have endured for decades.
Unfortunately Czech research works show that companies prefer statistic criterions. Table 2 contains results from survey of Faculty of Business Administration. The sample consisted 252 Czech companies.
10
Table 2 Criterion used in evaluating investment projects15 Type of criterion Criterion N umber R ake-off static Indices of profitability and
payback
1 90
7 5 %
static Payback period 6
9
2 7 % dynamic Discounted Payback Period 2
8
1 1 % dynamic Internal Rate of Return 5
5
2 2 %
dynamic Net Present Value 5
6
2 2 %
dynamic Profitability Index 2
0
8 %
dynamic Benefit-Cost Ratio 8 3
%
Others 9 4
%
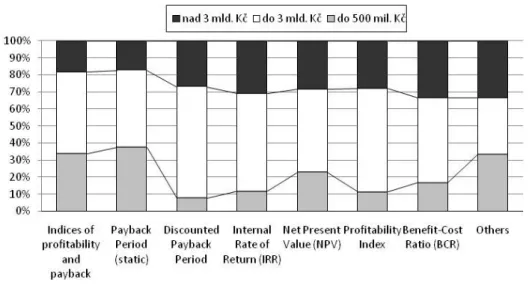
It is not surprising fact that results vary according to the size of the enterprise or size of the capital project. It is obvious that small companies will use less sophisticated methods. Anthes16 indicates an example of the Schwan Food Co. which uses NPV, IRR and payback period to evaluate IT projects costing more than $1 million. The survey of Faculty of Business Administration shows representative results. Figure 2 confirms that large companies and more important projects are evaluated using dynamic criterions.
Figure 2 Using methods depending up to the size of the enterprise, absolute frequencies17 We have discussed capital projects in general. We see that the evaluating in the Czech Republic is not ideal and it does not follow all theoretical approaches and recommendations. We should answer a remaining question how projects co financed from European funds in the Czech
Operational Program Prague Competitiveness18 it has to contain present value, net present value, internal rate of return, profitability ratio and payback period. Application of ROP NUTS II North East19 contains the same minus profitability ratio which has the same explanatory power as net present value. Applicants do not have to count all criterions because they are counted automatically when they fill numbers of financial plan. It is important to note that all potential projects, that should be co financed from European funds in the Czech Republic, undergo economic evaluation. In this case the Czech government do not follow the practices of Czech business environment.
4. Failures
It seems that best approaches for investment decision making have been chosen and they are used by financial support programmes in the Czech Republic. But as we know failures can always occur which has a consequence that the chosen projects are not the best. Finally chosen projects do not have to be the best in main aspects such as profitability, risk or social contribution. As a source of failure can be traced following factors – classical techniques for evaluation, wrong estimations and bureaucracy followed by corruption.
Classical techniques
As classical techniques we mean dynamic criterions for evaluation. The right evaluation is crucial. It is necessary to take into account risks in direct investments project evaluation because we do not live in a world without risks anymore. Difficulties of classical methods are discussed for example in the article by professors Dragota20. They point out that the main problem is the probability distribution for NPV is not normal. The article21 sees solution in modern techniques which can eliminate some of inconveniences. Sensitivity analysis, decision tree, scenario technique, Monte Carlo technique and real options are suggested as modern techniques. Handbooks of financial support techniques react exemplary. As we have already mention risk management and risk analysis should be part of each application but it goes further because also sensitivity analysis is required. In this case sensitivity analysis takes into account the level of change of net present value if some variables are changed. Other techniques as scenarios or Monte Carlo are not used because they are not so easy applicable and they required input knowledge of applicants.
Wrong estimations
Wrong estimations can happen. It is possible to trace two main reasons of wrong estimations. First the applicant does not have all pieces of available information. Secondly the wrong estimation is done as an intentional error by an applicant. First reason can also happen during usual business. The company underestimates risks, overestimates revenues or omits some important factor. It is obvious that the projects should avoid wrong estimations and therefore government authorities require detailed application containing feasibility study. The applicant has to fulfil many pieces of information how we have already mentioned in the part 3.1. It is time for exploring all important things which can change results of the project.
Bigger problem is an intentional error by an applicant. We have already emphasized this in the article Investment projects – importance of pre audit and post audit22. If an entrepreneur
18
Operační program Praha – Konkurenceschopnost Metodická příručka: Studie proveditelnosti pro oblast podpory OPPK [accessed 2011-09-09] <http://www.prahafondy.eu/cz/oppk/dokumenty.html>
appraises a private project, he usually place emphasis on real inputs and data. On the other hand, if an entrepreneur appraises a subsidized project, the main aim is to fulfil predefined criterions. It means that he can cheat in order to obtain subsidies. For example, he can underestimate risks or overestimate cash-flow of the project. Although investors should be honest, they can behave very pragmatically at the moment paradoxically. Sometimes it happens that investors do not want cheat but are not able to reliably predict input data because of very positive expectations caused by possible subsidy obtaining. Consequently, it depends on a project evaluator, whether is able to find discrepancy or not.
5. 3 Bureaucracy followed by corruption
Government contracts and financial support are connected with bureaucracy and corruption in many countries. Unfortunately the Czech Republic is no exceptions. The document Transparency of the regulatory system23 says that bureaucracy and unnecessary red tape remain a source of complaints by both domestic and foreign investors although the Czech Republic ratified OECD anti-bribery convention in January 2000. According to Transparency International's Corruption Perception Index for 201024, the Czech Republic ranks in the 53rd place out of 178 countries. As DATAMONITOR25 mentions the Czech Republic's percentile ranking on the control of corruption is 77.0 in 2008. Among the transitioning countries of the former Soviet bloc, the Czech Republic is rated as one of the better countries in the terms of perception of corruption. But corruption remains and it is general problem which cannot be solved only on the level of financial support programmes.
Conclusions
The paper described economic evaluation of projects co financed from the European funds in the Czech Republic. Two supported programmes were chosen – Operational Program Prague Competitiveness and ROP NUTS II North-East. Application requirements were discussed and compared between programmes. Although it seems that application requirements include all important components of classical business plan and economic evaluation follows all theoretical recommendation of investment decision making failures can always occur. Classical techniques, wrong estimation and corruption are pointed out as sources of failures.
The article is one of the outputs from the research project “Analysis and evaluation of investment projects financed from European funds” registered with the Internal Grant Agency of University of Economics, Prague under the number F3/32/2011.
References
1.Anthes, G. What is your project worth? Computerworld; 3/10/2008, 42(11), p. 29-32.
2.Čámská, D., Kula, D. Financial Support Programmes and their Prediction Models. Scientific proceedings, 2011, 19(2), p. 728–736.
3.Dragotă, V., Dragotă, M.I. Models and Indicators for Risk Valuation of Direct Investment. Economic Computation & Economic Cybernetics Studies & Research; 2009, 43(3), p. 1-7. 4.Kislingerova, E. and others. New Theory of Economy and Management in Organizations and Their Adaptation Processes. Survey of Faculty of Business Administration, University of Economics, Prague, 2008.
5.Kula, D., Čámská, D. Investments Projects – Importance of Pre-audit and Post-audit. SCIENTIFIC PROCEEDINGS, 2011, 9(2), p. 737–742.
6.Lamb, S.E. How to Write It: Business Plans and Reports. Business and Economic Review; Oct-Dec 2006, 53(1), p. 17-24.
7.Scholleova, H. Ekonomické a finanční řízení pro neekonomy, Grada, 2008, p. 103.
8.Scholleova, H. Investiční controlling: jak hodnotit investiční záměry a řídit podnikové investice. Grada, 2009, p. 13.
9.Scholleova, H., Fotr, J., Svecova, L. Investment Decison Making Criterions in Practice. Economics and Management; 2010, p. 1018-1023.
10.Datamonitor: Czech Republic. Czech Republic Country Profile; 2010, p. 1-70.
11.Macro-accessibility in Czech Republic: 2Transparency of the regulatory system. Czech Republic Economic Studies; 2007, p. 31-33.
12.Operační program Praha – Konkurenceschopnost Metodická příručka: Studie proveditelnosti pro oblast podpory 3.3 OPPK available on http://www.prahafondy.eu/cz/oppk/dokumenty.html 09-09-2011
13.Press release: Index vnímání korupce 2010: Česko je letos na 53. místě a patří k zemím, kde se situace zhoržila [accessed 2011-09-09]
<http://old.transparency.cz/index.php?lan=cz&id=16&pom_id=99>
14.ROP NUTS II North-East – Příloha č.5 PPŽP Studie ekonomického hodnocení projektu [accessed 2011-09-09] <http://www.rada-severovychod.cz/file/1530>
15.European Union funds. [accessed 2011-03-30] <http://www.strukturalni-fondy.cz/Information-about-EU-Funds>
ON THE MOTIVATIONAL ACCENT IN THE MANAGEMENT ACTIVITIES IN
CONDITION OF ICT COMPANIES1
Tatiana Corejova, Lubomir Bombala University of Zilina,Slovak Republic.
e-mail [email protected], [email protected]
Abstract. The paper deals with the results of inner motivational aspects of highly qualified employees of information and communication (ICT) companies. It is based on qualitative research and the data had collected from different ICT transnational companies during the 2010 year that was conducted at the University of Zilina, Slovak republic. The main goal of empirical research was to investigate motivation accent in the managerial activities in the ICT companies. The purpose was to show that implementation of the motivation accent in managerial activities can help to improve employee motivation and to increase their performance, loyalty to the organization in the ICT sector. The special attention in frame of investigation in ICT companies was devoted on the employee’s self-assessment of his/her inner motivation. We took in consideration such aspects like employee intrinsic motivation, management areas and attributes of the manager. So, the contribution follows four areas that have key importance for employees in ICT company and that are related with inner motivation of employees e.g. inner motivation to quality of work, to ongoing increasing of the level of professional knowledge and skills, to provide new motives and increase the effectiveness of performed processes and to cooperate with manager and other departments of the company. The investigation was based on the combination of research methodologies and three main methods: scientific observation, questionnaires and comparison with the previous research in the similar environment (the number and rate of highly educated or highly qualified employees in the company).
Keywords: motivation, motivation accent, human potential, management, information and communication company, highly-qualified employee
Introduction
The fast technology changes in the information and communication technology require the education and motivation of employees with balanced using of the long-valid principles and the newest information. The changes of the motivation of highly-qualified employees with specific combination of competences and skills2, contents and forms of motivation or stimulation are characterized by conversion from classic to integrated forms. Manager of ICT company has to have skills to create universal communication and motivation frame. The companies prefer to pay for studies provided by different personal agencies about salaries, benefits in certain sector in certain place. They are not willing to offer much better conditions except the moment they see big advantage from hiring of particular person. The highly qualified employees of information and communication (ICT) companies (human resource) are the main capital in ICT companies. They have a lot of possibilities also in the crisis time to change the employer and they are carrier of tacit knowledge. But they have also good salaries in comparison with another sectors, employees or industries and so we have to give attention on the motivation aspects of these employees. That is
why we decided to focus our case study on those areas that can make difference in the stimulation (salary or other material form of salary). University of Zilina has participated in several projects that investigate the problems of motivation and focused on examination the knowledge economy aspects and whole knowledge process from creation up to dissemination of knowledge.
1. Theoretical background
The theoretical background of motivation is discussed in many books and publications. It is not easy to introduce shortly all theoretical concepts. They are based on the investigation and results of different sciences – psychology, sociology, economics, management etc. In the context of motivation of employees the purpose of motivation is connected with the terms: performance and efficiency of employees. Robins and Coulter3 regard the performance and efficiency as the same term, but the author (Blašková 2006, p. 102) differentiates between these terms and argues by benefits of efficiency growing following by employee performance. The content of the employee activities and the intensity of these activities depend on subjective conditions that are noted as the motivation of people activity. The psychology differentiates two groups of motivation to the work, two types of motivation4:
• motives that are connected with the work e.g. intrinsic motivation (inner motivation)
•motives that are connected with another areas, e.g. extrinsic motivation 5
Both motives determine the success of company, its performance, profitability, stability etc. The scale of motives in relation to intrinsic and extrinsic motivation depends on the position and tasks of employees. By the highly educated employees demonstrate the willingness to increase the total level of their work when their motivation by managers is better6. The approach to the investigation of motivation of highly educated employees with specific knowledge and skills presented in Blaskova, Grazulis, (2009) was used for empirical research of motivation in condition of ICT companies.7
2. Empirical study
The empirical research was focused also on areas/attributes of manager that are necessary for proper motivation of his/her employees on following 8 areas of the management of human potential in the organization:8
• Strategic management and development of highly-qualified employees
• Planning of highly-qualified employees
• Obtaining and choosing of the new highly-qualified employee
• Orientation and positioning of highly-qualified employees
• Evaluation of complex working performance of highly-qualified employees
• Motivation of highly-qualified employees
• Creative management of highly-qualified employees
• Education and development of the knowledge and skills of highly-qualified employees
3
Bedrnová, E. – Nový, I. a kol. 2004. Psychologie a sociologie řízení. 2. vyd. Praha: Management Press, 586 s. ISBN 80-7261-064-3.
4
Bedrnová, E. – Nový, I. a kol. 2004. Psychologie a sociologie řízení. 2. vyd. Praha: Management Press, 586 s. ISBN 80-7261-064-3.
The mentioned areas of management of human potential in the company are offering 2 levels how organizations can benefit from the employee motivation. The first level that we can call primary is related to the direct motivation of employees that are in scope of the process of the motivation. We can see it as a consistence between targets and ambitions of new employees with targets and ambitions of the organization. The second level that we can call secondary is related to the level of motivation of managers and people that participated on the process of employee motivation after successful motivation of the new employee9. This can result in better willingness to perform this process with other employees in the future. In the following text of contribution the motivation tools and self motivation problems from the point of view highly-qualified employees are discussed.
2.1 Basic data research
Case study was based on the empirical research in the several translational companies in ICT sector. The questionnaire included 21 questions and followed up the research made by Blašková (2006)10. It has been distributed 124 questionnaires and as received back 55 questionnaires what represents 44 % of the distributed amount. The research has the attributes of qualitative research, the number of respondents is relatively small, our methods are stochastic and we use subjective ways of interpretation of the results. We used the supporting methods – comparison, analysis of secondary data and analysis of internal documents of companies that are orientated on human resources management. The distribution of 55 respondents was following: 38 male respondents and 17 female respondents. The distribution from the point of view of age, gender, achieved education and length of work experience are shown in Table 1-3.
Table 1 Age structure of the respondents
Age of the respondents Number of respondents % of respondents
up to 24 years 5 9
25-34 years 32 58
35-44 years 11 20
45-54 years 3 5
Table 2 Structure of respondents by level education
Level of education Number of
respondents
% of respondents
basic education 0 0
special secondary 3 5
general secondary (e.g. grammar school) 2 4
higher education (e.g. DiS) 3 5
bachelor’s degree 12 22
Master’s degree (e.g. Mgr., MsC., Ing., Mag.) 33 60
university postgraduate 2 4
Table 3 Structure of respondents by work experiences
Length of work experience Number of
respondents % of respondents up to 2 years 9 16 3-5 years 21 38 6-10 years 5 9 11-20 years 14 25
more than 21 years 6 11
Results
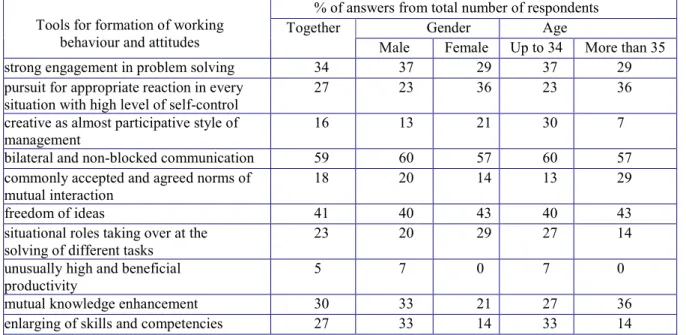
In this part of contribution we discussed the selected question and aspects of motivation related to motivational tools, their perception by employees, self motivation and inner motivation aspects. We have suggested some ways how to implement motivation accent in the process of creative management of the employees. We would like to emphasize those instruments that are the most frequently used. Such instruments are: bilateral and non-blocked communication and freedom of ideas. The very seldom used instruments are: unusually high and beneficial productivity and creative as almost participative style of management. We can see from the results in the table 4 that many of the instruments are not widely used in the ICT sector.
On the question, that was related to the area of education and development of the knowledge and skills of employees in ICT organizations, 75 % of employees confirmed that their manager pay certain level of attention to education. The aspect that we should consider is the gender difference. Female respondents have replied (36% of them) that their manager pays no and rather no attention to education and development of the knowledge and skills. This can be understood in different ways. In general ICT organizations offer some way of internal CBT courses to develop the knowledge and skills. They may really expect more involvement and interest of their manager in the training or they see the opportunities provided by company as insufficient. Without making any final judgment we can declare that management approach in this area can really vary from position to position and from department to department and female employees see this area as the area where they expect improvement in their manager approach.
Table 4 Tools used by manager for formation of working behavior and attitudes
% of answers from total number of respondents
Gender Age
Tools for formation of working behaviour and attitudes
Together
Male Female Up to 34 More than 35
strong engagement in problem solving 34 37 29 37 29
pursuit for appropriate reaction in every situation with high level of self-control
27 23 36 23 36
creative as almost participative style of management
16 13 21 30 7
bilateral and non-blocked communication 59 60 57 60 57
commonly accepted and agreed norms of mutual interaction
18 20 14 13 29
freedom of ideas 41 40 43 40 43
situational roles taking over at the solving of different tasks
23 20 29 27 14
unusually high and beneficial productivity
5 7 0 7 0
mutual knowledge enhancement 30 33 21 27 36
enlarging of skills and competencies 27 33 14 33 14
Table 5 Manager attention to education and development
% of answers from total number of respondents
Gender Age
Answer
Together
Male Female Up to 34 More than 35
Answer "yes" 7 3 14 10 0
Answer "mostly yes" 34 33 36 33 36
Answer "partially" 34 43 14 33 36
Answer "rather no" 18 13 29 20 14
Answer "no" 7 7 7 3 14
Table 6 shows the answers on the question that was focused on the more detailed areas by which the managers have possibility to influence the employee education. We have chosen some of the areas where manager can direct the education. Managers direct the education to areas that are connected with the particular position and to areas which are required by organization. There is very small possibility that employee will participate on the training that is chosen randomly from the list of available classes. The third areas where the education can be oriented are courses necessary for fulfilment of employee carrier aspirations. 25 % of respondents stated such possibility is present at their manager. This is important motivational aspect in the organization. Very interesting are the results according to age of respondents. They have showed that employees with higher age than 35 have almost no possibility to participate on such courses (in our research 0 %). This can be explained by several reasons. They do not request such courses and prefer to stay longer at the current position. This can be connected also with their private life and family background. They are not willing to change position so often. And also managers expect from them to stay longer at the current position. 40 % of the employees have got such opportunity to attend courses necessary for their carrier aspiration. This is quite high percentage but can be caused by two reasons. Majority of employees are relatively young. As we can see at the beginning of the article (67%) employees that
Table 6 Orientation of employee education
% of answers from total number of respondents
Gender Age
Orientation of employee education
Together
Male Female Up to 34 More than 35 randomly chosen courses from arbitrary
area
5 7 0 3 7
courses necessary for particular position or working arrangement
45 50 36 47 43
courses necessary for fulfillment of your carrier aspirations
25 23 29 40 0
courses required by the organization and organizational unit
43 47 36 50 29
The success of the motivation program from the employee point of view depends on the characteristics of motivation system of company and on the possibilities to change or to influence the system by manager in relation with the individual needs and motives of employees11. We have asked on these characteristics and we have used the term “influenced by your manager” because especially managers have the possibility to influence their employees. We can declare as we can see from results that employee opinions in this area are very critical. The most critical and skeptical in this area are employees older than 35 years. This area would require wider research to find out what employees see as the cause of this problem. If it is management structure, size of the company or their manager.
Table 7 Respect of individual needs in motivation system
% of answers from total number of respondents
Gender Age
Answer
Together
Male Female Up to 34 More than 35
"yes" 7 3 14 10 0
"rather yes" 14 13 14 13 14
"partially" 48 47 50 53 36
"rather no" 27 33 14 23 36
"no" 5 3 7 0 14
The type of communication between employee and manager is the important for the effectiveness of motivation as well as on the performance management in the company.12 The level of communication has direct impact on communication interchange and because of this has very big influence on quality of work of employees and as a consequence also on the level of their motivation. The results (Table 8) show that communication is on the good level (answers yes and mostly yes) in the case of 68 % of respondents. If we take in consideration the fact that remaining 32 % of respondents have troubles in this area we see this as the right place where the improvement is needed.
Table 8 Openness, effectiveness and regularity of communication with manager
% of answers from total number of respondents
Gender Age
Answer
Together
Male Female Up to 34 More than 35
"yes" 23 27 14 20 29
"mostly yes" 45 40 57 50 36
"sometimes" 25 27 21 20 36
"mostly no" 5 3 7 7 0
"no" 2 3 0 3 0
Source: own research
During the empirical research we have tried also to measure the perception of different motivational instruments by employees. We have obtained question from one respondent if the question is set properly regarding phrase “uses or should use”. The explanation is that we want to know what instrument is the best independently from the fact of manager uses it or it is just the wish of the employee. The four instruments with the best perception by employees are: creation of good relationships, providing of necessary information, providing space for independent action and possibility to participate in educational activities. There are the same instruments considered as the best by male respondents. Female respondents consider as the best instruments: possibility to participate in educational activities, providing of necessary information, enabling of carrier growth, acknowledgement of personal bonus and rewards, creation of good relationships. We can see that female respondents consider carrier growth and acknowledgement of personal bonus and rewards as very effective motivational instrument. This difference can be explained by comparatively smaller amount of female employees and positions that they have in the ICT companies. Employees with age to 34 years consider as most effective instruments: creation of good relationships, enabling of carrier growth and possibility to participate in educational activities. Employees older than 35 years consider as the most effective: providing of necessary information, creation of good relationships, providing space for independent action.
Table 9 Perception of effectiveness of motivational tools
% of answers from total number of respondents
Gender Age
Motivational tools
Together
Male Female Up to 34 More than 35 acknowledgement of personal bonus and rewards 6 5,7 6,6 6,2 5,1
providing of necessary information 6.5 6,4 6,8 6,5 6,3
enouncement of praise 5.3 5 5,9 6 3,9
creation of good relationships 6.6 6,6 6,6 6,8 6,2
manifestation of the interest in your opinions and ideas
5.5 5,6 5,5 6 4,6
providing space for independent action 6.4 6,5 6,1 6,5 6,1
enabling of carrier growth 6.2 5,7 6,7 6,7 5,2
correctness of direct supervisor and management 5.5 5,5 5,6 5,6 5,3
possibility to participate in educational activities 6.4 6,1 6,9 6,6 5,8
4 areas that have key importance for employees in ICT Company and that are related with inner motivation of employees:
-To quality of work
-To ongoing increasing of the level of professional knowledge and skills
-To provide new motives and increase the effectiveness of performed processes -To cooperate with manager and other departments of the company
-As we can see from results in table 10 employees in the ICT companies have high level of motivation to quality work. We cannot see any major differences from the point of view of age and gender of respondents.
Table 10 Inner motivation of employees to quality of work
% of answers from total number of respondents
Gender Age
Answer
Together
Male Female Up to 34 More than 35
very high 32 33 29 33 29
sufficiently high 50 57 36 47 57
average 18 10 36 20 14
rather low 0 0 0 0 0
low 0 0 0 0 0
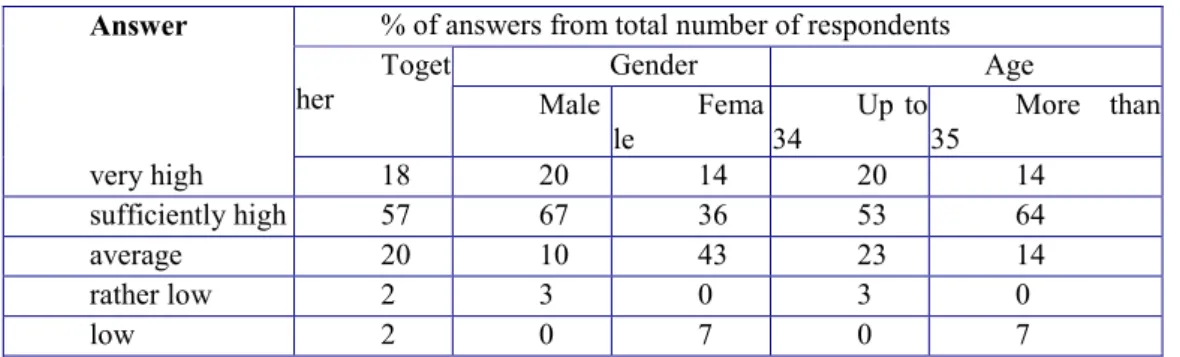
Table 11 Inner motivation of employees to ongoing increasing of the level of your professional knowledge and skills % of answers from total number of respondents
Gender Age
Answer
Toget
her Male Fema
le Up to 34 More than 35 very high 18 20 14 20 14 sufficiently high 57 67 36 53 64 average 20 10 43 23 14 rather low 2 3 0 3 0 low 2 0 7 0 7
The results introduced in Table 11 employees in the ICT companies have high level of motivation to ongoing increasing of the level of your professional knowledge and skills. We cannot see any major differences from the point of view of age of respondents but there is little bit higher motivation at the employees younger than 34 years. There is visible difference from the point of view of gender. 87% of male respondents have sufficiently high or very high inner motivation but only 50% of male respondents have such level of inner motivation to ongoing increasing of the level of professional knowledge and skills.
Table 12 Inner motivation of employees to provide new motives and increase the effectiveness of performed processes % of answers from total number of respondents
Gender Age
Answer
Together
Male Female Up to 34 More than 35
very high 14 17 7 10 21
sufficiently high 32 33 29 30 29
average 43 40 50 47 36
rather low 11 10 14 13 7
low 2 0 7 0 7
The level of motivation to provide new motives and increase the effectiveness of performed processes is the lowest from the 4 areas we are measuring (Table 12). 46 % of respondents have very high or sufficiently high level of motivation in this area. The higher level of this motivation is present at male respondents compared to female respondents and at the employees older than 35 years compared to younger employees.
The motivation to cooperate with manager and other departments of the organization is relatively good (Table 13). There are only 7% of the respondents that declared lower level of the motivation in this area. From the point of view of gender and age the stronger groups in this area are male respondents and respondents up to 34 years. But differences are relatively small when we consider the amount of respondents that participated on this research.
Table 13 Inner motivation of employees to cooperate with your manager and other departments of the organization % of answers from total number of respondents
Gender Age
Answer
Together
Male Female Up to 34 More than 35
very high 14 13 14 17 7 sufficiently high 43 47 36 43 43 average 36 37 36 30 50 rather low 7 3 14 10 0 low 0 0 0 0 0 Conclusions
The article has introduced to part of survey results about characteristics and challenges of motivational aspects from the point of view highly qualified employees at the ICT markets and highlighted the importance for any ICT organisation or company to consider motivational aspects in the managerial work. The case study confirms and broadens the theoretical findings on importance of motivational aspects, on the inner motivation that is very important in the case of highly educated employees. There is no universal recipe for the successful motivation of these employees in ICT companies. Most of the aspects are related to manager’s personality and his/her managerial skills. They create natural environment in which employees can optimally use their knowledge and skills for the welfare of the organization. The aspects that had the lowest presence in our research are: usage of effective instruments for motivation, thorough knowledge and control of manager’s emotions and organizational knowledge, knowledge from the area of management and development of human potential. Another problem is the insufficient level of emotional intelligence and lack of
3.Blašková, M., Grazulis, V. 2009. Motivation of Human Potential: Theory and Practice. Publishing Centre of Mykolas Romeris University, 2009.
4.Blašková, M. et al., 2006. Riadenie a rozvoj vysokokvalifikovaného ľudského potenciálu, TU, Zvolen.
5.Nakonečný, M. 1992. Motivace pracovního jednání a její řizení, Management Press, Praha 6.Plamínek, J. 2007. Tajemství motivace, Grada Publishing, Praha.
7.Plamínek, J., 2008. Vedení lidí, týmů a firem, Grada, 2008, Praha.
8.Robins S. P. – Coulter M. 2004. Management. Praha: Grada Publishing, p. 496.
9.Strenitzerová, M., Poniščiaková, O., 2006. Diagnostika a manažment procesov v riadení ľudských zdrojov, EDIS, Žilina.
10.Thorne, K., Pellant, A., 2007. The essential guide to managing talent: How top companies recruit, train & retain the best employees, Kogan Page, London and Philadelphia.
ATVYKSTAMASIS TURIZMAS LIETUVOJE: ANALIZö IR VYSTIMOSI TENDENCIJOS
Aldona Damulien÷
Mykolo Romerio universitetas, Ateities g. 20, LT-08303 Vilnius el. paštas [email protected]
Santrauka. Straipsnyje analizuojamas Lietuvos atvykstamasis turizmas ir jo vystimosi tendencijos. Nagrin÷jama turizmo sampratos kilm÷ ir apbr÷žimų įvairov÷, atskleidžiami esminiai turizmą charakterizuojantys bruožai. Analizuojamas Lietuvos atvykstamojo turizmo vystimasis 1993 – 2010 metais ir jį įtakojantys veiksniai. Atskleidžiamos globalios problemos su kuriomis susiduria turizmo sektorius
Raktiniai žodžiai: turizmo rinka, atvykstamasis turizmas, užsienio lankytojai, turistai, turizmo eksporto pajamos.
Įvadas
Turizmas – viena perspektyviausių ir stambiausių ekonomikos sektorių pasaulyje. 2010 m. turizmo ind÷lis į pasaulio bendrąjį vidaus produktą (BVP) siek÷ apie 5%. Tarptautinio turizmo eksporto pajamos sudar÷ 919 mlrd. JAV dolerių (693 mlrd. eurų) (beveik 3 mlrd. JAV dolerių per dieną), o tai daugiau kaip 30 % pasaulio paslaugų eksporto arba 6 % bendro prekių ir paslaugų eksporto1. Pagal prekybos apimti tarptautinis turizmas užima ketvirtą vietą po kuro, cheminių medžiagų ir automobilių pramon÷s produkcijos eksporto. Turizmo sektoriuje sukurta daugiau nei 235 mln. darbo vietų (8 % visos darbo j÷gos). 2010 m. pasaulio valstyb÷s sulauk÷ iki 940 mln. keliautojų. 2011 m. JT PTO prognozuoja atvykstančių turistų skaičiaus augimą nuo 4 % iki 5 %2.
Turizmas – tai atviros šalies įvaizdis, paslaugų sferos pl÷tojimas, geresnis šalies infrastruktūros naudojimas, darbo efektyvumo didinimas, naujų darbo vietų sukūrimas, geresnis veiklos pasiskirstymas regionuose, aktyvesn÷ užsienio valiutos apyvarta, šalies pajamų did÷jimas, mažų ir vidutinių įmonių pl÷tra, ryšių su kitais ekonomikos sektoriais stipr÷jimas.
Tod÷l Lietuvai, siekiančiai pagerinti mok÷jimų balansą, užtikrinti pakankamus ir stabilius tvirtos valiutos gavimo šaltinius, kurti naujas darbo vietas, skatinti šalies infrastruktūros ir atskirų regionų ekonomikos augimą, pritraukti potencialius užsienio investuotojus, spartus turizmo vystymas gali tapti būtina ir esmine šių tikslų pasiekimo sąlyga.
Tyrimo tikslas: išnagrin÷ti Lietuvos atvykstamąjį turizmą ir jo vystimosi tendencijas. Tyrimo objektas: atvykstamasis turizmas.
Siekiant užsibr÷žto tikslo, numatoma:
1. Atskleisti ir įvertinti turizmo sampratos įvairovę;
2. Išnagrin÷ti Lietuvos atvykstamojo turizmo kitimą 1993 – 2010 metais ir pagrindinius įtakojusius veiksnius;
3. Įvardinti globalias problemas su kuriomis susiduria ir turizmo sektorius.
Tyrimo metodai: straipsnis parengtas sistemin÷s, bendrosios, login÷s, lyginamosios analiz÷s ir apibendrinimo metodais.
1. Turizmo definicija
Etimologiškai, žodis „turizmas“ yra kilęs iš lotinų kalbos žodžio „tornare“ ir graikų „tornos“ (tekinis arba apskritimas), reiškiančių jud÷jimą aplink centrinį tašką arba ašį3. Ši reikšm÷ pasikeit÷ anglams prid÷jus priesagą „- izm“ nusakančią „veiksmą ar procesą, tipišką elgesį ar kokybę“, ir priesagą „ist“ reiškiančia „asmenį, atlikusį tokį veiksmą“. Žodis kelion÷ kartu su priesagomis -izmas ir -ist rodo jud÷jimo aplink ratą veiksmą. Apskritimas – tai atspirties taškas, kuris galiausiai grįžta atgal į savo pradžią. Tod÷l, pavyzdžiui, kelionę ratu sudaro keliavimas pirmyn ir atgal, t.y. aktas kai paliekamas pradžios taškas ir grįžtama į jį atgal. Tokia kelion÷ gali būti vadinama turizmu.
Ilgainiui buvo bandoma tiksliai apibr÷žti turizmo sąvoką, tačiau iki šiol n÷ra prieita prie vieningo universalaus turizmo apibr÷žimo. Tod÷l mokslin÷je literatūroje galima sutikti skirtingų požiūrių į turizmo sampratą. Štai keletas jų. Turizmas – tai:
•,,... visuma reiškinių ir santykių, kylančių iš kelionių bei laikino buvimo toje teritorijoje, tol kol tai netampa nuolatine gyvenamąja vieta ir n÷ra susijusi su apmokama veikla” (Šveicarijos profesoriai Hunziker ir Krapf)4;
•„... visumą tarpusavio santykių ir paslaugų, susijusių su laikinu ir savanorišku keliautojo gyvenamosios vietos pakeitimu nekomerciniais ir neprofesiniais tikslais“ (Bernecher)5;
•„... laikinas žmonių išvykimas ir jud÷jimas toli nuo jų nuolatin÷s gyvenamosios bei darbo vietos ir visa veikla, vykdoma šios išvykos metu“ (Wanhill)6;
•„... veikla, apimanti turistų elgseną, išteklių naudojimą ir sąveiką su kitais žmon÷mis, ekonomiką bei aplinka, taip pat fizinį turistų jud÷jimą į kitas teritorijas, kurios n÷ra įprastos jų gyvenimo vietos“ (Witt, Brooke ir Buckley)7;
•„... žmonių veikla, apimanti jų elgseną, išteklių naudojimą ir sąveiką su kitais žmon÷mis, ekonomiką bei aplinką, taip pat fizinį turistų jud÷jimą į kitas teritorijas, kurios n÷ra įprastos jų nuolatinio gyvenimo vietos“(Bull)8.
Skirtingai turizmas apibr÷žiamas ir tarptautinių organizacijų dokumentuose:
•,,...laikinas, trumpalaikis žmonių jud÷jimas iš savo pastovios gyvenamosios vietos į kitas vietoves bei užsi÷mimai šių apsilankymų metu; tai apima visą jud÷jimą, taip pat vienadienius apsilankymus bei ekskursijas” (Didžiosios Britanijos Turizmo Institutas, 1976 m.)9;
•„... viena iš aktyvaus poilsio būdų, kelion÷s siekiant pažinti vienus ar kitus rajonus, naujas šalis, dažnai derinant jas su sporto elementais“ (Pasaulio Turizmo Organizacijos (PTO), 1981 m.)10; •„... visos kelionių, ekskursijų rūšys, kai asmuo palieka savo nuolatinę darbo ir gyvenimo vietą ilgiau nei vienai parai ir trumpiau nei 12 m÷nesių, ir kai išvykos tikslas n÷ra samdoma, apmokama veikla“ (PTO, 1991 m.)11.
Nežiūrint sąvokų skirtumų, galima išskirti pagrindinius aspektus naudojamus turizmui apibr÷žti12:
3
Theobald, William F. Global tourism (2nd ed.). Butterworth–HeinemannOksford [Anglija]: Butterworth-Heinemann , 1998,p.8.
4
Holloway J.C. The Business of Tourism. Harlow: Financial times: Prentice Hall, 2006, p. 4. Jayapalan N. An Introduction to Tourism. New Delhi: Atlantic Publishers and Distributors, 2001, p. 5.
5
Bernecher, P. Fundaments of tourism. Geneva, 1964, p.14. 6
Wanhill, S. Tourism Statistics to 2000. Proceedings of Current Issues in Services Research Conference. Poole, Dorset Institute, 1988, p. 2.
7
• išvykimą iš nuolatin÷s aplinkos;
• laikinumą (laikotarpį iki vienerių metų)13; • veiklą kelion÷s metu;
• kelion÷s tikslą14.
Connell, Stephen, Cooper ir kt.(2006) nurodo, kad, norint paaiškinti terminą ,,įprastin÷ aplinka”, kartais įtraukiama atstumo aplinkyb÷,.
Šie pagrindiniai momentai labiausiai charakterizuoja turizmą ir leidžia išskirti iš kitų ekonomikos sektorių.
Atkreiptinas d÷mesys į tai, kad visuose aukščiau pateiktuose turizmo apibr÷žimuose pasigendama atstumo dimensijos. Tod÷l Holloway (2006) pagrįstai iškelia retorinį klausimą ,,Ar galima turistu vadinti žmogų, kuris tam, kad apsipirktų, iš savo gyvenamosios vietos važiuoja 12 mylių?”15. Turizmo sąvokoje svarbu nubr÷žti ne tik laiko, bet ir atstumo ribas, kas ir buvo bandyta padaryti JAV, Kanadoje ir Jungtin÷je Karalyst÷je, nustatant atitinkamai 50, 25 bei 20 mylių atstumus, kuriuos nuvažiavus, jau galima vadintis turistu. Atstumo reikšmę akcentavo taip pat Mill bei Morrison (1998) pabr÷ždami, kad, nors turizmas visuomet reiškia kelionę, tačiau kelion÷ ne visada gali reikšti turizmą16. Tačiau atstumo klausimas ir toliau išlieka diskusijų objektu, o turizmui apibr÷žti dažniausiai naudojama 1991 metais PTO pasiūlyta sąvoka.
2. Atvykstamasis turizmas Lietuvoje 1993-2010 m.
Masinis turizmas – reliatyviai naujas fenomenas. Nors turizmo atskaitos tašku galima vadinti Anglijoje 1841 m. Thomas Cook suorganizuotą kelionę traukiniu, tačiau istorikai linkę teigti, jog turizmas masiniu reiškiniu tapo tik po Antrojo Pasaulinio karo.
Lietuvoje rinkos santykiais organizuojamo masinio turizmo pradžia sietina su Nepriklausomyb÷s atkūrimu šalyje. Atkūrus Lietuvos nepriklausomybę, pirmaisiais metais analizuojamame sektoriuje mažai kas pasikeit÷, kadangi Lietuvos Respublikos užsienio valstyb÷s vis dar nepripažino, o jos sienas kontroliavo TSRS tarnybos. Tik po 1991 m. rugpjūčio pučo ir TSRS žlugimo Lietuva po daugelio centralizuoto valdymo metų prad÷jo naują rinkos ekonomikos atkūrimo ir raidos etapą. Turizmo sektorių, kaip ir visą privatų šalies ūkį, teko kurti beveik tuščioje vietoje.
Prasid÷jo sparti turizmo įmonių privatizacija, kuriai juridinį pagrindą suteik÷ 1991 m. vasario m÷n. 28 d. Valstybinio turto pirminio privatizavimo įstatymas17. Juo remiantis suskaidytos monopolin÷s turizmo valdymo struktūros, prad÷tos kurti naujos privačios turizmo įmon÷s.
Pirmieji Nepriklausomyb÷s metai pasižym÷jo ryškiu atvykstančių turistų skaičiaus maž÷jimu (1 pav.). Maž÷jo tiek organizuotų grupių, tiek pavienių turistų skaičius, trump÷jo jų praleistas laikas Lietuvoje. Didžiausias turistų skaičiaus sumaž÷jimas stebimas 1995 m., kuomet buvo įvestos vizos NVS šalių piliečiams. Turizmo rinkoje buvo smarkiau jaučiami ankstesnieji ryšiai: tebevyravo turistai iš Rytų (buvusių TSRS) šalių.
12
Connell J., Stephen J. P.Tourism: A Modern Synthesis, Second Edition. London: Thomson Learning, 2006, p. 12.Cooper Chris et al. Tourism: Principles and Practice. Fourth Edition. Harlow: Financial times: Prentice Hall, 2008, p. 12.
13
Nuo 1996 m. turizmo rinka prad÷jo sparčiai atsigauti (1 pav. ir 1 lentel÷). 1999 m. Lietuvą aplank÷ jau beveik 4,5 milijono užsieniečių, iš jų – 1,45 milijono turistų (lankytojų su nakvyne). Pagrindinis lankytojų srautas buvo iš kaimyninių šalių: Rusijos (1,5 mln.), Latvijos (1,2 mln.), Baltarusijos (762 tūkst.), Estijos (319 tūkst. ) ir Lenkijos (179 tūkst.).
1 pav.Užsienio lankytojų skaičiaus kitimo tendencija 1993 – 2001 m. Šaltinis: Lietuvos valstybinis turizmo departamentas, 2002, p. 3
Daugiausia užsienio lankytojų (68,89 %) atvyko kelių transportų, 24,44 % - traukiniais, 3,22 % - naudojosi oro transportu ir tik 1,51 % svečių pasirinko jūrų transportą. Užsieniečių išlaidos Lietuvoje tais metais siek÷ 2,4 milijardus litų, o tai sudaro 14 % viso Lietuvos prekių ir kitų paslaugų eksporto arba 5,6 % BVP.18
Bet 1998–1999 metų Rusijos kriz÷ l÷m÷ atvykstančių užsienio svečių srauto sumaž÷jimą 2000 – 2001 m. Tiesa, jis buvo ženkliai mažesnis lyginant su 1995 m., nes tiek Rusijos, tiek NVS šalių rinka jau nebetur÷jo lemiamo poveikio Lietuvos atvykstamajam turizmui. Pagal atvykusių lankytojų skaičių Rusija užleido vietą Latvijai, daug÷jo svečių iš Vokietijos, Skandinavijos19. Tačiau Vakarų turistų poreikių netenkinanti šalies turizmo infrastruktūra stabd÷ spartesnę atvykstamojo turizmo pl÷trą. D÷l ženkliai prarandamos Rytų rinkos ir silpnai pl÷tojamos Vakarų rinkos atvykstančių užsieniečių srautai maž÷jo ir 2002-2003 m. (1 lentel÷). Tai vert÷ valstybines institucijas ir ypač privačias firmas daugiau orientuotis į Vakarų rinkas organizuojant ne tik išvykstamąjį, bet ir atvykstamąjį turizmą. Būtent po 2000 metų imtasi pertvarkyti visus Lietuvos turizmo sektoriaus elementus. Did÷jant verslo turizmo lyginamajam svoriui ir brangesnio turizmo ekonominio produkto paklausai, sparčiai pl÷tojama viešbučių statyba, didesnį užmojį įgijo kaimo turizmas, imta daugiau rūpintis atvykstančiųjų aptarnavimo kokybe20.
Po įstojimo į Europos Sąjungą, turizmas kartu su kitomis ūkio šakomis išgyveno spartų augimą, kurį lyd÷jo kasmet did÷jantis užsienio lankytojų srautas. Nors statistin÷s apskaitos pasikeitimas 2004-2006 m. neleidžia pratęsti atvykstančiųjų keliautojų skaičiaus kitimo analiz÷s, tačiau, remiantis turimais atvykusių iš trečiųjų šalių piliečių duomenimis, galima konstatuoti apie lankytojų srauto tolesnį did÷jimą (1 lentel÷). Ypač akcentuotini 2006 m., kuomet sulaukta net 11,4 % svečių daugia nei 2005 m. Daug÷jo svečių ir ateinančius dvejus metus. Nežiūrint kasmet did÷jančio užsienio lankytojų skaičiaus, 2008 m. buvo pasiektas tik 1999 m. lygis.