General rights
Copyright and moral rights for the publications made accessible in the public portal are retained by the authors and/or other copyright owners and it is a condition of accessing publications that users recognise and abide by the legal requirements associated with these rights.
Users may download and print one copy of any publication from the public portal for the purpose of private study or research. You may not further distribute the material or use it for any profit-making activity or commercial gain
You may freely distribute the URL identifying the publication in the public portal
If you believe that this document breaches copyright please contact us providing details, and we will remove access to the work immediately and investigate your claim.
Downloaded from orbit.dtu.dk on: Jan 30, 2021
Nanostructured electrodes for high-performance and durable solid oxide cells
Tong, Xiaofeng
Publication date:
2019
Document Version
Publisher's PDF, also known as Version of record
Link back to DTU Orbit
Citation (APA):
Tong, X. (2019). Nanostructured electrodes for high-performance and durable solid oxide cells. Technical University of Denmark.
Nanostructured electrodes for high-performance
and durable solid oxide cells
Xiaofeng Tong
October 2019
Frederiksborgvej 399 DK - 4000 Roskilde Denmark www.energy.dtu.dkAuthor
Xiaofeng Tong
Department of Energy Conversion and Storage
Technical University of Denmark
Main Supervisor
Ming Chen
Senior scientist
Department of Energy Conversion and Storage
Technical University of Denmark
Co-supervisors
Peter Vang Hendriksen
Professor, Head of section
Department of Energy Conversion and Storage
Technical University of Denmark
Simona Ovtar
‡Postdoc
Department of Energy Conversion and Storage
Technical University of Denmark
i
Preface
This thesis is submitted to the Technical University of Denmark as partial fulfillment of the requirements for obtaining the Ph.D. degree. The work was carried out from November 2016 to October 2019 at the Department of Energy Conversion and Storage (DTU Energy), under the main supervision of Senior Scientist Ming Chen, and the co-supervision of Prof. Peter Vang Hendriksen and Dr. Simona Ovtar. The work was partly funded by EUDP through the project “Efficient Power2Gas Combining SOEC and Biomass Gasification” (EUDP no. 64017-0011) and Innovation Fund Denmark through the project “Synfuel” (4106-00006B). The Ph.D. project was also supported by DTU Energy and the China Scholarship Council. A three-month external stay from March 2019 to May 2019 took place at the University of Twente in the group of Prof. Henny J.M. Bouwmeester thanks to the additional funding provided by the Otto Mønsteds Fond.
DTU Risø Campus, Roskilde, October 31, 2019 Xiaofeng Tong
ii
Acknowledgements
I would like to express my sincere gratitude to those who contributed to this thesis and/or supported me in this amazing “journey”.
First and foremost, I would like to thank my principal supervisor Dr. Ming Chen for making it all happen; for picking me up at the airport on the first day; for guiding, supporting, and encouraging me in these three years. In particular, Ming helped a lot with planning the study while also giving me plenty of room to explore. I have really learned and enjoyed under Ming’s supervision.
Similar gratitude shall go to my co-supervisors: Prof. Peter Vang Hendriksen and Dr. Simona Ovtar. Thank Peter for his guidance and support on my experiments, and driving a push to improve English. Peter always gave constructive and comprehensive advice on the manuscripts I sent and made many descriptions more professional and precise. Thank Simona for teaching me how to do experiments hand by hand in the lab especially for infiltration, and providing me an interesting research topic to continue.
Special thanks go to Prof. Anne Hauch, who helped me greatly in many aspects, from teaching me the course of “SOFC and SOEC introduction” at the beginning of my Ph.D. to sharing with me the use of software “Ravdav” for electrochemical data analysis and her expertise in cell degradation analysis based on electrochemical impedance spectroscopy. I would also like to thank Dr. Christopher R. Graves and Dr. Theis Løye Skafte for assistance in using “Ravdav”.
Besides, I thank the following colleagues at DTU for supporting my experiments and for insightful discussions.
• Karen Brodersen, Lene Knudsen, and Yu Xu — for help with cell fabrication. Karen supplied me with half-cells; Lene printed the oxygen electrodes and contact layers for me. Yu synthesized the amazing CGO nanoparticles for me.
iii • Henrik Henriksen, Søren Koch, Mahbooba Davodi, and Jens F. S. Borchsenius — for help with cell testing. Especially Henrik, he supported all of my tests and was always around when I needed help.
• Ebtisam Abdellahi, Janet Jonna Bentzen, and Søren Bredmose Simonsen — for help with microscopy characterization.
• Jette Iversen — for help with Brunauer-Emmett-Teller measurement.
• Dordije Tripkovic — for help with electrical conductivity relaxation measurements.
• Annelise Mikkelsen, June Ruddie, and Henrik Paulsen — for other support in the lab.
• Mogens Bjerg Mogensen, Bhaskar Reddy Sudireddy, Xiufu Sun, Belma Talic, Astri Bjørnetun Haugen — for insightful discussions.
Without their contributions, many of the outcomes in this thesis would not have been achieved.
Many thanks to Prof. Henny J.M. Bouwmeester at the University of Twente for hosting me as a guest for three months and to Jason and Zainab who are very helpful during my staying there.
I would especially like to thank our awesome secretary Heidi Adler Berggren, who greatly helped with the distracting things and enabled me to focus on scientific work. There is always a big smile and encouragement from Heidi every time when she comes by my office. Finally, I owe my deepest thanks to my family; my grandparents for taking care of me when I was a child; my parents for supporting and encouraging me to do what I like even though they have no idea about my research; my beloved wife Yongfang for love, patience, and support, and for joining me from China to Denmark.
v
Abstract
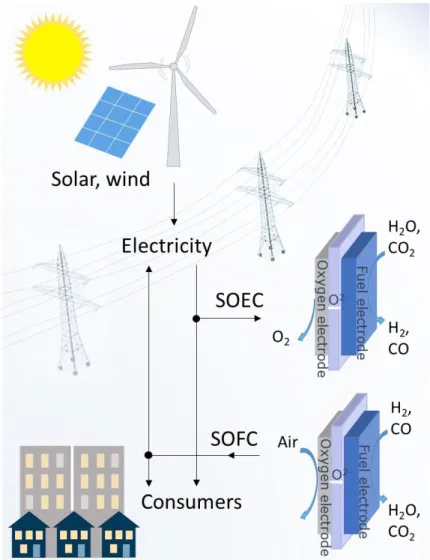
Electrical energy is essential for maintaining our standard of living. The rapid growth in electricity generation from intermittent renewable solar and wind sources creates a need for affordable large-scale energy storage to balance the supply-demand mismatch in the grid. One promising technology to address this energy storage challenge is solid oxide cells (SOCs). They can be operated either in electrolysis mode (as solid oxide electrolysis cells, SOECs) to convert H2O and/or CO2 into H2 and/or CO using renewable electricity, or in
fuel-cell mode (as solid oxide fuel cells, SOFC) to generate electricity on demand using the fuels produced. However, the widespread commercialization of the SOC technologyis still impeded by high cost and insufficient long-term durability. In particular, the technology of operating SOCs in electrolysis mode is less mature, in which the electrodes of SOC cells often suffer from considerable degradation during continuous electrolysis operation.
The focus of this thesis is the development of high-performance and durable SOCs by designing nanostructured electrodes via infiltration. Efforts are devoted to three aspects: i) improving the performance of electrodes for intermediate-temperature (600–750 °C) operation. Operating SOCs at intermediate temperatures can not only provide choice for using cheaper interconnects and seals thus reducing system cost but also avoid some issues related to materials incompatibility and heat management; ii) enhancing the durability of electrodes, particularly for the fuel electrodes during electrolysis operation under high current densities. The high current density enables a high gas production rate and lowers the capital costs; iii) the scale-up of the above progress, which is very important for practical applications. Throughout the thesis, the electrochemical performance and durability of the developed electrodes were mainly evaluated on full cells through electrochemical impedance spectroscopy (EIS), polarization curves, and galvanostatic tests. The analysis of EIS data was performed by fitting with equivalent circuit model using complex-nonlinear-least-squares (CNLS) regression and calculating the distribution of relaxation time (DRT). First, different from most studies on infiltrated SOCs carried out on button cells with a small active area, 12.5 × 12.5 cm2 fuel-electrode-supported SOCs with La0.6Sr0.4CoO3-δ
vi
electrochemical performance of the resulting SOCs was examined at 4 × 4 cm2 level (active area). The cell delivered favorable performance at 750 °C under high gas/steam utilization, e.g., a power density of 1.08 W cm−2 at 0.6 V in fuel cell mode and a current density of −1.07 A cm-2 at 1.3 V in electrolysis mode. These results highlight the potential of using infiltration to produce large-size, high-performance SOCs. However, the cell showed significant degradation when operated at −0.5 A cm-2 for steam electrolysis, and the major degradation
was found to be from the Ni/ yttria-stabilized zirconia (YSZ) fuel electrode.
The Ni/YSZ electrode is the most commonly used and best-performing fuel electrode in SOCs, while its degradation during electrolysis operation has been an ongoing challenge. Secondly, in order to enhance the durability of Ni/YSZ electrode, an approach of surface modification of the Ni/YSZ electrode by coating nano-sized CGO electrocatalysts via infiltration was developed. After modification, the cell durability was dramatically improved, reducing degradation rate from 0.565 to 0.024 V kh-1, when tested at −1.00 A cm-2 and 750 °C for steam electrolysis. The mechanisms of the Ni/YSZ electrode degradation and of the mitigation via surface modification at these conditions were discussed and speculated. To enable a sufficient porosity in the Ni/YSZ electrode structure for infiltration and to avoid the chemical expansion of the CGO barrier layer and the decomposition of oxygen electrode material during reduction, the full cell was pre-reduced with a “two-atmosphere-reduction”, i.e., the fuel electrode side was exposed to reducing atmosphere while the oxygen electrode was exposed to air. This was achieved using an in-house built test rig which is well suited for the purpose if only a small number of cells is considered, but not well suited for mass production. To fit the upscaling requirement, the aforementioned infiltration approach was further simplified by replacing the complicated “two-atmosphere-reduction” procedure with a facile “one-atmosphere-reduction”, which can well be carried out in furnace during the cooling of the cell after the final sintering step.
Finally, considering that cobalt-containing materials often suffer from various issues when employed as oxygen electrodes, a nanoengineered La0.6Sr0.4FeO3–δ (LSF)-based
oxygen electrode was developed by applying a nanoporous hybrid catalyst coating composed of nanoparticles of CGO and PrOx. Different from the conventional infiltration with a
precursor of metal nitrate, here a mixture solution of colloidal CGO nanocrystals and Pr(NO3)3 was used for infiltration to enable this designed nanoengineered architecture. The
vii
demonstrated for both fuel-cell and electrolysis operation. In particular, when applying this oxygen electrode on a CGO-modified Ni/YSZ fuel-electrode-supported cell, stable operation at 650 °C under −0.5 A cm-2 with cell voltage close to 1.3 V was achieved. The results
achieved in this thesis demonstrate the great potential of boosting the performance and durability of SOCs via surface modification with nano electrocatalysts.
viii
Papers included in the thesis
Paper I. Large-area Reversible Planar Solid Oxide Cells with La0.6Sr0.4CoO3-δ Infiltrated
Oxygen Electrodes for Electricity Generation and Hydrogen Production
Xiaofeng Tong, Simona Ovtar, Karen Brodersen, Peter Vang Hendriksen, Ming Chen As manuscript to be submitted
Paper II. A 4 × 4 cm2 Nano-Engineered Solid Oxide Electrolysis Cell for Efficient and Durable Hydrogen Production
Xiaofeng Tong, Simona Ovtar, Karen Brodersen, Peter Vang Hendriksen, Ming Chen ACS Appl. Mater. Interfaces, 2019,11, 29, 25996-26004
Paper III. Development of Solid Oxide Electrolysis Cells for Hydrogen Production at High Current Densities
Xiaofeng Tong, Peter Vang Hendriksen, Anne Hauch, Ming Chen ECS Transactions 91.1 (2019): 2433-2442.
Paper IV. A Scalable, Infiltration-Based Approach to Improving the Durability of Ni/YSZ Electrodes for Solid Oxide Cells
Xiaofeng Tong, Peter Vang Hendriksen, Anne Hauch, Xiufu Sun, Ming Chen As manuscript to be submitted
Paper V. Promotion of Oxygen Reduction and Evolution by Applying a Nanoengineered Hybrid Catalyst on Cobalt free Electrodes for Solid Oxide Cells
Xiaofeng Tong, Yu Xu, Dordije Tripkovic, Peter Vang Hendriksen, Wolff-Ragnar Kiebach, Ming Chen
ix
Contents
Preface ... i
Acknowledgements ... ii
Abstract ... v
Papers included in the thesis ... viii
Contents ... ix
Chapter 1 Introduction ... 1
1.1 Motivation ... 1
1.2 Solid oxide cells ... 3
1.3 Infiltration in SOCs ... 7
1.4 Electrochemical impedance spectroscopy ... 8
1.5 Objective and scope of the thesis ... 13
Chapter 2 Solid oxide cells with La0.6Sr0.4CoO3-δ infiltrated oxygen electrodes for electricity generation and hydrogen production 21
Abstract ... 21
2.1 Introduction... 21
2.2 Experimental ... 24
2.3 Results and discussion ... 26
2.4 Conclusion ... 38
Supplementary information ... 39
Chapter 3 Nanoengineered solid oxide electrolysis cells for efficient and durable hydrogen production 41
Abstract ... 41
3.1 Introduction... 41
3.2 Results and discussion ... 44
3.3 Conclusion ... 58
3.4 Experimental ... 58
x
Chapter 4 An up-scalable, infiltration-based approach for improving the durability
of Ni/YSZ electrodes for solid oxide cells 71
Abstract ... 71
4.1 Introduction... 72
4.2 Experimental ... 74
4.3 Results and discussion ... 75
4.4 Conclusion ... 89
Chapter 5 Promotion of oxygen reduction and evolution by applying a nanoengineered hybrid catalyst on cobalt free electrodes for solid oxide cells 91
Abstract ... 91
5.1 Introduction... 92
5.2 Results and discussion ... 94
5.3 Conclusion ... 106
5.4 Experimental ... 107
Supplementary information ... 110
Chapter 6 Conclusion and outlook 113
6.1 Conclusion ... 113
6.2 Outlook ... 115
CHAPTER
1
Introduction
1.1 Motivation
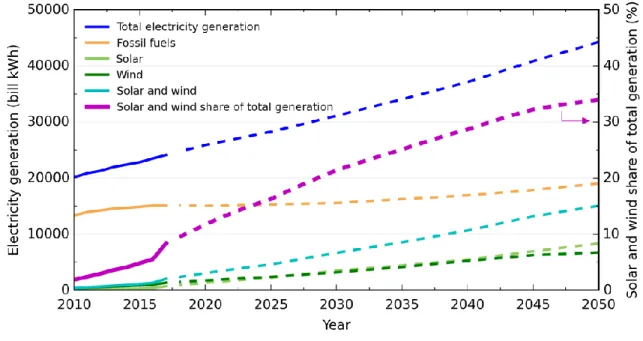
Electrical energy is essential for maintaining our standard of living. The global electricity generation has increased by ~20% from 20,131 billion kWh in 2010 to 24,104 billion kWh in 2017, with more than 60 % of electricity generated from fossil fuels (Figure 1.1). [1] This ongoing domination of fossil fuels in global electricity generation has contributed significantly to global greenhouse gas emissions. For example, considering only the coal-fired electricity generation, it is responsible for ~30% of global CO2 emissions in 2018,
reported by International Energy Agency. [2] The depletion of fossil fuels and the climate changes related to greenhouse gas emissions drives a transition towards fossil-free electricity generation, in which renewable energy sources such as solar and wind are expected to play an important role. As a result, the share of solar and wind-based renewables generation increased from ~6 % in 2016 to ~8 % in 2017, and it is expected to further increase to 34% in 2050. In particular, share of electricity from solar and wind energy achieved high levels in several countries in 2018, e.g., Denmark (51%), Uruguay (36%), Ireland (29%), Germany (26%) and Portugal (24%). [3]
It has been widely recognized that with the rising share of electricity generation from intermittent renewable solar and wind sources, affordable large-scale energy storage will be needed to balance the supply-demand mismatch in the grid. [4] Currently, world's total installed energy storage capacity is only 166.6 GW. More than 96% (160 GW) of capacity is provided by pumped-hydro, which can not be available widely due to the site-specific characteristic. [3] The rest of ~ 4 % is provided by electrochemical storage and thermal storage. Among the electrochemical storage, ~3 GW is provided by batteries, which are suited for short-term (e.g., hourly or daily) energy storage but less suited for longer-term
Chapter 1
2
(e.g., seasonal).[3, 5] Therefore, a variety of other energy storage technologies are under development.
Figure 1.1: Global electricity generation, 2010-2050. Solid lines are the actual production quantities and dash lines are projections. Replotted from the International Energy Outlook 2019 database. [1]
As a promising technology to address the seasonal energy storage challenge, reversible solid oxide cells (SOCs) have received increasing attention in recent years. [5-8] They can be operated either in electrolysis mode (as solid oxide electrolysis cells, SOECs) to convert H2O and/or CO2 into H2 and/or CO using excess renewable electricity, or in fuel-cell mode
(as solid oxide fuel cells, SOFC) to generate electricity on demand using the fuels produced (Figure 1.2). [5, 9] Additionally, the produced H2 and CO can be catalytically converted
using well-known processes to produce easily storable fuels such as methanol and gasoline for the transportation sector. [10, 11] Compared to other electrochemical cells operated at low temperatures (typically 50–100 °C) such as alkaline electrochemical cells (AECs) and polymer electrolyte membrane cells (PEMCs), SOCs possess several attractive advantages
because of their elevated operating temperatures (typically 600–900 °C). For example, when operated as electrolysis cells, high-temperature SOEC operation enables high efficiency at high fuel production rate. Besides, high operating temperature avoids using noble metal based catalysts (as for PEMCs) and enables utilizing a variety of waste heat sources. Despite these advantages, the commercialization of SOC technology is still impeded by high cost
1.2 Solid oxide cells
3
and insufficient long-term durability. In particular, the development of SOCs for SOEC operation is much less mature than for SOFC operation.
Figure 1.2: Schematic of the renewable electricity storage system based on solid oxide cells (SOCs).
1.2 Solid oxide cells
1.2.1 Principle of SOCs
A basic SOC cell consists of porous fuel and oxygen electrodes, separated by a dense,oxide ion conducting electrolyte (Figure 1.2). Yttria-stabilized zirconia (YSZ) is the most common electrolyte material; scandia-stabilized zirconia (SSZ), gadolinia-doped ceria (CGO or GDC) and perovskite structure oxides of strontium- and magnesium-doped lanthanum gallate
Chapter 1
4
(LSGM) have also been investigated as electrolyte materials. [12] The principle of a reversible SOC operating on H2O, O2, H2 for either producing fuel or generating electricity
can be described in generic terms as equation (1.1).
In SOEC mode, when the required potential is applied, H2O molecules are split into H2
and oxygen anions (O2−) at the fuel electrode, and then oxygen anions pass through the electrolyte toward the oxygen electrode where they are subsequently oxidized to O2. The
reactions in the fuel and oxygen electrodes can be expressed as:
Fuel electrode: 𝐻2𝑂 + 2𝑒− → 𝐻2+ 𝑂2− (denoted as hydrogen evolution reaction, HER)
(1.2)
Oxygen electrode: 𝑂2−→1
2𝑂2+ 2𝑒
− (denoted as oxygen evolution reaction, OER) (1.3)
In SOFC mode, O2 molecules are reduced to O2− anions at the oxygen electrode, and then
O2− anions pass through the electrolyte to the fuel electrode, where H2 molecules are
oxidized by these O2− anions and the electrons are released, thus generating electricity. The reactions in the fuel and oxygen electrodes are reversed as compared to those in SOEC operation, and can be expressed as:
Fuel electrode: 𝐻2 + 𝑂2−→ 𝐻2𝑂 + 2𝑒− (denoted as hydrogen oxidation reaction, HOR)
(1.4)
Oxygen electrode: 1
2𝑂2+ 2𝑒
− → 𝑂2− (denoted as oxygen reduction reaction, OER) (1.5)
1.2.2 Oxygen electrode materials
The most studied oxygen electrodes in SOCs are based on strontium-doped lanthanum manganite (LSM). These LSM-based electrodes have been reported with poor activity for both ORR and OER, limited by the pure electronic conducting nature of the LSM. Though LSM is usually mixed with YSZ to form a composite LSM/YSZ electrode, the cells with
𝐻2O ⇌ 𝐻2+ 1 2𝑂2
SOEC (electricity to fuel)
SOFC (fuel to electricity)
1.2 Solid oxide cells
5
such LSM/YSZ electrodes still require high operation temperatures (≥850 °C) to achieve applicable performance. As shown in Table 1.1 (Page 15), when operated in SOEC mode, ~ −1.00 A cm−2 is almost the highest reported current density for such cells at 1.3 V and 850 °C, and they have only limited performance below 800 °C. This high operating temperature results in several serious barriers for the practical application of SOC technology, such as high system and operating costs, as well as materials compatibility challenges. [13]
Beyond this performance limitation, the LSM-based electrodes also suffer from significant degradation when operated at high current densities in SOEC mode. For example, on a cell with a LSM/YSZ oxygen electrode, Graves et al. [7] reported a degradation rate of 0.952 V kh-1 for a 420 h testing period at −1 A cm-2 (the cell voltage increased from 1.33 V to 1.73 V, corresponding to an efficiency decrease from 96% to 75%). For a similar cell, even at −0.7 A cm-2, Hartvigsen et al. [14] found an increase in the cell resistance from 0.50 to 0.62 Ω cm2 for 300 h operation, corresponding to a cell voltage increase of approximately 20 % kh-1. Regarding the degradation phenomena, a microstructural deterioration near the LSM/YSZ electrode – YSZ electrolyte interface, associated with cavity formation in the vicinity of the interface, oxidation of manganese ions and formation of manganese cation vacancies at LSM grains, has been reported [7, 15-22]. Graves et al. [7] found that this microstructural damage can be eliminated by using a reversible cycle with periods of 1 h in SOEC mode and 5 h in SOFC mode, but such a cycle does not fit the flexibility required for practical applications.
During the past decades, substantial efforts have been made in developing alternative oxygen electrode materials, leading to a shift from the electronic conducting LSM to mixed ionic-electronic conductors (MIECs). In particular, many cobalt-containing perovskite-type oxides, such as La0.6Sr0.4Co0.2Fe0.8O3−δ (LSCF) [23, 24], La0.6Sr0.4CoO3−δ (LSC) [25],
Sm0.5Sr0.5CoO3-δ (SSC) [26], Ba0.5Sr0.5Co0.8Fe0.2O3−δ (BSCF) [27], and
PrBa0.5Sr0.5Co1.5Fe0.5O5+δ (PBSCF) [28], have been developed, and showed favorable
catalytic activity at intermediate temperatures (Table 1.2, Page 16). For example, a peak power density of 1.05 W cm-2 in SOFC mode and a current density of −0.90 A cm-2 at 1.3 V in SOEC mode were reported on a cell with LSCF/gadolinia-doped ceria (CGO) composite electrode at 750 °C. [29] However, these cobalt-containing materials often suffer from
Chapter 1
6
various problems, such as large thermal expansion mismatch with commonly used electrolytes, chemical instability for long-term operation and the volatility and diffusivity of cobalt during the high-temperature sintering process causing various cell fabrication issues.[30-32] For example, electrode performance degradation has been observed on LSCF electrode due to Sr segregation near surfaces or interfaces, attributed to the electrostatic attraction of the negatively charged A-site dopants by the positively charged oxygen vacancies enriched on the surface. [30, 33] There have also been numerous reports on using Ruddlesden-Popper type oxides such as Ln2NiO4+δ (Ln = La, Nd, Pr) as oxygen electrode
materials. [34-38] However, these Ruddlesden-Popper materials can be unstable under SOEC operation, which causes the degradation of electrodes. [38] For instance, the decomposition of La2NiO4+δ to high-order Ruddlesden-Popper La3Ni2O7+δ and La4Ni3O10+δ
oxides has been reported during polarization at −500 mA cm−2 and 750 °C in SOEC mode. [38]
1.2.3 Fuel electrode materials
The most studied fuel electrode in SOCs is Ni/yttria-stabilized zirconia (YSZ) composite, which displays excellent activity for both the hydrogen oxidation reaction (HOR) in SOFC mode and hydrogen evolution reaction (HER) in SOEC mode. This Ni/YSZ electrode is now used successfully for SOFC operation with not only good performance but also satisfactory durability by a number of developers. However, the Ni/YSZ electrode experiences considerable degradation during continuous SOEC operation, particularly at high current densities. For state-of-the-art SOCs, with a configuration of the Ni/YSZ support | Ni/YSZ fuel electrode | YSZ electrolyte | CGO barrier layer | LSCF/CGO oxygen electrode, a degradation rate of 0.006 V kh-1 was observed during SOFC operation at 1 A cm2 and 800 °C, while more than one order of magnitude higher degradation rate of 0.105 V kh-1 was observed during SOEC operation under same conditions but at −1 A cm2. [39] Furthermore, even high degradation rate of 0.713 V kh-1 was reported at higher current density of −1.25
A cm2. [40] Regarding the degradation phenomena on Ni/YSZ electrodes, several different
microstructural deteriorations have been reported, including poisoning by impurities, Ni coarsening and migration, destruction of the Ni–YSZ interface, and even formation of ZrO2 nanoparticles on the Ni surface due to the reduction of YSZ. [41-52] In addition,
1.2 Solid oxide cells
7
poisoning by silica containg impurities at the triple-phase boundaries (TPBs) of the Ni/YSZ electrode has also been reported. [6, 52]
Though MIEC oxides, such as LaxSr1-xCr0.5Mn0.5O3–δ, [53-55] La0.2Sr0.8TiO3+δ, [56]
La0.4Sr0.4Ni0.06Ti0.94O3-δ, [57] La0.43Ca0.37Ni0.06Ti0.94O3–δ, [58] and Sr2Fe1.5Mo0.5O6-δ, [59, 60]
have been explored as alternative fuel electrodes, the catalytic activity and electrical conductivity of these MIEC electrodes have not reached the levels observed for those of the Ni/YSZ electrodes, as shown in Table 1.3 (Page 17). Accordingly, Ni/YSZ is still the most commonly used fuel electrode material, and it is thus important to enhance the durability of Ni/YSZ electrodes. Recently, Hauch et al. demonstrated that the Ni migration in Ni/YSZ electrode during SOEC operation can be effectively mitigated by a microstructure optimization, reducing the cell degradation rate from ∼0.250 V kh-1 to ∼0.060 V kh-1 when
operating at −1 A cm-2 and 800 °C. [44] However, further improvement in durability is required for the practical application.
1.3 Infiltration in SOCs
Infiltration, also known as impregnation, is a promising approach for preparing high-performance, nanostructured electrodes for SOCs. [61-63] As is schematically shown in
Figure 1.3, an infiltration process generally involves three steps: i) preparation of porous electrode backbone, ii) injecting a liquid solution containing the stoichiometric metal salt precursors into the porous backbone, and iii) heat treatment to form desired active phases. [62, 63]
Chapter 1
8
The mostly reported infiltration strategy is infiltration of MIEC electrode materials into electrolyte-based backbones such as YSZ, CGO, and LSGM. [64-75] This infiltration strategy offers several advantages in comparison with the conventional screen-printing technique which requires a high sintering temperature (typically ≥1000 °C) to make a strong bonding between electrolyte and electrode. First, the heat treatment in the infiltration process is generally performed at relatively low temperatures (typically 300–800 °C), issues of chemical compatibility such as detrimental chemical reactions and interdiffusion of MIEC electrode materials with electrolytes can be effectively avoided or significantly reduced. Furthermore, the nanostructure enabled by low-temperature heat treatment can effectively improve the catalytic activity of infiltrated electrodes. Thirdly, the issue of thermal expansion mismatch between the electrolyte and the MIEC electrode materials could also be mitigated because the MIEC catalysts are now deposited on the backbone as the form of nanoparticles.
Another strategy is surface modification of electrode with catalytically-active nanoparticles/coating via infiltration, which has received increasing attention in recent years. [76-81] This surface modification has been reported as an effective approach that can enhance not only the performance of electrodes but also the durability. For example, by modifying LSCF/CGO composite electrode with SSC nano-catalysts, the cell showed an improvement of peak power density from 1.05 to 1.62 W cm-2 in fuel cell mode and an
increase in current density from −0.9 to −1.80 A cm-2 at 1.3 V in electrolysis mode [29]. A multi-phase catalyst coating not only dramatically reduced the Rp from 2.57 Ω cm2 (for bare
LSCF) to 0.312 Ω cm2 at 600 °C but also enhanced the durability by suppressing surface Sr
segregation. [79]
1.4 Electrochemical impedance spectroscopy
Electrochemical impedance spectroscopy (EIS) is a powerful technique for SOC diagnosis. It can be used for not only evaluation of cell performance but also understanding of cell
1.4 Electrochemical impedance spectroscopy
9
degradation mechanisms occurring during operation. The EIS principle and data analysis methods will be outlined briefly in the coming text.
1.4.1 EIS principle
Impedance can be defined as a complex resistance. EIS is measured by applying a small excitation to the cell and measuring its response. As shown inFigure 1.4, if a sinusoidal potential signal, E(t) = E0 sin(ωt), is applied for exciting a linear time-invariant (LTI) circuit system, the response to this potential will be a current response, I(t) = I0 sin(ωt + φ). This
I(t) has the same frequency (f) as E(t) but a shifted phase (φ). ω is the radial frequency and the relationship between ω and f is ω = 2πf.
Figure 1.4: Sinusoidal Current Response in a Linear System. Reprinted from ref. [82] Hence, analogous to Ohm’s Law, the impedance is defined as the complex number Z with the expression:
𝑍 =𝐸(𝑡) 𝐼(𝑡) =
𝐸0 sin(ωt)
𝐼0 sin(ωt + φ) (1.6)
Based on Euler's relationship, exp(jφ) = cosφ + jsinφ, Z can be further expressed as follows: [83]
Chapter 1
10
𝑍 = 𝑍0exp(jφ) = 𝑍0(cosφ + jsinφ) = 𝑍𝑅 + 𝑗𝑍𝐼𝑚 (1.7)
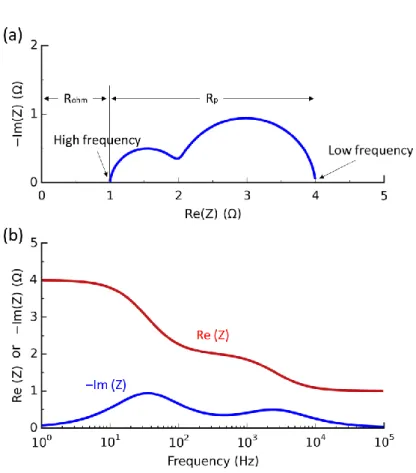
Where ZR denotes the real part and ZIm denotes the imaginary part. j is defined as j2 = −1. In SOC studies, the EIS measurement is usually realized by applying AC sinusoidal signals with amplitudes of a few mV or mA in a frequency range of 0.01 Hz to 1.0 MHz. The two most common ways of presenting the EIS data are Nyquist plot and Bode plot shown in Figure 1.5. In the Nyquist plot, the intercept with the real axis at high frequency represents the ohmic resistance (Rohm), and the difference between the high and low frequency
intercepts represents the total electrode polarization resistance (Rp).
Figure 1.5: (a) Nyquist and (b) Bode plots of EIS data.
1.4.2 EIS analysis methods
EIS analysis is commonly performed by fitting the data with an equivalent circuit model using complex-nonlinear-least-squares (CNLS) regression. The electrical elements used in EIS analysis can be classified into lumped elements (including inductance, resistance, and capacitance) and frequency-dependent elements (including constant-phase element,
1.4 Electrochemical impedance spectroscopy
11
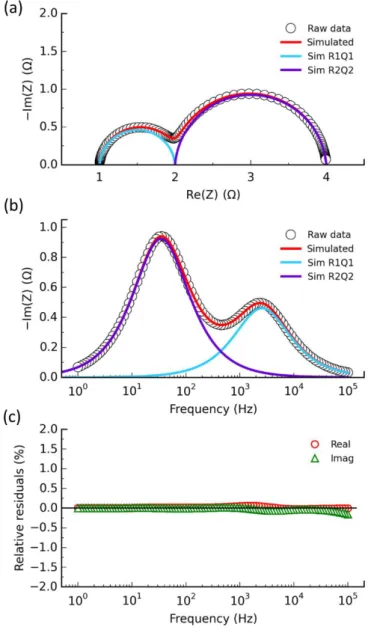
Warburg element, Gerisher element, etc… ). [83] The equivalent circuit models usually consist of a number of electrical elements in series and/or in parallel, and the models are set based on the physical and chemical processes in the system studied. Thus, the different contributions to impedance can be distinguished. A typical example of impedance fitting is shown in Figure 1.6, where the impedance spectrum is fitted with an equivalent circuit model named L-R0-R1Q1-R2Q2, consisting of an inductor (L) in series with a resistor and in
series with two circuits of a resistor in parallel with a constant phase element (Q). The fitting error is shown in Figure 1.6c, where low relative residuals and a non-systematic variance are desired.
Figure 1.6: An example of impedance fitting. (a) Nyquist, (b) Bode, and (d) relative residual plots.
Chapter 1
12
Distribution of relaxation time (DRT) is another powerful tool for deconvoluting complex impedance data. Ideally, the relation between the impedance Z(𝜔) and the distribution function of relaxation times (𝛾(𝜏)) could be given by a convolution equation as follows: [84, 85] 𝑍(𝜔) = 𝑅0+ 𝑍𝑝𝑜𝑙(𝜔) = 𝑅0+ 𝑅𝑝𝑜𝑙∫ 𝛾(𝜏) 1+𝑗𝜔𝜏 ∞ 0 𝑑𝜏 (1.8) with ∫ 𝛾(𝜏)0∞ 𝑑𝜏 = 1
where 𝑍(𝜔) is the impedance data, 𝑅0 is the ohmic resistance, 𝑍pol(𝜔) is the polarization part of the impedance, and 𝑅pol is the polarization resistance. The mathematical problem with this approach arises from the inversion of equation 1.8. First, impedance spectra are recorded over a limited frequency range in practical measurements and thus the convolution equation cannot be solved analytically. Furthermore, erroneous results are obtained with the inversion due to the large amplification of experimental errors. This inversion problem has been well controlled by extrapolating the original data to artificially enlarge the frequency range and applying digital filters to the Fourier transforms to reduce noise. Further theoretical background on DRT is described elsewhere. [84, 85]
To illustrate this method, the impedance spectrum shown in Figure 1.5 was examined by DRT calculation. The result is shown in Figure 1.7, where the impedance response is clearly separated into two peaks at their characteristic frequencies. In DRT plots, the peaks are corresponding to the specific physical or chemical processes in the studied system. [84] Thus, DRT analysis is often used as a pre-identification tool to build a suitable equivalent circuit model for CNLS fitting. [44, 86]
1.5 Objective and scope of the thesis
13
Figure 1.7: An example of DRT plot
1.5 Objective and scope of the thesis
As outlined in this chapter, though the SOC technology has shown potential in energy storage and conversion, the widespread commercialization of this technology is still impeded by high cost and insufficient lifetime. One of the key components determining the performance and reliability of SOCs is the electrodes. The objective of this thesis is to develop cost-effective SOC electrodes with sufficiently high electro-catalytic activity and durability at intermediate temperatures (600–750 °C). The study is based on the use of infiltration to fabricate nanostructured electrodes. The scale-up of the developed electrodes is also considered. Throughout the thesis, electrochemical characterization including electrochemical impedance spectroscopy (EIS), polarization curves, galvanostatic tests, and electrical conductivity relaxation (ECR) are employed. The analysis of EIS data is performed by fitting with equivalent circuit model using complex-nonlinear-least-squares (CNLS) regression and calculating the distribution of relaxation time (DRT). Other characterization techniques include scanning electron microscope (SEM), transmission electron microscopy (TEM), X-ray diffraction (XRD), and Brunauer-Emmett-Teller (BET) for measuring specific surface area. The results are divided into four chapters.
Chapter 1
14
The results in Chapter 2 highlight the potential of using infiltration to produce large-size, high-performance SOCs. In contrast to most of the previous studies on infiltrated SOCs carried out on button cells with a small active area, 12.5 × 12.5 cm2 fuel-electrode-supported SOCs with La0.6Sr0.4CoO3-δ (LSC) infiltrated gadolinia-doped ceria (CGO) oxygen
electrodes were prepared in this work. The electrochemical performance and durability of the resulting SOCs were examined at 4 × 4 cm2 level (active area).
The Ni/YSZ composite is the most commonly used fuel electrode in SOCs, and it often suffers from significant degradation during continuous electrolysis operation. To address this technical obstacle, in Chapter 3, an effective approach of surface modification of the Ni/YSZ electrode by coating nano-sized CGO electrocatalysts via infiltration was developed. The mechanisms of the Ni/YSZ electrode degradation and of the mitigation via surface modification at these conditions were discussed and speculated. Note that before infiltration the full cell needs to be pre-reduced with a “two-atmosphere-reduction”, i.e., the fuel electrode side is exposed to reducing atmosphere while the oxygen electrode is exposed to air. This was achieved using an in-house built test rig. Afterwards, in Chapter 4, the aforementioned infiltration approach was further simplified to fit the upscaling requirement by replacing the complicated “two-atmosphere-reduction” procedure with a facile “one-atmosphere-reduction”, which can be carried out during sintering of the cell.
Considering that cobalt-containing materials often suffer from various problems when employed as oxygen electrodes, in Chapter 5, a highly active and robust La0.6Sr0.4FeO3–δ
(LSF)-based oxygen electrode was developed by applying a nanoporous hybrid catalyst coating composed of nanoparticles of CGO and PrOx. The resulting hybrid-catalyst-coated
LSF electrode was investigated for both fuel-cell and electrolysis operation. Combining with the progress in the fuel electrode achieved in Chapter 3, a cell with this oxygen electrode and the CGO-modified Ni/YSZ fuel electrode was developed and investigated.
Chapter 1
15
Table 1.1 Performance of Ni/YSZ fuel-electrode supported SOECs with the conventional LSM/YSZ oxygen electrodes. Rp represents the total polarization resistance of the cell.
Cell configuration Gas supplied to the fuel electrode Temperature (˚C) Electrolysis current density at 1.3 V (A cm-2) Rp (Ω cm2) Ref. Ni/YSZ|YSZ|LSM/YSZ 50%H2O-50%H2 750 0.50 [87] 850 1.00 Ni/YSZ|YSZ| LSM/YSZ 50%H2O-10%H2 -40%N2 950 0.9 [88] 895 0.75 820 0.58 750 0.35 Ni/YSZ|YSZ|LSM/YSZ 50%H2O-50%H2 800 0.3 [89] Ni/YSZ|YSZ|LSM/YSZ 50%H2O-50%H2 900 0.58 0.44 [90] 800 0.35 1.0 Ni/YSZ|YSZ| LSM/YSZ 54%H2O-23%H2 -23%N2 850 0.5 [91] 800 0.33 750 0.22 700 0.1
Chapter 1
16
Table 1.2 Performance of Ni/YSZ fuel electrode supported SOECs with screen-printed MIEC oxygen electrodes. Rp represents the total polarization resistance of the cell.
Cell configuration Gas supplied to the fuel electrode
Tempera -ture (˚C) Electrolysis current density at 1.3 V (A cm-2) Rp (Ω cm2) Ref . Ni/YSZ|YSZ|SDC|LSFCN 50%H2O-50%H2 800 1.04 [92] 750 0.85 Ni/YSZ|YSZ|CGO|LSCF/CGO 50%H2O-50%H2 800 0.99 [93] Ni/YSZ|YSZ|CGO|LSCF/CGO 50%H2O-50%H2 750 0.9 0.21 (1.2 V) [29] Ni/YSZ|YSZ|CGO|LSCF/CGO 50%H2O-50%H2 800 1.3 (1.25 V) [94] Ni/YSZ|YSZ|CGO|LSC/CGO 50%H2O-50%H2 800 1.28 (1.25 V) [94] Ni/YSZ|YSZ|CGO|LSCF/CGO 50%H2O-50%H2 800 0.85 0.15 [23] 750 0.58 0.22 700 0.3 Ni/YSZ|YSZ|CGO/PNO|PNO 50%H2O-50%H2 800 0.8 [34] 700 0.26 Ni/YSZ|YSZ|NNO/YSZ 50%H2O-50%H2 800 0.585 [95] 700 0.38 Ni/YSZ|YSZ|CGO|STFC-07 50%H2O-50%H2 700 1.48 0.115 [96] Ni/YSZ|YSZ|CGO| SCFG 40%H2O-H2-N2 850 1.15 [97] 800 0.75 La0.5Sr0.5Fe0.8Cu0.15Nb0.05O3−δ (LSFCN), Ce0.9Gd0.1O1.95 (CGO), La0.6Sr0.4Co0.2Fe0.8O3−δ (LSCF),
La0.6Sr0.4CoO3−δ (LSC), Pr2NiO4+δ (PNO), Nd2NiO4+δ (NNO), SrTi0.3Fe0.63Co0.07O3−δ (STFC-07),
Chapter 1
17
Table 1.3 Performance of SOECs with oxide fuel electrodes instead of the Ni/YSZ. Rp
represents the total polarization resistance of the cell. Cell configuration Gas supplied to
the fuel electrode
Temperature (˚C) Electrolysis current density at 1.3 V (A cm-2) Rp (Ω cm2) Ref. CMF|LSGM|BLC 20%H2O-1%H2 -79%Ar 900 1.00 [98] 800 0.35 700 0.10 PBM|LSGM|LDC| PBSCF50/CGO 10%H2O-90%H2 750 0.81 0.118 [28] 700 0.52 0.161
LSNT |YSZ| LSM/YSZ 47%H2O-53%N2 900 0.13
[57] 800 0.05
LST |YSZ| LSM/YSZ 47%H2O-53%N2 900 0.05 1.4 [99]
SFM| LSGM|SFM 20%H2O-80%H2 900 0.38 [100] 850 0.36 800 0.33 40%H2O-60%H2 900 0.59 850 0.54 800 0.48 K-PSCFN– CFA|LSGM|BCFN 20%H2O-80%H2 800 0.6 0.54 [101] LSCM-Pd-CZY-YSZ|YSZ| YSZ-LSF 10%H2O-90%H2 700 0.4 0.19 [102]
Chapter 1
18
SFM-YSZ |YSZ| LSM/YSZ 10%H2O-90%H2 800 1.12 0.230 [60]
SFM/SDC|LCO|LSGM|SDC/ LSCF 42%H2O-58%H2 850 0.64 0.44 [59] SFMNi/SDC|LCO|LSGM|S DC/LSCF 42%H2O-58%H2 800 0.838 [59] 750 0.511 700 0.269 LSF|LSGM|BLC 20%H2O-1%H2 -79%Ar 800 0.59 0.4 [103] 700 0.21
PSTF|SDC|YSZ|LSM/YSZ 20%H2O-H2-Ar 800 0.13 0.8 [104]
40%H2O-H2-Ar 0.16 0.75
60%H2O-H2-Ar 0.20 1.1
LSCM/YSZ |YSZ| LSM/YSZ La0.75Sr0.25Cr0.5Mn0.5O3−δ (LS CM) 25%H2O 900 0.55 [105] 850 0.40 800 0.30 0.9 80%H2O 900 0.72 850 0.59 800 0.43 1.5
LSCM/YSZ |YSZ| LSM/YSZ 60%H2O 900 0.327 [55]
850 0.280 800 0.177 20% H2O 850 0.18
Chapter 1 19 LSCM| YbScSZ | LSCM 50%H2O-N2 850 0.21 [106] Ce0.6Mn0.3Fe0.1O2-δ (CMF), La0.9Sr0.1Ga0.8Mg0.2O3-δ (LSGM), Ba0.6La0.4CoO3-δ (BLC), PrBaMn2O5+δ (PBM), PrBa0.5Sr0.5Co1.5Fe0.5O5+δ (PBSCF50), La0.4Ce0.6O2- (LDC), Sr2Fe1.5Mo0.5O6−δ (SFM), Sr2Fe1.3Ni0.2Mo0.5O6 (SFMNi), La0.8Sr0.2FeO3−δ (LSF),
Ba0.6La0.4CoO3−δ (BLC), Pr0.8Sr1.2(Co,Fe)0.8Nb0.2O4+δ (K-PSCFN), Co–Fe alloy (CFA),
Ba0.9Co0.7Fe0.2Nb0.1O3−δ (BCFN), La0.8Sr0.2FeO3-δ (LSF), La0.8Sr0.2Cr0.5Mn0.5O3-δ (LSCM),
Ce0.48Zr0.48Y0.04O2-δ (CZY), Pr0.3Sr0.7Ti0.3Fe0.7O3−δ (PSTF), SrTiO3+δ (ST), La0.3Sr0.7TiO3+δ (LST),
Chapter 1
21
CHAPTER
2
Solid oxide cells with La
0.6
Sr
0.4
CoO
3-
δ
infiltrated
oxygen electrodes for electricity generation
and hydrogen production
Abstract
Infiltration is an effective way to improve the performance of the oxygen electrode for solid
oxide cells (SOCs). Most studies on infiltrated SOCs are carried out on button cells with a small active area. Here, we report on the preparation of 12.5 × 12.5 cm2
fuel-electrode-supported SOCs with a La0.6Sr0.4CoO3-δ (LSC) infiltrated gadolinia-doped ceria (CGO)
oxygen electrode. The electrochemical performance of the resulting SOCs is examined at 4 × 4 cm2 level (active area). The cell delivers a power density of 1.08 W cm−2 at 0.6 V and
750 °C in fuel cell mode with high fuel and oxygen utilization of 52 and 57 %, respectively; in electrolysis mode, the current density reaches 1.07 A cm-2 at 1.3 V and 750 °C with a
steam utilization of 60%. Additionally, the influence of feed gas composition on cell performance and the short-term durability of the cell in electrolysis mode are studied. Electrochemical impedance spectroscopy (EIS) results and the post-test microstructural characterization demonstrate that there is no visible degradation of the LSC infiltrated CGO oxygen electrode after the durability test. These results highlight the potential of large-scale production of high-performance SOCs by designing nanostructured electrode via infiltration.
2.1 Introduction
Affordable large-scale energy storage is essential for a sustainable energy future with a rising share of solar and wind-based intermittent electricity generation [107]. Solid oxide cells
Chapter 2
22
(SOCs) is a promising technology in this context. They can be operated either in electrolysis mode to convert surplus electricity from these renewable sources into chemical energy stored in various fuels such as H2 and/or CO, or in fuel cell mode to generate electricity using the
fuels produced [6, 7, 9]. One of the key factors limiting the performance of SOCs is the rate of the oxygen electrode reaction processes, i.e., the oxygen reduction reaction (ORR) in fuel cell mode and the oxygen evolution reaction (OER) in electrolysis mode, particularly at temperatures ≤ 750 °C. The most well studied oxygen electrode material is strontium-doped lanthanum manganite (LSM)/yttria-stabilized zirconia (YSZ) composite. However, SOCs with LSM/YSZ electrodes have limited performance at reduced temperatures; at 750 °C, most such cells were reported to show power densities of 0.3-0.65 W cm−2 at a voltage of 0.7 V in fuel cell mode and current densities of 0.2-0.5 A cm−2 at 1.3 V in electrolysis mode [87, 88, 91, 108, 109].
Accordingly, mixed ionic-electronic conducting (MIEC) oxides, such as La0.6Sr0.4Co0.2Fe0.8O3−δ (LSCF) [23, 24], La0.6Sr0.4CoO3−δ (LSC) [25], Sm0.5Sr0.5CoO3-δ (SSC)
[26], Ba0.5Sr0.5Co0.8Fe0.2O3−δ (BSCF) [27], PrBa0.5Sr0.5Co1.5Fe0.5O5+δ (PBSCF) [28],
Pr2NiO4+δ (PNO) [34] and Pr6O11 [110] have been employed as alternative oxygen electrode
materials, resulting in improved performance. Solution infiltration, also known as impregnation, has drawn increasing interests for preparing these MIEC type electrodes [62, 63, 70, 71]. In the infiltration process the active electrocatalysts are introduced into a porous backbone at relatively low temperatures. Typically, the maximum firing temperature for the infiltrated electrode is now the temperature of cell operation. Issues of chemical reactivity and thermal expansion mismatch of such MIEC oxides with the other cell components can be alleviated. The resulting electrodes with nano-scale catalysts have shown improved catalytic activity for the ORR/OER. For example, a power density of 0.78 W cm-2 at 0.7 V in fuel cell mode and a current density of 0.98 A cm-2 at 1.3 V in electrolysis mode were reported on a cell with LSCF infiltrated YSZ oxygen electrode at 750 °C [111]. Even better performance was reported on a cell using LSCF/gadolinia-doped ceria (CGO) composite electrode infiltrated with SSC nano-catalysts, exhibiting a power density of 1.39 W cm-2 at
0.7 V in fuel cell mode and a current density of 1.80 A cm-2 at 1.3 V in electrolysis mode
[29].
However, most reports of infiltrated SOCs were carried out on laboratory-scale button size cells with active areas less than 2 cm2. The performance of such button cells does not
2.1 Introduction
23
necessarily represent the performance of corresponding large-area, commercially relevant cells due to complexities related to the scale up of the manufacture and the influence of operating conditions such as increased gas utilization and non-isothermal operation. There have been only limited reports of successful manufacture of large-area cells using infiltration. In one exception, Jiang et al. reported a fuel-electrode-supported planar SOC with an active area of 9 × 9 cm2 and an LSCF infiltrated YSZ oxygen electrode [112]. This SOC was investigated for fuel cell operation, displaying a power density of 0.42 W cm-2 at
0.7 V and 750 °C. More recently, we have developed two types of fuel-electrode-supported SOCs in size of 13 × 13 cm2 with either an LSC infiltrated YSZ oxygen electrode or a LaNi0.6Co0.4O3-δ (LNC) infiltrated YSZ oxygen electrode and evaluated their performance
for fuel cell operation at 4 × 4 cm2 level (active area) [113]. Even though a CGO coating was infiltrated into the YSZ backbone prior to infiltrating LNC electrocatalysts, the formation of poorly conducting zirconate phases (La2Zr2O7 or SrZrO3) at the interface between the
electrocatalyst and YSZ backbone (where the CGO covering is not complete) was observed for 1300 h operation in fuel cell mode at 700 °C, 0.5 A cm−2.
In this chapter, 12.5 × 12.5 cm2 fuel-electrode-supported half cells with porous CGO backbones at the oxide electrode side are produced by scalable and cost-effective processes of tape-casting, lamination, and co-sintering, and then an LSC precursor solution is infiltrated into the CGO backbones to prepare nanostructured LSC-CGO oxygen electrode. A CGO backbone is applied instead of YSZ as CGO has good chemical compatibility with most of the preferred perovskite electrocatalysts (including LSC) and higher ionic conductivity than YSZ. The prepared planar SOCs are investigated at 4 × 4 cm2 level (active area) both in fuel cell mode and electrolysis mode. The durability of the cell in the electrolysis mode is investigated under a constant current density of 0.5 A cm-2 at 750 °C
Chapter 2
24
2.2 Experimental
2.2.1 Cell preparation
The 12.5 × 12.5 cm2 fuel-electrode-supported cells with a configuration NiO/YSZ
support | NiO/YSZ fuel electrode | YSZ electrolyte | CGO barrier | CGO backbone were produced by laminating and co-sintering tape-cast green tapes at 1315 °C. The green tapes of NiO/YSZ support, NiO/YSZ fuel electrode and CGO backbone were prepared by single layer tape-casting while tapes of YSZ electrolyte and CGO barrier were prepared via a multilayer tape casting (MTC) process. The CGO backbone tape was prepared with the addition of 60-70 % pyrolyseable pore former in the tape-cast slurry to obtain sufficient porosity after sintering. The volume ratio of Ni to YSZ in the Ni/YSZ support and electrode was controlled to be 40/60 after the reduction of NiO. Afterwards, LSC catalyst was coated on the internal surfaces of the porous CGO backbone via the infiltration technique. Specifically, 0.5 M LSC nitrate solution containing La(NO3)3, Sr(NO3)2, and Co(NO3)3 in a molar ratio of 3:2:5 was dropped onto the surface of the CGO backbone. The solution sucked into the pores of the backbone driven by capillary forces. Note that the surfactant Pluoronic® P123 (1.7 wt.%) was added into the nitrate solution to improve wetting/penetration of the structure [113]. The infiltrated samples were then calcinated at
350 °C in air for 15 min. The infiltration/calcination processes were repeated 9 times to get a loading of ∼1300 mg of LSC catalysts per 1 cm3 CGO scaffold. After the infiltration, the
cells were cut into pieces of 5.3 × 5.3 cm2 to fit the in-house constructed cell test houses. Finally, an LSC layer in size of 4 × 4 cm2 was screen printed onto the oxygen electrode to enhance the current collection.
2.2.2 Electrochemical characterization
The electrochemical performance and durability of the prepared cells were investigated using in-house constructed test rigs. In each test, a cell was mounted onto an alumina housing and sealed with a gold frame, as described in previous work [114]. The cells were heated to 800 °C with a heating rate of 1 °C min-1 and with pure Ar fed to the fuel electrode and dry air to the oxygen electrode. Afterwards, the cells were held at 800 °C for 4 h with the fuel
2.2 Experimental
25
electrode first fed with 9%H2-91%Ar for 2 h, followed by another 2 h in 4%H2O-96%H2 to fully reduce all NiO to Ni and form a percolating network. Meanwhile, the oxygen electrode was treated with air to enable the infiltrates to form the desired LSC crystalline phase. The electrochemical performance of the cells was evaluated at 800–700 °C under varying gas feeds to the electrodes, but the flow rates of gases in the fuel and oxygen electrodes were kept at 24 l h-1 and 50 l h-1, respectively. Electrochemical impedance spectroscopy (EIS) measurements were conducted using a Solartron 1255 frequency response analyzer in combination with a measurement resistor, at frequencies from 0.0968 to 96850 Hz with an amplitude of 3.75 mA cm-2. The durability of the cell was evaluated in electrolysis mode at 750 °C under a constant current density of 0.5 A cm-2, with 13.4 l h-1 90%H
2O-10%H2 fed to the fuel electrode and 50 l h-1 pure O
2 to the oxygen electrode. EIS data were recorded
every 20 h during the durability test under the current of 0.5 A cm−2. All of EIS data analyses were carried out using the Python-based software Ravdav [115].
2.2.3 Microstructure characterization
The cell structure was examined using scanning electron microscopy (SEM) in a Zeiss Merlin microscope. Both polished and fractured cross-sections of the cells were prepared for SEM characterization, corresponding to the SEM micrographs shown in Figure 2.1 and
Figure 2.8, respectively. SEM image analysis was carried out with ImageJ software. In order to check the phase composition of the infiltrates deposited on the CGO backbone, powders synthesized by calcinating the above LSC infiltrate solution at 800 °C for 4 h were examined at room temperature using X-ray diffraction (XRD, Bruker D8 Rigaku, CuKα radiation) with
Chapter 2
26
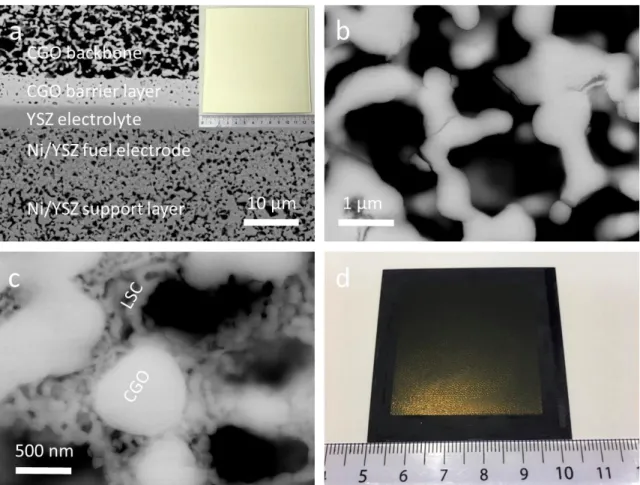
Figure 2.1: Cross-sectional SEM images of (a) a fuel electrode-supported cell prior to the infiltration of LSC (inset showing the photograph of this cell in size of 12.5 × 12.5 cm2), (b) porous CGO backbone, and (c) CGO backbone infiltrated with LSC catalysts. (d) Photograph showing the as-prepared planar cell for testing.
2.3 Results and discussion
2.3.1. Microstructure
Figure 2.1a and Figure 2.S1 show the typical cross-sectional SEM micrographs of the fuel-electrode-supported cell prior to infiltration of LSC catalysts. The cell consists of a Ni/YSZ support (∼300 µm), a Ni/YSZ fuel electrode (∼15 µm), a YSZ electrolyte (∼5 µm), a CGO barrier layer (∼6 µm), and a porous CGO backbone (∼25 µm). There is good adherence between different layers as no obvious delamination or crack is observed. The
2.3 Results and discussion
27
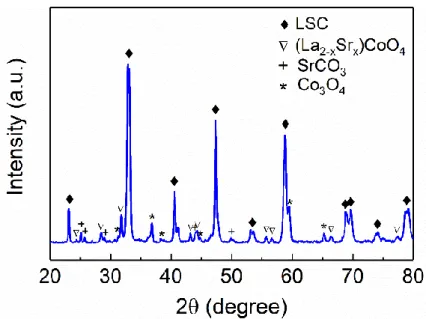
YSZ electrolyte is fully dense while some closed pores are observed in the CGO barrier layer. The CGO backbone for infiltration has a uniform porous microstructure with a porosity of ∼55 % and an average pore size of ∼1.3 µm, estimated based on counting black and gray pixels of the micrograph, which refer to pores and CGO grains, respectively (Figure 2.1a and 1b). The LSC infiltrated CGO oxygen electrode is prepared by infiltration of LSC catalysts and calcination at 800 °C, and its micrograph is shown in Figure 2.1c, where the interconnected and nanoporous LSC coatings are well deposited on the internal surfaces of the porous CGO backbone. Formation of LSC in the coatings is confirmed by XRD pattern of powders, synthesized by calcinating the infiltrate solution at 800 °C (Figure 2.2). Note that some second phases including (La2-xSrx)CoO4, SrCO3, and Co3O4, are also observed in the LSC catalysts. Similar secondary phases of LSC infiltration have also been reported by Samson et al. [74]. Figure 2.1d shows a photograph of the as-prepared planar cell that has been cut into the size of 5.3×5.3 cm2, with a screen-printed 4×4 cm2 LSC contact layer on top of the LSC infiltrated CGO oxygen electrode.
Chapter 2
28
2.3.2. Electrochemical performance
The electrochemical performance of the as-prepared cells was evaluated both in fuel cell mode and electrolysis mode. The active area of the cells is 4×4 cm2 (the edges are used for sealing, as described in Experimental). Figure 2.3a shows typical polarization curves of cell voltage and power density versus current density (I-V-P curves) of fuel cell operation, measured at 700−800 °C with 4%H2O-96%H2 fed to the fuel electrode and dry air to the
oxygen electrode. The open circuit voltages (OCVs) range between 1.050 V at 800 °C and 1.069 V at 700 °C, and are within 35 mV off the calculated Nernst potentials. Under a voltage output of 0.6 V, the cell delivers power densities of 1.34, 1.08, and 0.70 W cm−2 at 800, 750, and 700 °C, respectively. Unlike most of the previous SOC studies, in which the power densities are reported on button cells with active areas less than 2 cm2 and gas utilization
lower than 10 %, the here-reported power densities are accompanied with significant fuel and oxygen utilization, e.g., 65 and 71 % at 800 °C, 52 and 57 % at 750 °C, and 34 and 37 % at 700 °C, respectively (Figure 2.2b). A high gas utilization is required for practical applications and leads to lower power out than with negligible utilization due to the loss of Nernst potential along the fuel flow. The effect of fuel utilization on cell performance was further illustrated by feeding H2O-H2 mixtures with varying H2O to H2 ratios. The OCV
decreases from 1.060 to 0.947 V with decreasing H2 content from 96% to 50% in accordance
with the Nernst equation (Figure 2.3c). At a voltage of 0.6 V, power densities decrease from 1.08 to 0.78 W cm−2, corresponding to a fuel utilization of 52 % and 72 %, respectively (Figure 2.3d).
2.3 Results and discussion
29
Figure 2.3: Performance in fuel cell mode. Voltage and power density versus current density measured (a) at different temperatures with 4%H2O-96%H2 fed to the fuel electrode and dry
air to the oxygen electrode, and (c) at 750 °C with different H2O-H2 gas mixtures fed to the
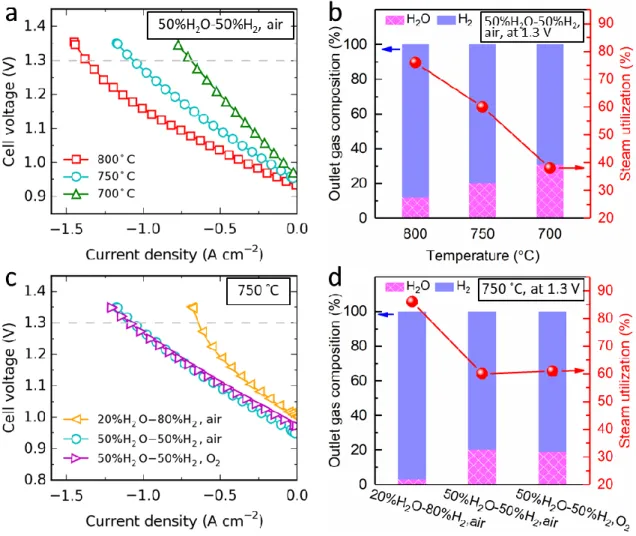
fuel electrode and dry air to the oxygen electrode. (b, d) Corresponding fuel utilization and oxygen utilization at an operating voltage of 0.6 V on the performance shown in (a) and (c). Figure 2.4a shows the voltage versus current density (I-V) curves in electrolysis mode for H2 production, measured at 700−800 °C with 50%H2O-50%H2 fed to the fuel electrode
and dry air to the oxygen electrode. The OCVs at different temperatures are all within 10 mV of the calculated Nernst potentials. At an electrolysis voltage of 1.3 V, current densities of 1.37, 1.07, and 0.69 A cm-2 are obtained at 800, 750, and 700 °C, respectively, which correspond to the H2 production rates of 9.53, 7.45, and 4.80 ml min-1 cm-2, respectively,
calculated using Faraday's law. These H2 production rates are achieved with steam utilization
of 76 %, 60%, and 38%, respectively, and the hydrogen content in the outlet gas reaches 88 %, 80%, and 69%.At 800 °C, a significantly nonlinear increase in the voltage at high current densities is observed, which is attributed to the effect of growing concentration
Chapter 2
30
polarization because of the steam starvation in the fuel electrode under high steam utilization [94, 116].
Figure 2.4: Performance in electrolysis cell mode. Voltage versus current density measured (a) at different temperatures with 50%H2O-50%H2 fed to the fuel electrode and dry air to the
oxygen electrode, and (c) at 750 °C with varying gas feeds to the electrodes. (b, d) Corresponding gas composition at the outlet and overall steam utilization at an operating potential of 1.3 V on the performance shown in (a) and (c).
The electrolysis performance was also investigated under different gas feeds to the fuel and oxygen electrodes at 750 °C. As shown in Figure 2.4c, increasing the H2O content from
20 % to 50 % leads to a decrease in OCV of 54 mV. The cell exhibits a current density of 0.64 A cm-2 at 1.3 V with 20%H2O-80%H2 fed to the fuel electrode. This performance is
strongly limited by the concentration polarization due to the high steam utilization of 86 %, and the corresponding hydrogen content in the outlet gas is as high as 97% (Figure 2.4d).
2.3 Results and discussion
31
By increasing H2O content to 50%, the concentration polarization is significantly reduced,
resulting in an increase in current density of 67 % (i.e., 0.43 A cm-2) at 1.3 V. Figure 2.4c
also shows that the OCV increases 25 mV when the gas in the oxygen electrode is changed from air to pure O2, and the current density at 1.3 V has a slight increase of 2 % (i.e., 0.02 A
cm-2). Hence, the decreased driving force due to the increased OCV is fully compensated for
by improved electrode performance in pure O2. One should note that in principle for
technical use, O2 purge at the oxygen electrode is not likely to be a preferred mode of
operation. Either no purge should be applied – “oxygen production mode” or for safety reasons steam, CO2 or N2 purge could be considered depending on whether the produced
oxygen will be used or discarded. The results show that electrolysis performance is more sensitive to the H2O content in the fuel electrode and the corresponding steam utilization and
less sensitive to the oxygen content in the oxygen electrode, as expected both from the relative thickness of the electrodes and the form of the Nernst expression.
Figures 2.5a-e showthe Nyquist plots of EIS data recorded under OCV condition in the temperature range of 700−800 °C with different gas feeds. The intercept with the real axis at high frequency in the Nyquist plot represents the ohmic resistance (Rohm), and the difference
between the high and low frequency intercepts represents the total electrode polarization resistance (Rp). Rohm is almost unaltered with the change of gas feeds, and they are around
0.11, 0.16, and 0.25 Ω cm2 at 800, 750, and 700 °C, respectively. These Rohm are much
greater than the expected resistances for 5 μm thick YSZ electrolyte and 6 μm thick CGO barrier here. At 700 °C, the observed Rohm of 0.25 Ω cm2 is 5 times the expected (∼0.05 Ω
cm2) based upon the ionic conductivities of 0.02 S cm−1 for YSZ and 0.03 S cm−1 for CGO [117]. This can be attributed to the interdiffusion of elements at the YSZ electrolyte – CGO barrier interface during the co-sintering process at 1315 °C leading to the formation of solid solution phases with lower ionic conductivity [118-120]. Furthermore, Rohm actually
constitute 29−40 % and 56−60 % of the overall resistances of the EIS data shown in Figures 2.5a and 5c, respectively. These results suggest that there is room for further improvement of the cell performance by limiting the YSZ – CGO inter-diffusion via, e.g., lowering the sintering temperature, or more preferably sintering the half-cell (NiO/YSZ support | NiO/YSZ fuel electrode | YSZ electrolyte) first and then sintering CGO barrier and porous CGO layer at lower temperature, such as 1200 °C.
Chapter 2
32
For 4%H2O-96%H2 fed to the fuel electrode and air to the oxygen electrode, the Rp values
are 0.26, 0.30, and 0.38 Ω cm2 at 800, 750, and 700 °C, respectively (Figure 2.5a). These Rp values are lower than those of our previously reported Ni/YSZ fuel electrode supported
cell with a thin YSZ electrolyte, a CGO barrier layer applied by pulsed vapor deposition (PVD), and a screen printed LSC/CGO oxygen electrode [47], showing Rp values of 0.44 Ω
cm2 at 750 °C and 0.59 Ω cm2 at 700 °C under same gas conditions (Figure 2.S2). The Rp
values are also lower than many of those previously reported for other cells with Ni/YSZ fuel electrodes and using different oxygen electrodes, e.g., 0.43 Ω cm2 at 750 °C for the
commonly used LSCF/CGO composite [29], 0.78 Ω cm2 at 700 °C for SSC infiltrated YSZ [121], and 0.44 Ω cm2 at 700 °C for LaNi0.6Co0.4O3-δ (LNC) infiltrated YSZ [122].
Furthermore, the Rp values are comparable to those reported recently for high-performance
cells using Sm0.5Sr0.5CoO3-δ (SSC) infiltrated LSCF/CGO composite (e.g., 0.28 Ω cm2 at
750 °C) [29] and SrTi0.3Fe0.63Co0.07O3−δ (e.g., 0.27 Ω cm2 at 750 °C) [96]. With increasing
the H2O content from 4 % to 50 %, the Rp decreases pronouncedly at corresponding
temperatures (Figures 2.5c and 5e), to 0.09, 0.12, and 0.18 Ω cm2, respectively. The observed Rp of 0.18 Ω cm2 at 700 °C is also lower than those reported for Ni/YSZ
fuel-electrode-supported cells using different oxygen electrodes under the same condition, including LSCF/CGO composite (0.33 Ω cm2) [23], SSC infiltrated YSZ (0.66 Ω cm2) [121],
Nd2NiO4+δ (NNO) infiltrated Zr0.88Sc0.22Ce0.01O2.11 (SSZ) (0.51 Ω cm2) [123], and LSCF
infiltrated YSZ (0.20 Ω cm2) [111]. These EIS results demonstrate the high performance of
the LSC infiltrated CGO oxygen electrode, and that this electrode is very suitable for the purpose.
To clarify the type of electrode processes and their contributions to Rp, the method based
on calculating the distribution function of relaxation times (DRT) was applied in the EIS analysis. Figures 2.5b, 5d, and 5f show the DRT plots calculated from the EIS data shown in Figures 2.5a, 5c, and 5e, respectively. These DRT plots have a set of five distinct peaks denoted P1 to P5 from high to low frequency. Each peak represents an electrode process, and its integral area is a measure of the resistance of that process.
2.3 Results and discussion
33
Figure 2.5: Nyquist plots of EIS data recorded under OCV (a) at different temperatures with 4%H2O-96%H2 fed to the fuel electrode and dry air to the oxygen electrode, (c) at different
temperatures with 50%H2O-50%H2 fed to the fuel electrode and dry air to the oxygen
electrode, and (e) at 750 °C with varying gas feeds to the electrodes. (b, d, f) Corresponding DRT plots of EIS data shown in (a), (c) and (e).
Evidently from Figures 2.5b and 5d the processes associated with P1 to P3 are characterized by a pronounced thermal activation while P4 and P5 are not sensitive to temperature. This strongly indicates that P1 to P3 correspond to the chemical and electrochemical processes in the electrodes and P4 and P5 are related to gas diffusion and conversion [124]. Figure 2.5f shows that P2, P4, and P5 are very sensitive to the ratio of H2O to H2 in the fuel electrode compartment while they are almost independent of gas
![Figure 1.4: Sinusoidal Current Response in a Linear System. Reprinted from ref. [82]](https://thumb-us.123doks.com/thumbv2/123dok_us/9865445.2876171/22.893.238.712.261.828/figure-sinusoidal-current-response-linear-reprinted-ref.webp)