Water Reuse for
Agricultural Processing:
A Community Case
Study
August 2012
By:
Prepared by:
Short Elliott Hendrickson Inc. 3535 Vadnais Center Drive Saint Paul, MN 55110-5196 651.490.2000
Table of Contents
Page 1.0 Abstract ... 4 2.0 Introduction ... 5 2.1 Study Objective ... 5 2.2 Background ... 62.3 Related Project Studies ... 6
3.0 Water Use Evaluation Approach ... 6
3.1 Conduct Water Audit... 7
3.2 Prepare Plan of Action and Implementation... 7
3.3 Track Results and Publicize Success ... 8
4.0 Public Resources and Utilities ... 8
4.1 Water Utility ... 8
4.2 Wastewater Utility ... 9
4.3 Recycled Water Utility ... 11
4.4 Electric Utility ... 12
5.0 Water Sustainability Opportunities ... 12
5.1 Industrial Water Sustainability ... 12
5.1.1 Understanding the Industries... 13
5.1.2 Industrial Water Sustainability Strategies ... 14
5.2 Recycled Water Use within the City ... 16
5.2.1 Industrial Recycled Water Use ... 17
5.2.2 Other Recycled Water Uses ... 18
5.2.3 Wastewater Treatment Facility In-Plant Uses ... 18
6.0 Summary and Outcomes... 19
6.1 Sustainability Options... 19 6.2 Driver Summary ... 20 6.3 Optimum Option ... 20 6.4 Outcomes ... 21 7.0 References ... 22 8.0 Introduction ... 25 9.0 Wastewater Volumes ... 25
10.0 Water Reduction Opportunities ... 27
10.1 Clean-in-Place Water Use ... 28
10.2 Cooling ... 29
10.3 Water Softener Regeneration ... 30
10.4 Hosedrops ... 30
10.5 Pump Seal Water ... 30
10.7 Summary ... 31
11.0 Costs to Implement Reduction Opportunities ... 32
11.1 Conservation and Education ... 32
11.2 Additional Polished Water Use ... 33
11.3 Polished Water Treatment to Potable-Quality Water ... 34
11.4 Summary ... 35
12.0 References ... 35
List of Tables
Table 1 Summary of Water Use ... 8Table 2 Summary of Wastewater Flows and Loads... 10
Table 3 Summary of Water-Related Demands and Costs ... 13
Table 4 Summary of Industrial Water-Sustainability Strategies and Costs ... 15
List of Appendices
Appendix A: Industry #1 AnalysisPrepared for Agricultural Utilization Research Institute
1.0
Abstract
Water sustainable solutions require communities to broaden planning boundaries and look toward partnerships to achieve economic and resource protection goals. This case study looks specifically at one Midwest rural community. This community, like many rural
communities, has more industrial than domestic water demand and wastewater discharges. While each community has a unique composition of municipal and industrial water and wastewater systems, there are common elements that can be summarized to serve as a model for planning future improvements to meet private and public entity economic goals and provide for the community’s sustainability.
The approach taken in this study was to evaluate the water balance for the community and identify opportunities for water reuse. The case study community is represented by a municipality providing water supply and wastewater treatment services and two nearby industries. Water-sustainable opportunities include process changes that reduce and reuse water at industrial facilities, modifications at municipal wastewater treatment facilities, and use of treated municipal wastewater for non-potable water uses at the industries or in the community.
Based on the conceptual costs developed for six water sustainability practices, the most feasible alternative for this community is for one of the industries to maximize use of reclaimed process water within their own facility. This will reduce the wastewater
discharged to the municipal wastewater treatment plant, which provides the municipality capacity that can be allocated to other customers. The additional capacity can be used to attract new industries to the area or allow other expansion. To avoid rate increases and possibly offset the industry’s savings through water reuse, the municipal revenue lost from potable water sales and reduced treatment services must be replaced with new customers. This community case study involves a municipality with a low-cost, groundwater supply and adequate capacity in their water infrastructure systems. The two industries are dairy-based and net water producers with high-quality water requirements. For other communities and industries looking to implement water sustainability practices, the following circumstances would improve the economic viability: limited supply of adequate quality water,
infrastructure capacity limitations, water demands that do not need a high-degree of treatment, inclusion of other existing or future industries with a year-round consistent source of water, and a longer planning horizon to account for future infrastructure replacement costs and water regulations.
2.0
Introduction
The Agricultural Utilization Research Institute (AURI) recognizes the value of reclaimed water for the agricultural processing industry. AURI has directed funding to study reclaimed water use for industry and this case study is a continuation of this effort to understand and explore the possibilities and potential benefits of water reuse at industrial facilities.
This case study looks specifically at one rural community in Minnesota. This community, like many rural Minnesota communities, has more industrial than domestic water demand and wastewater discharges. While each community has a unique composition of municipal and industrial water and wastewater systems, there are common elements that can be
summarized to serve as a model for planning future improvements to meet overall economic goals for the community as a whole, both private and public entities. These common elements, and the focus of this case study, involve water sustainability practices. For this community and others like it, it is important to evaluate the water balance for the community, rather than plan water supply and wastewater systems
separately for municipal and industrial facilities. Opportunities include process changes that reduce and reuse water and pollutant loads at industrial facilities, modifications at municipal wastewater treatment facilities, and use of treated municipal wastewater for non-potable water uses at the industries or in the community.
2.1 Study Objective
The purpose of the study is to determine alternatives to reduce overall water use at multiple facilities while achieving a cost-effective plan for overall wastewater treatment and water supply. The study is intended to provide:
List of information required to evaluate water sustainability practices.
Documentation of questions and planning activities for water sustainability projects. Concept plan for water sustainability for two case-study industries.
Evaluation of proposed water sustainability improvements for the municipal wastewater treatment facility in terms of capacity and costs.
Industry return on investment and related benefits from a water sustainability plan. This study utilizes a case-study approach to demonstrate the potential synergy between public and private entities related to water resources. The study is focused on a specific rural community in Minnesota, which is presented as a “generic” community with local agricultural processing industries.
2.2 Background
AURI has partnered with a specific rural community, herein referred to as “City”, to conduct the study and use data specific to the City and its local industries. The City has a population of approximately 3,500. The City provides wastewater treatment for the
residential/commercial sector, and also provides treatment for three significant industries, including dairy industries. This community was selected because its industries contribute approximately 80 percent of the wastewater volume and portions of the City’s Wastewater Treatment Facility (WWTF) are approaching hydraulic capacity.
The City is completing a wastewater treatment facility (WWTF) planning process to evaluate the facility’s capacity. This is an opportune time to evaluate water use and pollutant
loadings at the municipal and industrial facilities to identify reduced water use practices and the most cost-effective treatment for the collective facilities.
This study evaluates water use at two of the three significant industries, herein referred to as Industry #1 and Industry #2, with the objective to determine if water sustainability practices could alleviate some of the municipality’s capacity concerns. This report describes the water sustainability opportunities identified and describes how the changes could benefit the industries, as well as the City.
2.3 Related Project Studies
AURI contacted the Metropolitan Council Environmental Services (MCES), St. Paul, Minnesota, to coordinate efforts for a water reuse study focused on the agricultural processing community. MCES completed a study on the feasibility of industrial water reuse in Minnesota [MCES, 2007] and AURI was looking to build on the efforts in this study. MCES and AURI funded two studies completed by Craddock Consulting Engineers in June 2009. Reclaimed Water for Agricultural Processing, Technical Memorandum 1
Ethanol Facility Water Reuse Case Study, Technical Memorandum 2
The first document provides an overview of water reuse in Minnesota with specific
applications and considerations for agricultural processing facilities. The second document provides a planning level analysis of facilities and operation and maintenance (O&M) requirements to supply reclaimed water to an ethanol facility for cooling water use. The analysis identifies the basic project elements that need to be evaluated to technically implement a project.
3.0
Water Use Evaluation Approach
There are four main steps to implement a water conservation/reuse plan and water sustainability projects:
1. Establish support, goals, and resources. 2. Conduct water audit.
3. Prepare plan of action and implementation. 4. Track results and publicize success.
This study was intended to focus on the steps 1, 2 and part of 3.
The first step in a water use evaluation involves establishing support, goals, and resources. This first step has been completed with AURI’s assistance and the participation of willing industries.
3.1 Conduct Water Audit
The second step in a water conservation/reuse plan is to complete a water audit. The purpose of the water audit is to understand where water enters the facility, where it leaves the facility, what water quality is required, and what water quality is discharged. The water audit also documents locations where water efficiency practices are already in place. To complete the water audit, SEH met with staff at each of the two industries to learn about the industrial process and water use within the facility. Following the initial meeting, an email summarizing a list of water needs was submitted to each industry. This was followed up with several conversations and emails with additional information.
For most industrial water use evaluations, it is important to obtain the following information:
Process schematic.
Water balance schematic identifying all water-using equipment and demands. Wastewater discharge permits and significant industrial agreements.
Pretreatment reports showing average, minimum, and maximum flows.
Pretreatment reports showing effluent water quality, possibly including biological oxygen demand (BOD), total suspended solids (TSS), total phosphorus (P), ammonia, total kjeldahl nitrogen (TKN), metals, total dissolved solids (TDS), chlorides, sulfate, hardness, anions/cations, and total coliform/E.coli.
Future flow projections. Historic records of water use. Potable water quality.
Potable water supply and treatment process.
Information on water use including locations of water meters and wastewater meters. Utility rates (water, wastewater, electricity, natural gas).
Staffing information (number of employees, number of shifts).
After reviewing the available information, a facility survey should be completed. For this study, plant staff were consulted to answer questions that would typically be answered with a facility survey. The facility survey objectives are to observe how water is used, where it may be used excessively, calibrate flow meters, note hours of operation for all water-using equipment, and consult with employees using equipment.
After the facility survey, an audit summary can be compiled. The audit summary serves as the baseline for water use. It summarizes the primary water uses and is compiled in such a way that can be viewed annually or monthly for comparison. The audit summary should include water costs. Depending on the industry, it may be useful to calculate the water used per unit of production.
3.2 Prepare Plan of Action and Implementation
The plan of action should summarize opportunities to implement water conservation measures and describe the benefits, challenges, cost savings, and implementation costs of each measure. The actions should be prioritized, and key staff identified to lead the implementation.
3.3 Track Results and Publicize Success
Results of implemented water conservation measures should be compared back with the baseline audit results to quantify savings. The successes should be acknowledged and awarded.
4.0
Public Resources and Utilities
To consider water use and the impact sustainable water practices can have on the industry and the City, it is important to understand the public resources and utilities and any capacity issues that may exist. For this particular case study, the City provides water and wastewater services to its 3,500 residents, commercial entities, and three significant industrial users. 4.1 Water Utility
Important questions to ask a municipality about its potable water system when looking at water sustainability opportunities at a community level include:
1. Are there any water supply limitations?
2. Are there any capacity concerns with the potable water treatment, distribution, or storage systems?
3. What are the treatment costs per 1,000 gallons of water? Would a reduction in water use have a significant impact on operations and maintenance costs of the water system?
The City’s water supply comes from five groundwater wells and is stored in two 1-million gallon water towers. The City pumps an average of 1.7 to 2.5 million gallons of water per day. The City distinguishes water users as residential, commercial, or industrial customers. Approximately 80 percent of the water used within the City is for industrial customers, as shown in Table 1.
Table 1
Summary of Water Use
Customer Type Annual Volume Used (MG) Percent of Total Number of connections
Average Daily Use per Connection (gpd) Residential 79.5 13% 984 221 Commercial 31.3 5% 140 613 Industrial 504.3 80% 8 NAa Total 615.1 Notes:
a) Eight metered industrial connections serve three industries. The smallest industry has one metered connection and an average daily potable water use of 3,175 gpd. The largest industry has four metered connections with an average daily use of 1,026,000 gpd.
Minimal treatment of the groundwater is required for the City’s supply, and as such the water rates charged to the City’s water customers is relatively low. Water rates are comprised of a monthly customer charge that varies from $10 to $233, depending on the water meter size, and commodity output charges that vary seasonally (for residential customers) and with the volume of water used. For industries, the commodity output charge is $1.25/1,000 gallons.
The potable water storage and distribution systems are also part of the City’s water utility. In this instance, the City did not identify any storage or distribution capacity limitations; however this may not be the case for all communities. In other communities, water supply, treatment, or distribution may be capacity limited, and water sustainability strategies implemented at an industry may provide the municipality with more available treatment capacity, may reduce operations costs, or may reduce future capital expenditures needed to increase capacity.
4.2 Wastewater Utility
Important questions to ask a municipality about its wastewater system when looking at water sustainability opportunities at a community level include:
1. Are there any sewer collection system capacity limitations – either sewer or lift stations?
2. Are there any capacity concerns with the wastewater treatment system – hydraulic, organic, nutrient, or solids-related?
3. If flows are reduced, but loads remain the same, will the wastewater become too concentrated in any given parameter and inhibit treatment?
4. What are the treatment costs per 1,000 gallons of water? Would a reduction in water use have a significant impact on operations and maintenance costs of the wastewater treatment or collection systems?
5. Are there upcoming discharge regulations that require a significant capital
investment - an investment which could be reduced if flows or loads are reduced? 6. Are there upcoming discharge regulations that could drive decisions? For example,
biological phosphorus removal typically requires a certain ratio of BOD to
phosphorus. Decisions, either to provide pretreatment at the industry or not, can impact this ratio in and result in different levels of performance.
The City has a wastewater treatment facility with a rated average wet weather flow capacity of 3.0 million gallons per day (MGD) and an average dry weather capacity of 2.65 MGD. Equipment at the facility lacks treatment capacity for peak conditions. In 2011, the average daily flow to the treatment facility was 2.08 MGD. Approximately 75% of this flow, or 1.56 MGD, is attributed to the three significant industrial users (SIUs). The wastewater treatment facility has an organic treatment capacity of 10,383 pounds per day (lb/d) of CBOD, but in 2011 saw an actual load of only 2,323 lb/d, as shown in Table 2. Table 2 notes that the combined industrial CBOD contribution is greater than the actual load measured at the facility. This is likely due to treatment that occurs in the sewer collection system prior to influent sampling at the wastewater treatment facility, and errors inherent in sample
Table 2
Summary of Wastewater Flows and Loads
Parameter Flow (MGD) CBOD (lb/d) Design Capacitya 3.0 10,383 2011 Actual Flow/Load 2.08 2,323 Estimated Municipal/Commercialb 0.36 612 Industry #1 0.61 54 Industry #2 0.056 662 Industry #3c 0.89 2,219 Industrial Contributiond 75% 126% Notes:
a) Average wet weather design flow.
b) Estimated based on 100 gallons per person per day and 0.17 lb BOD/person/day.
c) Industry #3 has a rated flow (average flow during peak production days) of 1.25 MGD.
d) Industrial organic loadings measured at the industries are greater than the loadings measured in the facility influent, which is indicative of treatment in the collection system and sample characterization error.
The City’s wastewater treatment facility (WWTF) is hydraulically limited and not organically limited. While most of the organic loading is associated with the industries, overall the facility is organically under-loaded in comparison to the flow. The influent organic
concentrations at the WWTF (120 mg/L CBOD) are lower than typical domestic sewage (190 mg/L BOD). This can result in higher treatment cost per pound of organic load. Based on this, the best focus for this study, given the partnered approach between the City and the industries, is on volume reduction.
Water conservation at an industry often results in more concentrated discharges to the WWTF. For some communities that have organic treatment limitations in addition to hydraulic limitations, it may be important to address both the quantity and quality of the industrial discharges, but this is not the case for this particular community.
The three SIUs in this community each have agreements with the City that prescribe wastewater discharge allocations. In 2011, the industries paid a base monthly fee and paid for flow, BOD, suspended solids, phosphorous and ammonia-nitrogen based on a tiered system. Industry #1 has implemented a number of water reuse strategies to reduce its wastewater discharge by an average of 160,000 gallons per day over the last two years. However, the peak day loads from the industry remain high and, therefore, this reduction has not had a positive impact at the City’s WWTF.
Also part of the wastewater utility is the sewer collection system which conveys the
wastewater from the industries to the municipal wastewater treatment facility. The City has studied the capacity of sewer lines throughout the City and has identified that the sewer line from the two industries has limited capacity. Therefore, reducing the wastewater volume has the potential to prevent a future capital investment to replace the sewer line with a
larger diameter pipe. However, further investigation is required to determine the condition and remaining useful life of the sewer, as replacement may be warranted for non-capacity reasons as well.
4.3 Recycled Water Utility
Most Minnesota communities do not have a recycled water utility, but there are many examples of communities with recycled water utilities within the United States. In this report “recycled water” specifically refers to treated effluent from a municipal wastewater treatment facility. Recycled water can be reused to reduce potable water demands. Important questions to ask when considering the potential for recycled water use include:
1. Are there water demands at industries that can be served with recycled water from the municipal wastewater treatment facility? Industrial uses could include cooling water or rinse water. It is important to remember that industries, particularly food and beverage industries, may be subject to stringent health and safety regulations that may limit recycled water use. As a follow up: what quality of water is needed for the reuse locations?
2. Are there demands at the wastewater treatment facility that can be served with treated effluent?
3. Are there water demands within the community that can be served with recycled water from the wastewater treatment facility or reclaimed water from industry? These demands could include irrigation of parks, ball fields, or street sweeping. As a follow up: What quality of water is needed for the reuse locations? Are there separate irrigation water meters? Where are the use locations with respect to the recycled water supply?
4. Are there future effluent discharge regulations that are more easily achieved if effluent is reused rather than discharged to a surface water?
5. What level of wastewater treatment is currently provided?
6. Is there available space at the wastewater treatment facility for additional treatment/pumping systems?
Use of recycled water from a wastewater treatment facility in Minnesota requires a permit that includes routine monitoring of the water, conformance to water quality limits,
treatment process requirements, and adherence to specific construction codes and possibly local ordinances. Minnesota is one of several states that have not developed state water reuse criteria. Currently Minnesota uses California’s Water Recycling Criteria. Additional treatment of the wastewater at the wastewater treatment facility may be needed to comply with the Water Recycling Criteria depending upon the end use of the recycled water. The City does not have a recycled water utility. The industries that opted to participate in the study are wet industries, meaning that they produce more wastewater than the potable water they consume, which is described further in a following section. For this reason, using recycled water from the City’s WWTF in the wet industries is not practical when the
industries can reclaim their own water for reuse.
City potable water billing records were reviewed to assess the potential for recycled water use within the City. The WWTF uses on average approximately 28,000 gallons of potable water per day. A portion of this water demand can be offset by using recycled water. At a
wastewater treatment facility recycled water can be used at hose bibs, seal water for pumps, spray/rinse water for solids thickening and dewatering applications, spray water for foam control, and other locations. Section 4 discusses some of the costs associated with an in-plant recycled water system.
The City’s potable water use records are also useful to determine water demands for
irrigation uses. Comparing the water use during the summer months with that of the winter months is one way to estimate how much water is used for irrigation purposes. There are a small number of users within the City that have separate irrigation water meters, but most users have only one meter. There is a City park located near the WWTF which could be a potential recycled water use location. Costs associated with a recycled water distribution system are presented in Section 4.
One of the two industries participating in the study currently uses the pretreated industrial wastewater for irrigation. While this reduces the wastewater volume to the municipal WWTF, it only provides a seasonal reduction and does not alleviate the municipal wastewater treatment facility of its capacity limitations during the winter months. 4.4 Electric Utility
The City also provides electrical service to the community and industries. While energy is not a focus of this study, often reducing water use results in reduced energy consumption. A complete economic evaluation of reduction or reuse options would consider associated energy savings/costs and, therefore, it is important to consider energy costs when
evaluating water reuse and reduction opportunities. Reduced electricity demands may also provide benefits to the electrical utility in the form of grid capacity.
Industrial electric service has the following rates for 2011:
Customer Charge: $30.00/month
Demand Charge: $11.48/kW
Energy Charge: $0.0386/kWh
Franchise Fee: 5% in addition to the above rates
5.0
Water Sustainability Opportunities
Municipalities and industries alike invest significantly in water infrastructure and the operation of water systems. Pumping, treating, and distributing potable water is costly. On the back end, collecting, pumping and treating wastewater is costly. Implementing water sustainability strategies, including reducing demand and using reclaimed water, can positively impact both the municipality’s costs, as well as industry’s costs.
The following sections describe water sustainability opportunities for the community, focusing on the two participating industries and typical recycled water uses. Conceptual-level implementation costs are provided. These conceptual-Conceptual-level cost estimates are developed from assumptions and have an accuracy range of +40 to -20 percent. Further development of a given water reduction/reuse strategy is necessary to more accurately define implementation costs.
5.1 Industrial Water Sustainability
The City is home to three significant industries, two of which have opted to be involved with this study. These two industries contribute to the water demand and flows/loads at the wastewater treatment facility. Table 3 summarizes the water and wastewater uses and
average unit water/wastewater costs for these two industries. The wastewater costs per 1,000 gallons are significantly different between the two industries. This is because Industry #1 provides pretreatment, while Industry #2 does not.
Table 3
Summary of Water-Related Demands and Costs
Industry Average Potable Water Purchased (gpd) Average Potable Water Unit Cost ($/1,000 gal)a Average Wastewater Produced (gal/d) Average Wastewater Unit Cost ($/1,000 gal)c,d Industry #1 424,780 $1.90 608,310 $1.16 Industry #2 3,176 $1.25b 56,032 $5.21 Notes:
a) Cost excludes monthly meter charges (which would not change with water reduction)
b) Cost excludes onsite water softening, which is expected to be minimal for Industry #2 based on the volume of water used.
c) Costs present net average costs including all surcharges. d) Costs exclude wastewater pretreatment costs at the industry.
5.1.1 Understanding the Industries
The two participating industries are dairy-processing industries. It is important to be familiar with the specific industry(s) under consideration for water reuse to understand the water use areas to target and also to understand the regulations that apply.
Dairies are unique industries because the wastewater volume discharged is often greater than the volume of potable water used. This is because the raw material, or milk, is approximately 80 percent water. At dairies, the raw milk is pasteurized and placed in cooking vats for setting. After setting, the product may be heated, dried, or filtered
(depending on the location) to separate the solids and proteins from the liquid. This liquid is sometimes called condensate of whey (COW) water because it is the water that condenses when the raw milk is heated, which is the case for Industry #2. Industry #1 uses filtration to separate the solids and refers to the liquid as polished water, RO water, or permeate. Not all industries are net water producers like dairies. For many other types of industries, the wastewater volume produced is less than or equal to the volume of potable water used. Because a large portion of the wastewater volume is from the raw input material (milk), the wastewater volume is directly related to the volume of raw material/product. This leaves only the potable water fraction of the effluent wastewater (refer to Table 3) that can be targeted for reduction. This narrows the focus of the study to the potable portion of the wastewater volume.
Appendices A and B describe in further detail the two industries participating in the study and the potential water use reduction and/or reuse potential and the associated costs. Table 4 below summarizes the potential water reductions identified in the Appendices for the different levels of investment described above.
Dairy processing industries are regulated by the United States Food and Drug Administration (FDA) and by state rules and regulations. Most industries producing a product consumed by humans (food or beverage) are regulated by the FDA, and it is critical to understand the
applicable regulations (both federal and state) when considering water reuse. For
Minnesota dairies, there are specific rules governing water sources used in the industry set forth in the FDA Pasteurized Milk Ordinance (PMO). The most recent PMO is from 2009. Appendix D of the PMO identifies the standards for water sources. The PMO states that water reclaimed from Grade “A” milk and milk products may be reused in a milk plant and identifies three general categories of water reuse:
Category I: Reclaimed water used for potable water purposes, including the production of culinary stream.
Category II: Reclaimed water used for limited purposes, including the production of culinary steam, pre-rinsing of product surfaces, and cleaning solution make-up water. Category III: Reclaimed water used as feed-water for boilers not used for generating
culinary steam, or in a thick, double-walled, enclosed heat exchanger.
Each of the above use categories has associated water quality requirements. These water quality requirements restrict the reuse and define the treatment requirements.
5.1.2 Industrial Water Sustainability Strategies
In general, three levels of investment are identified to reduce potable water demands and use water more sustainably at the two industries:
(1) Conservation and education.
(2) Using polished or industrial reclaimed water in place of City potable water for PMO Category II and III uses.
(3) Treating polished water to potable water quality standards and using the treated water in place of City potable water for Category I uses.
Conservation and education require investment in monitoring equipment, control systems, database development and annual costs for operating and maintaining equipment and practices. Reduction through conservation and education may be considered the low-hanging fruit, but in some cases conservation and education strategies require investment in more efficient fixtures or equipment.
Polished water can be used in some locations, but not all, and there will likely be capital costs associated with new piping for polished water. Process potable water demands could be offset if polished water is further treated to potable water quality standards. It would be beneficial to reduce water use through conservation/education and use of polished water prior to implementing a potable-quality treatment system to minimize the size of the treatment system. However, there becomes a point at which the cost to increase the size of the treatment system is less expensive than cost to implement conservation or increase the use of polished water.
Table 4
Summary of Industrial Water-Sustainability Strategies and Costs
Water Reduction Strategy
Industry #1
Industry #2
Conservation/Education
Reduced Potable Water Demand (gpd) 36,000 600
Estimated Capital Cost of Implementation $80,000 $5,300
Estimated Annual O&M Cost of Implementation $15,000 $300
Estimated Annual Utility Cost Reductiona $28,000 $315
Estimated Simple Payback Period (years) 6.2 NAb
Category II & III Uses
Reduced Potable Water Demand (gpd) 94,000 2,000
Estimated Capital Cost of Implementation $160,000 $16,000
Estimated Annual O&M Cost of Implementation $26,000 $3,000
Estimated Annual Utility Cost Reductiona $72,000 $1,000
Estimated Simple Payback Period (years) 3.5 NAb
Category I (Potable-Quality) Uses
Reduced Potable Water Demand (gpd) 100,000 3,000
Estimated Capital Cost of Implementation $565,000 $292,000
Estimated Annual O&M Cost of Implementation $56,000 $29,000
Estimated Annual Utility Cost Reductionc $76,000 $10,400
Estimated Simple Payback Period (years) 27.6 NAb
Notes:
a) Cost reductions assume wastewater volume reduction, but no change in wastewater loadings.
b) Not applicable: Utility cost reductions do not offset the annual O&M costs for there to be any returns on investment.
c) Conservatively assumes that WW discharge can be eliminated by diverting the potable-quality water from the sewer (i.e. selling or giving away) and the concentrate from the treatment process can be converted to product.
There may be some opportunities for water sustainability for Industry #1, as summarized in Table 4. However, for Industry #2, given its small potable water demands, the opportunities that exist are not economically viable.
The costs associated with conservation/education include monitoring equipment to optimize water use and staff time to optimize controls. O&M costs include maintaining the monitoring equipment. For Industry #1, implementing these conservation strategies are expected to reduce water use by 36,000 gpd, resulting in a utility savings of approximately $27,000. This utility savings assumes savings from potable water purchases and wastewater volume surcharges. The simple payback for these water sustainability strategies associated with conservation/education is approximately 6 years for Industry #1. For the City, this would mean less revenue for water and wastewater utilities, but would also result in less potable water pumping, less wastewater pumping, and more available hydraulic treatment capacity at the WWTF.
The costs associated with increased use of polished water for Category I and II include piping to serve more processes with polished water and costs for chemical addition to increase the storage time of the polished water for Industry #1. For Industry #2 the costs consist of a condensate of whey (COW) water storage tank. The O&M costs include staff time for assumed increased cleaning and maintenance of the cooling system, chemicals to increase storage time, and/or additional chemicals for the cooling system. Implementing increased use of polished water has the potential to reduce the potable water demand of Industry #1 by 94,000 gpd and can save the industry approximately $72,000 per year. The simple payback for the water sustainability strategies associated with increased use of polished water is approximately 3.4 years. For the City, this would have a more notable impact on the availability of excess WWTF capacity.
The costs associated with produced potable-quality water from polished water include new reverse osmosis membranes, disinfection, and storage. The O&M costs, estimated from a specific installation example, include electricity, maintenance, and membrane replacement. For Industry #1, based on a 100,000-gpd system, the utility savings covers the estimated annual O&M costs, but has a long payback. The 100,000-gpd capacity was an estimate for this system. A smaller capacity system will cost less; however, the utility savings would also be less. Typically, the unit cost (i.e. $/gal) for a treatment system will decrease as the capacity increases; this is a result of economies of scale. With this in mind, if a 100,000-gpd system has an unfavorable economic return, it is expected that a smaller capacity system would have an even more unfavorable economic return. For the City, were Industry #1 to implement treatment for Category I uses, this would result in some increased revenue for the electrical utility, additional WWTF treatment capacity, but smaller water and
wastewater revenues.
Industry #2 is a unique case. The industry’s potable water demand is small and the industry pays only $1.25 per 1,000 gallons or $4,000 per year for potable water. With this low cost, it is difficult to identify a project that will ever result in an economic return for the industry. The industry could treat the condensate of whey (COW) water/effluent to potable water standards, but it could only use a very small portion of this water onsite. The remainder of the water could be sold to another user. To make this investment worthwhile, the industry would have to sell this excess potable-quality water for nearly $2.50/1,000 gallons. Another option may be for Industry #1 and Industry #2 to combine efforts and further offset the potable demands of Industry #1. However, this cooperation between industries could be difficult due to liability (especially for food/beverage industries) and/or perception issues. 5.2 Recycled Water Use within the City
Aside from the opportunity for industries to reclaim their own water, the effluent from the City’s WWTF can also be reclaimed for reuse. Recycled water from municipal WWTPs can be used at industries for cooling water or other purposes, at parks and ball fields for irrigation, and at the WWTF for in-plant uses such as rinse water.
To produce effluent that meets the Water Recycling Criteria, the WWTF will need to add additional treatment. The type of treatment required is dependent upon the specific end-use water quality requirements and the degree of human exposure at the end-end-use location. The WWTF produces what would likely be classified as Disinfected Secondary-23 recycled water during part of the year when disinfection is required. Disinfected Secondary-23 water, according to the California Water Recycling Criteria, can be used for the following applications:
Surface irrigation of cemeteries, freeway landscaping, restricted-access golf courses, ornamental nursery stock and sod farms, pasture for animals producing milk for human consumption, and any nonedible vegetation where access is controlled so that the irrigated area cannot be used as if it were a park or yard
Surface irrigation of non food-bearing trees
Surface irrigation of fodder and fiber crops and pasture for animals not producing milk for human consumption
Industrial or commercial cooling not involving the use of a cooling tower, evaporative condenser, spraying or any mechanism that creates a mist Industrial boiler feed
Non-structural fire fighting
Backfill consolidation around nonpotable piping Soil compaction
Mixing concrete
Dust control on roads and streets
Cleaning roads, sidewalks, and outdoor areas
Industrial process water that will not come into contact with workers Flushing sanitary sewers
5.2.1 Industrial Recycled Water Use
Industrial “recycled water use” is differentiated from “industrial reuse”. Within this report, “recycled water” means treated effluent from the municipal wastewater treatment facility. “Industrial reuse” involves reclaiming and reusing industrial process water within the industry. As stated previously, industries can often use recycled water from a wastewater treatment facility for cooling or other industrial uses. However, for this specific community with “wet” industries, providing the piping and pumping needed from the WWTF
approximately 0.5 miles to the industries is difficult to justify when the industries can recycle industrial effluent for reuse. Another challenge is that food and beverage industries have very limited locations where municipal recycled water effluent can be used due to health and safety concerns.
While industrial reuse of recycled water is not likely for the two industries involved in this case study, the third significant industry in the community or other future industries may be better candidates for recycled water. Making an assumption that a potential or future industrial recycled water application is for cooling with a cooling tower, the recycled water will need to meet disinfected tertiary recycled water criteria. Disinfected tertiary recycled water is a water that has been filtered and disinfected to meet a specified contact time or demonstrates a specific virus inactivation percentage. For the City’s WWTF to meet disinfected tertiary criteria, a filtration system and expanded disinfection system would be required. Additional treatment may also be required depending upon the specific cooling system needs and material.
There are four main components of a recycled water system: treatment, storage, pumping, and piping/transmission. The following conditions have been assumed:
The recycled water demand is 250,000 gallons per day.
Tertiary treatment is via gravity filtration (as opposed to more advanced filtration by membranes).
A one-mile recycled water distribution pipeline is needed.
Based on the above assumptions, producing disinfected tertiary recycled water for an industrial cooling tower application is expected to cost approximately $3.9 million, with an annual operations and maintenance (O&M) cost of $270,000 (MCES, 2007).
The City and industry would need to work together to determine the balance between the recycled water use rate and the capital cost investment. Using 250,000 gallons of recycled water per day instead of potable water would result in a potable water bill for the industry that is reduced by approximately $325,000 each year. But this also could reduce the City’s potable water revenue. The City can sell the recycled water, offsetting some of the revenue lost from the sale of potable water. Also, the potential or future industry could be driven by sustainability goals and may be willing to invest capital to make this feasible.
5.2.2 Other Recycled Water Uses
There are other potential recycled water use areas within the community, including irrigation of parks and ball fields. Most non-industrial recycled water use locations are seasonal. Given the low cost of potable water treatment, the availability of groundwater, and the seasonal demand at potential use locations, it is unlikely that it is in the City’s best interest to provide recycled water to these other reuse locations.
As a frame of reference, if a system were to be provided, the distribution cost for a 1-mile pipeline providing 250,000 gpd of Disinfected Secondary-23 recycled water would cost approximately $860,000, with an annual O&M cost of approximately $70,000 (MCES, 2007). These costs include increased disinfection (year-round), transmission system residual disinfection, and transmission pumping and piping.
5.2.3 Wastewater Treatment Facility In-Plant Uses
Sustainable water use may also include reusing effluent from the wastewater treatment facility within the facility. Potable water is currently used for spray water to control foam, for pump seal water, and rinse water. Treated effluent can be used for these purposes. To reuse the effluent, an effluent reuse distribution system is needed. This would consist of small-diameter piping and a pump station including pumps, a pressure tank, and controls. It is assumed that the pump station would draw directly from the chlorine contact basin. It is estimated that approximately 25 percent (7,000 gallons per day) of the total potable water demand at the WWTF (28,000 gallons per day) can be eliminated with use of treated effluent. This 7,000 gallons of potable water used per day costs approximately $3,300 per year at a cost of $1.25 per 1,000 gallons. For comparison purposes, an effluent reuse system is expected to cost approximately $90,000, with an annual operations and
maintenance cost of approximately $300 per year. Looking at this over a 20-year planning period, continued use of the City’s potable water system is more cost effective than
installing an effluent reuse system. In this particular case, it becomes favorable to install an effluent reuse system if the non-potable water demands at the WWTF are approximately 50 percent of the current average daily potable water demand (or 14,000 gallons per day). It could also become favorable if the potable water rates increased from $1.25 per 1,000 gallons to $2.50 per 1,000 gallons. The City has low potable water rates due to a low level of water treatment required and low electric rates.
6.0
Summary and Outcomes
6.1 Sustainability OptionsThe following six water sustainability options were identified as possible options for this case study community:
1. Industrial conservation/education 2. Industrial reuse of process water
3. Industrial treatment of process water to potable-quality water 4. Wastewater treatment facility effluent use at industry
5. Wastewater treatment facility effluent use within the City 6. Wastewater treatment facility effluent use at the WWTF
The additional treatment, storage, and transmission necessary for options 4, 5, and 6 combined with the low potable water costs, make these options nonviable from an
economic perspective. Options 1, 2, and 3 offer potential benefits for Industry #1, with the most viable option being increased use of process (polished) water for other uses by the industry. Unfortunately, for this case study, while internal reuse of process water will reduce the overall volume of wastewater discharged, additional evaluation and capital and
operational changes are required to reduce the peak flows to the municipal WWTF. The municipality’s goal to provide more hydraulic capacity will not be achieved until Industry #1 can guarantee a maximum peak wastewater discharge.
For this case study and similar community water reuse applications, the reuse initiatives must factor in the change in revenue to the municipality with the change in industrial waste flows and loads and potable water use. The municipality must generate enough revenue to cover annual base costs. Base costs include asset maintenance, labor, and debt service, which do not change with the volume of water processed. A significant reduction in industrial wastewater discharges and potable water use may result in an increase in the utility’s residential and/or industrial rates and possibly offset industrial cost savings.
By pursuing water sustainability projects together, industries and municipalities can work to realize benefits for the overall community, both economic and longer-term sustainability goals.
From the industries perspective, the expected benefits may include: Decreased potable water costs* to the City.
Decreased wastewater treatment costs* to the City.
Decreased onsite potable water treatment (i.e. softening) costs. Decreased onsite wastewater treatment costs.
Decreased electrical and natural gas utility costs* (i.e. pumping, heating, and/or cooling less water).
Improved customer and community perceptions due to increased sustainability. *These benefits may not be realized. If the flow/loading/utility reductions do not result in an O&M reduction for the City, the City may need to redistribute costs or increase rates to cover their expenses and negate the savings the industry expected. Also, the benefit may not materialize if only the average water or utility demand or wastewater
flow is changed but not the peak demand/flow. If the City still needs to provide for peak demands/flows it cannot take advantage of additional capacity that can be allocated to another industry that provides a source of revenue. The City would need to increase unit rates to cover annual costs. In this case study, the City’s WWTF is organically under loaded, and a reduction in load and higher fluctuations can also lead to less efficient treatment and potentially higher O&M costs.
From the City’s perspective, the expected benefits may include:
Increased potable water treatment, storage, and/or transmission capacity that can eliminate or delay a planned capital improvement project.
Increased wastewater treatment and/or transmission capacity* that can eliminate or delay a planned capital improvement project.
Reduced O&M costs for potable water system (reduced chemical demand, reduced electrical demand).
Reduced O&M costs for wastewater system (reduced chemical demand, reduced sludge hauling, reduced electrical demand).
Increased potable water treatment, storage, and/or transmission capacity that can allow the City’s residential, commercial, or industrial base to grow, which can increase the tax base and bring more jobs to the City.
Increased wastewater treatment and/or transmission capacity* that can allow the City to accept another significant industry, generating more revenue and bringing jobs to the City.
*These benefits will not be achieved if the industrial peak wastewater flows are not reduced. The City will still need to provide capacity for peak flows even if the total volume of wastewater discharged by the industries is reduced.
6.2 Driver Summary
Determining the value of the potential benefits is necessary to come to a solution on a fair rate structure. For this particular case study, the City expressed a desire to reduce
wastewater flow to provide 100,000 to 200,000 gpd of wastewater treatment capacity for additional industries. Industry #1 has specific goals to use water more sustainably. Industry #2 would be interested in implementing water sustainability strategies if they make
economic sense. 6.3 Optimum Option
Based on the conceptual costs developed for the six water sustainability practices, the most optimum outcome is for Industry #1 to maximize use of reclaimed process water. This will reduce Industry #1’s potable and wastewater costs by approximately $72,000 per year. It will reduce the City revenue by the same amount, but will free up a portion (estimated to be 94,000 gpd) of the desired WWTF capacity that the City could allocate to other customers. The municipality’s benefit will only occur if Industry #1 is able to reduce the peak
wastewater flow. Additional evaluation and likely additional costs will be required for Industry #1 to manage their discharge fluctuations to meet a maximum peak flow to provide the capacity the City is seeking. If the City is not able to allocate capacity to other customers and Industry #1 reduces its purchase of potable water supply from the City and reduces its wastewater discharges to the City’s WWTF, the City will need to evaluate their utility rate structure and may need to increase their rates to make up the lost revenue.
Given the small water/wastewater volumes of Industry #2, not many options are economically viable. However, it was noted that there may be a wastewater flow monitoring inaccuracy, which may be worthwhile to explore further.
6.4 Outcomes
This study outlines the steps involved in a water reuse evaluation and identifies information to compile and preliminary questions to address. In communities, like this case study community, where industry has a larger water demand and wastewater loading than the residential/commercial sector, it is important to evaluate water sustainability practices from all perspectives. For this particular community, only one of the six potential water
sustainability options was considered economically feasible. For other communities and industries looking to implement water sustainability practices, the following circumstances would improve the economic viability:
Limited supply of adequate quality water. When water supply is limited or of poor quality requiring significant treatment for potable use, the potable water rates will increase. With higher potable water rates, the payback for reuse options will decrease. This case study involved a municipality with an adequate aquifer supply and sufficient water infrastructure capacity.
Infrastructure capacity limitations. If the municipality needs to invest to increase capacity of potable water, wastewater, or electrical infrastructure, this investment can be compared to the implementation of water sustainability practices. While there are infrastructure limitations driving this particular case study community, an important conclusion is to distinguish between average daily requirements and peak requirements. Water demands that do not need a high-degree of treatment. The industries in this
case study needed potable-quality water for many different uses. If less stringent treatment is acceptable for a particular industry or use location, economics will improve.
Inclusion of other existing or future industries in the analysis that require a year-round consistent source of water. Only two industries were considered in this case study, both of which have their own process water that can be reclaimed. The inclusion of other industries in the community could impact the economics of a community recycled water system.
A longer planning horizon
To account for future infrastructure replacement costs even if capacity increases are not forecasted.
To account for future regulations of water infrastructure systems. For example, future wastewater effluent discharge regulations for the City could require treatment equivalent to recycled water quality criteria.
7.0
References
Environmental Protection Agency (EPA), 2011. Energy Efficiency Improvement and Cost Saving Opportunities for the Dairy Processing Industry. October, 2011.
Metropolitan Council Environmental Services (MCES), 2007. Recycling Treated Municipal Wastewater for Industrial Water Use. November, 2007.
23
Appendix A
Industry #1 Analysis
Industry #1 Analysis
Water Reuse for Agricultural Processing
Table of Contents
Page
8.0 Introduction ... 25
9.0 Wastewater Volumes ... 25
10.0 Water Reduction Opportunities ... 27
10.1 Clean-in-Place Water Use ... 28
10.2 Cooling ... 29
10.3 Water Softener Regeneration ... 30
10.4 Hosedrops ... 30
10.5 Pump Seal Water ... 30
10.6 Lavatory, Sinks, and Fountains ... 30
10.7 Summary ... 31
11.0 Costs to Implement Reduction Opportunities ... 32
11.1 Conservation and Education ... 32
11.2 Additional Polished Water Use ... 33
11.3 Polished Water Treatment to Potable-Quality Water ... 34
11.4 Summary ... 35
12.0 References ... 35
List of Tables
Table 1A. Industry #1 Summary of Potable Water Uses ... 26Table 2A. Summary of Potable Water Use Reduction Strategies ... 31
Table 3A. Summary of Water Sustainability Strategies ... 32
List of Figures
Figure 1A. Industry#1 Water Balance for Nov. 2011 (Volumes in gallons per day) ... 258.0
Introduction
One of the three significant industries in the City is a dairy facility. The dairy produces various dairy products including cheeses, whey, and a byproduct that is further processed by Industry #2. Water inputs into Industry #1 include raw material, or milk, which contains 80 percent water. The industry also purchases approximately 425,000 gallons of potable water from the City per day. The City’s potable water supply is hard, with a hardness of
approximately 38 grains. Due to the hardness, Industry #1 utilizes several water softeners to reduce the hardness.
Industry #1 discharged an average of 0.6 million gallons per day (MGD) of wastewater to the City’s wastewater treatment facility (WWTF) at a cost of approximately $21,000 per month, or $250,000 per year. The discharged effluent volume comes from the raw product (milk) and potable water. A simple balance is shown in Figure 1A. As shown in Figure 1A, the volume of wastewater produced is greater than the volume of potable water the industry purchases from the City. This is because a portion of the raw product contains excess liquid that is wasted. A wastewater discharge volume that is greater than the potable water purchased is not typical of all industries. Other types of industries are likely to have the wastewater discharge volume less than or approximately equal to the potable water purchased.
Figure 1 –
Industry#1 Water Balance for Nov. 2011 (Volumes in gallons per day)
9.0
Wastewater Volumes
Industry #1 has been investing effort and money over the last two years to reduce its potable water demands and the amount of wastewater generated. Figure 2A shows the wastewater volumes from Industry #1 over the last two years (2010 and 2011). Industry #1 has reduced its wastewater volume by approximately 22 percent, or an average of 160,000 gallons per day (gpd), over the last 24 months. This reduction has resulted from increased staff education related to water conservation practices, process optimization, and increased reuse of treated process water or “polished water”. It is important to note that this
reduction has resulted in a lower average daily discharge, but the peak day discharge has remained unchanged and, therefore, has not necessarily had a positive impact at the City’s
*Wastewater 600,000 10,000 85,000 10,000 1,000 3,000,000 Product Process WW* PROCESSING ~3,400,000 (varies seasonally) 375,000 Potable (City) Water
Raw Input (Milk, 88% water)
Domestic WW* WW* Solids Evap Losses Other
WWTF. In 2011 there were two peak wastewater flow events that occurred. If these events could be attributed to a single cause, effort could focus on reducing that problem.
However, these peak occurrences were not attributable to any known cause.
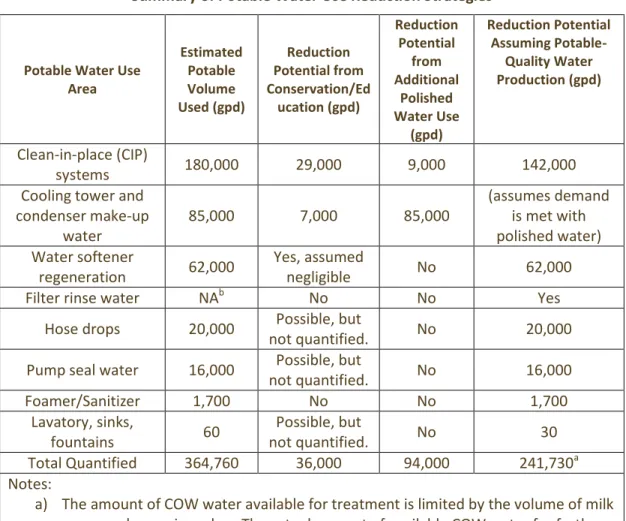
The potable water uses have been quantified by the industry. Table 1A summarizes the potable water demands. To reduce the BOD and TSS concentration and the wastewater treatment surcharges, Industry #1 implements onsite pretreatment.
Figure 2 –
Summary of Wastewater Discharge Volume
Table 5
Industry #1 Summary of Potable Water Uses
Potable Water Use Area Estimated Potable Volume
Used (gpd)
Clean-in-place (CIP) systems 180,000
Cooling tower and condenser make-up water 85,000
Water softener regeneration 62,000
Hose drops 20,000
Pump seal water 16,000
0 100,000 200,000 300,000 400,000 500,000 600,000 700,000 800,000 Fl ow , g al lons pe r da y Flow Linear (Flow)
Foamer/Sanitizer 1,700
Lavatory, sinks, fountains 60
Defiltration rinse watera
Total Quantified 364,760
Notes:
a) Upon reviewing the industries flow diagrams and water balance,
defiltration rinse water was found to be omitted from the water balance. No estimate of the volume was available.
10.0
Water Reduction Opportunities
A large portion of the wastewater volume is from the raw input material (milk). This volume is tied directly to the volume of raw material/product and can only be reduced by finding ways to reuse the waste product or reducing production. Within the dairy process, there are locations where condensate of whey (COW) water can be reused in lieu of potable water. Therefore, the evaluation of water sustainability strategies needs to focus on the uses of approximately 375,000 gpd of City-purchased potable water. Volumes of potable water can be reduced through the following methods:
(1) Conservation and education.
(2) Using polished or reclaimed water in place of City potable water. Using polished water or reclaimed water at a dairy is subject to standards established by the U.S. Food and Drug Administration Pasteurized Milk Ordinance (PMO).
(3) Treating polished water to potable water quality standards and using the treated water in place of City potable water. This is also subject to the PMO requirements.
Conservation and education require investment in monitoring equipment, control systems, database development and annual costs for operating and maintaining equipment and practices. Reduction through conservation and education may be considered the low-hanging fruit, but in some cases conservation and education strategies require investment in more efficient fixtures or equipment.
Polished water can be used in some locations, but not all, and there will be capital costs for new piping for polished water. Process potable water demands could be offset if polished water is further treated to potable water quality standards. It would be beneficial to reduce water use through conservation/education and reuse the polished water prior to
implementing a potable-quality treatment system to minimize the size of the treatment system. However, there becomes a point at which the cost to increase the size of the treatment system is less expensive than cost to implement conservation or increase the use of polished water.
10.1 Clean-in-Place Water Use
Federal law requires dairy processors and other food processers to follow certain practices for cleaning equipment and clean-in-place (CIP) systems. CIP systems require several rinse cycles and are a significant source of water use in a dairy. Industry #1 has 13 CIP systems that operate on over 110 individual CIP circuits that use an estimated 180,000 gpd of potable water, and this is after significant reductions have been made to the CIP system over the last two years. Clean-in-place systems typically involve the following cycles (EPA, 2011):
Equipment is drained of all milk/product.
An initial rinse with water is used to remove much of the milk/produce residue. A hot alkaline detergent solution is circulated through the equipment, and then drained. The alkaline solution is used to remove organics and soil not removed through the initial rinse.
A water rinse is used to remove much of the residual alkaline solution.
An acid solution is circulated through the equipment, and then drained. The acid removes mineral deposits and also neutralizes any leftover base.
A water rinse is used to remove the residual acid solution.
A final sanitize solution prepared with potable-quality water is used on the equipment. This step is the final antimicrobial step in the cleaning process. Optional – often, air is blown through the equipment to remove residual water to
push sanitizer through the system more efficiently.
There are several ways in which potable-quality water used in CIP can be reduced. Industry #1 has implemented some of these strategies already. The Energy Efficiency Improvement and Cost Saving Opportunities for the Dairy Processing Industry report (EPA, 2011) provides a number of suggestions to reduce CIP water use, which are summarized below.
Reuse or recovery distribution systems to reclaim the alkaline detergent solution and reuse it for future cleaning (Conservation). The final rinse water can also be captured and used for the next CIP cycle’s initial rinse (EPA, 2011). Industry #1 is currently reusing rinses on some of the CIP circuits.
Pulse rinses can be more effective at rinsing, while also reducing water demand
(Conservation). Industry #1 uses slug or pulse rinses and recaptures the slug for use as a pre-rinse.
RO or evaporative water use involves diverting RO reject water for use in the CIP system (Offset with Polished Water). Industry #1 uses polished water for many intermediate post rinses and also for chemical make-up.
Optimize CIP final flush cycle times (Conservation). An effective flush requires a velocity of 5 feet per second. Based on the volume of the piping and equipment (which is different for the 110+ circuits), the actual required rinse time can be determined. This would require programming changes to the 100+ circuits. It is very difficult to quantify the water reduction that could be realized by customizing all 110+ circuits because some circuits may operate closer to the ideal time than others. It is estimated that this would roughly reduce the post rinse water demand by 10 percent, resulting in an overall potable water reduction of approximately 1 percent or 2,000 gpd.
Replace prerinse water with polished water or eliminate the prerinse altogether (Offset with Polished Water). The prerinse water accounts for approximately 5 percent of the
potable water used for the CIP system at Industry #1, or approximately 9,000 gallons per day.
Optimize reuse or recovery distribution systems by installing inline conductivity or turbidity meters to determine when a rinse is too contaminated for use and needs to be disposed (Conservation). This may reduce CIP water use for Industry #1 by
approximately 5 percent, or 9,000 gpd.
Implement an over-ride procedure where instead of separate alkaline and acid wash steps, the first step (alkaline step) is kept circulating while acid is added to the required concentration (Conservation). This procedure requires more chemical use, but has been estimated to reduce water demands by 10 percent, or for Industry #1 this equates to 18,000 gpd.
Implement single-phase cleaning where a single cleaning solution that acts as both the alkaline and the acid to remove both the organics and the mineral deposits is used (Conservation). This technique saves water associated with the interim rinse step and second wash and can result in an estimated 15 percent reduction in water use, or for Industry #1 27,000 gpd. However, there is a chance the chemical costs could change significantly.
Industry #1 has already implemented some of the suggested CIP water reduction strategies. Additional conservation/education opportunities could reduce the potable water by up to 29,000 gallons per day (assuming over-ride is implemented and not single-phase cleaning). Increased utilization of polished water could further reduce the potable water demand by approximately 9,000 gallons per day. The remaining CIP potable water use (142,000 gpd) can be offset with potable-quality treated polished water.
10.2 Cooling
Reducing water use in cooling applications requires a careful balance between bleed-off water and make-up water quality (called the concentration ratio). Water is bled from the system and new water added to reduce the concentrations of suspended and dissolved solids. The presence of suspended and dissolved solids can lead to scaling and/or corrosion, which can negatively affect the efficiency of the system. Constituents that are of specific concern in cooling tower water include (1) pathogenic microorganisms; (2) calcium and magnesium salts that produce scale; and (3) ammonia, chlorides, and heavy metals that can cause corrosion that promote biological growth and the formation of slime (MCES, 2007). Optimizing this balance can result in water savings as high as 20 percent (EPA, 2011). Industry #1 uses potable water for make-up water in the cooling towers and ammonia condensers. The industry has implemented improvements to reduce the potable water demands from the cooling towers and has planned projects for the next year which will replace the majority of the potable demands with reverse osmosis (RO) water or polished water. Installing conductivity meters and flow meters on the make-up and bleed off lines can provide the necessary information to fully understand the cooling tower operation and the concentration ratio.
Industry #1 uses approximately 35,000 gallons per day of potable water in three cooling towers and approximately 50,000 gallons per day in five ammonia condensers. It is assumed that 100 percent of the cooling potable water demands can be eliminated by using process RO water and optimizing the concentration ratio.