SYSTEMATIC APPROACHES TO IMPROVE TEST CASE PRIORITIZATION USING REQUIREMENTS AND RISKS
A Dissertation
Submitted to the Graduate Faculty of the
North Dakota State University of Agriculture and Applied Science
By
Charitha Sasika Hettiarachchi
In Partial Fulfillment of the Requirements for the Degree of
DOCTOR OF PHILOSOPHY
Major Department: Computer Science
July 2016
NORTH DAKOTA STATE UNIVERSITY
Graduate SchoolTitle
SYSTEMATIC APPROACHES TO IMPROVE TEST CASE PRIORITIZATION USING REQUIREMENTS AND RISKS
By
Charitha Sasika Hettiarachchi
The supervisory committee certifies that this dissertation complies with North Dakota State University’s regulations and meets the accepted standards for the degree of
DOCTOR OF PHILOSOPHY SUPERVISORY COMMITTEE: Dr. Hyunsook Do Chair Dr. Kendall Nygard Dr. Saeed Salem Dr. Simone Ludwig Dr. Jacob Glower Approved: July 7 2016 Date Dr. Brian Slator Department Chair
ABSTRACT
The use of system requirements and their risks enables software testers to identify more important test cases that can reveal faults associated with risky components. Having identified important test cases, software testers can manage the testing schedule more effectively by running such test cases earlier so that they can detect then fix faults sooner, especially, in regression testing. Some work in this area has been done, but the previous approaches and studies have some limitations, such as an improper use of requirements risks in prioritization and an inadequate evaluation method.
To address the limitations, we implemented a new requirements risk-based prioritization technique and evaluated it considering whether the proposed approach detects faults earlier overall and also detects faults associated with risky components earlier. Then, we proposed an enhanced risk-based test case pri-oritization approach that estimates requirements risks systematically with a fuzzy expert system. Next, we performed an experiment on an enterprise cloud application to measure the fault detection rate of different test suites that are prioritized based on two requirements factors and requirements risks. Finally, we em-ployed a systematic risk estimation mechanism using a fuzzy expert system to make our test prioritization process more efficient and more effective.
We also provide guidance and understanding to practitioners and researchers on the use of require-ments and risk-based test prioritization on different types of software systems through the family of em-pirical studies performed in this dissertation. Further, we compared our novel requirements risks-based approaches with other existing industrial approaches. These comparisons will help practitioners and re-searchers to effectively employ prioritization techniques on their working environments.
ACKNOWLEDGEMENTS
First and foremost I want to thank my advisor Prof. Hyunsook Do. I would like to thank you for encouraging my research and for allowing me to grow as a research scientist. You have supported me academically and also provided research assistantship for over three years. I would like to thank Prof. Kendall Nygard for his advice since I started my Ph.D. degree at NDSU and his support in many ways. I would also like to thank my committee members, Prof. Saeed Salem, Prof. Simone Ludwig and Prof. Jacob Glower, for their time, insightful comments, and all the support they gave to me for past several years. I am also grateful to all professors who have educated me and the staff members of computer science department at NDSU. I would also like to acknowledge Prof. Janet Knodel for assisting me in several ways. Words cannot express how grateful I am to my beloved wife, Imali, and my beloved daughter, Ranolee, for all their support and all of the sacrifices that they have made over the years. Finally, I thank my mother-in-low, father-in-low, my mother, and my father for all the support they gave to me and for encouraging me to continue education and reach my goals.
TABLE OF CONTENTS
ABSTRACT . . . iii
ACKNOWLEDGEMENTS . . . iv
LIST OF TABLES . . . viii
LIST OF FIGURES . . . x
1. INTRODUCTION . . . 1
1.1. Goals of this Dissertation . . . 2
1.2. Approaches to Meet these Goals . . . 2
1.3. Organization of this Dissertation . . . 3
2. BACKGROUND AND RELATED WORK . . . 4
3. APPROACH . . . 6
3.1. Investigate the effectiveness of requirements risk-based technique in test prioritization . . . . 6
3.2. Expand the previous study reducing the threats to validity . . . 7
3.3. Investigate the effectiveness of requirements risk-based test prioritization on a very large industrial system . . . 7
3.4. Investigate the impact of direct use of expert systems in requirements risk-based regression testing . . . 8
4. EMPIRICAL STUDIES . . . 9
4.1. Effective Regression Testing Using Requirements and Risks . . . 9
4.1.1. Approach . . . 9
4.1.2. Empirical Study . . . 18
4.1.3. Variables and Measures . . . 19
4.1.4. Experimental Setup and Procedure . . . 21
4.1.5. Data and Analysis . . . 23
4.1.6. Discussion and Implications . . . 26
4.1.8. Conclusions . . . 27
4.2. Risk-based Test Case Prioritization Using a Fuzzy Expert System . . . 28
4.2.1. Fuzzy Expert Systems . . . 29
4.2.2. Approach . . . 33
4.2.3. Empirical Study . . . 43
4.2.4. Variables and Measures . . . 44
4.2.5. Experimental Setup and Procedure . . . 46
4.2.6. Data and Analysis . . . 48
4.2.7. Discussion and Implications . . . 53
4.2.8. Threats to Validity . . . 55
4.2.9. Conclusions . . . 56
4.3. Requirements Based Test Prioritization Using Risk Factors: An Industrial Study . . . 57
4.3.1. Approach . . . 58
4.3.2. Empirical Study . . . 62
4.3.3. Variables and Measures . . . 62
4.3.4. Experimental Setup and Procedure . . . 63
4.3.5. Data and Analysis . . . 67
4.3.6. Discussion and Implications . . . 69
4.3.7. Threats to Validity . . . 71
4.3.8. Conclusions . . . 72
4.4. A Systematic Approach to Test Case Prioritization Using a Fuzzy Expert System . . . 73
4.4.1. Approach . . . 74
4.4.2. Empirical Study . . . 82
4.4.3. Variables and Measures . . . 83
4.4.4. Experimental Setup and Procedure . . . 84
4.4.6. Discussion and Implications . . . 88
4.4.7. Threats to Validity . . . 91
4.4.8. Conclusions . . . 91
5. CONCLUSIONS AND FUTURE WORK . . . 93
5.1. Lessons Learned . . . 93
5.2. Merit and Impact of This Research . . . 94
5.3. Future Directions . . . 94
LIST OF TABLES
Table Page
4.1. Weights of risk indicators . . . 11
4.2. Risk Weights of Requirements . . . 12
4.3. Software product-risk items . . . 14
4.4. Risk Exposure and Weighted Risk Exposure Matrix . . . 15
4.5. Severity of risk items . . . 15
4.6. Example of Risk Exposure and Weighted Risk Exposure of iTrust . . . 16
4.7. Example of Prioritized Test Suite - iTrust . . . 17
4.8. Experiment Object and Associated Data . . . 18
4.9. Example Test Cases, TRSW and Associated Data for Original Test Order-Version 2 . . . 22
4.10. APFD Comparison And Improvement Over Controls . . . 23
4.11. Percentage of Total Risk Severity Weight (PTRSW) for Different Test Execution Levels . . . 25
4.12. Input variable membership functions . . . 31
4.13. Output variable membership functions . . . 32
4.14. Fuzzy rules for RMS . . . 32
4.15. Risk indicators and fuzzy input-output values . . . 36
4.16. Risk indicator comparison . . . 37
4.17. Risk indicators and weights . . . 37
4.18. Risk indicator values and the risk exposure for requirements . . . 38
4.19. Software product-risk items . . . 40
4.20. Risk exposures and weighted risk exposure matrix . . . 40
4.21. Severity of risk items . . . 40
4.22. Example of risk exposures and weighted risk exposures of iTrust . . . 41
4.23. Example for a prioritized test suite: iTrust . . . 42
4.25. Example test cases, PTRSW, and associated data for iTrust original test order-version 2 . . . 48
4.26. Heuristic APFD: iTrust and Capstone . . . 49
4.27. APFD comparison and improvement over controls: iTrust . . . 49
4.28. APFD comparison and improvement over controls: Capstone . . . 50
4.29. Percentage of total risk severity weight (PTRSW) for different test execution levels: iTrust . . . 52
4.30. Percentage of total risk severity weight (PTRSW) for different test execution levels: Capstone . 52 4.31. Experimental data set: SaaS . . . 65
4.32. Test case prioritization results: SaaS . . . 68
4.33. Security objectives and keywords . . . 76
4.34. Three membership functions for input and output variables . . . 77
4.35. Four membership functions for input and output variables . . . 78
4.36. Risk indicators and fuzzy input-output values . . . 79
4.37. Fuzzy rules for requirement risk-based testing . . . 80
4.38. Risk indicator comparison . . . 81
4.39. Risk indicators and weights . . . 81
4.40. Requirements risks: WSM . . . 81
4.41. Experiment object and associated data . . . 82
LIST OF FIGURES
Figure Page
4.1. Overview of Requirements Risk-Based Approach . . . 10
4.2. APFD Example (Rothermel et al.) . . . 21
4.3. APFD Boxplots for All Controls and Heuristic . . . 24
4.4. PTRSW Comparison Graphs for All Versions of iTrust . . . 26
4.5. Architecture of a fuzzy expert system . . . 30
4.6. Overview of the risk-based approach . . . 33
4.7. APFD boxplots for all controls and the heuristic: iTrust and Capstone . . . 51
4.8. PTRSW comparison graphs for all versions of iTrust and Capstone . . . 53
4.9. Correlation between CP and FP (H. Srikanth et al.) . . . 69
4.10. Overview of Requirements Risk-Based Approach . . . 74
4.11. Three membership functions of input and output variables . . . 77
4.12. Four membership functions of input and output variables . . . 78
4.13. APFD boxplots for all controls and the heuristic: iTrust . . . 89
4.14. APFD boxplots for all controls and the heuristic: PassowrdSafe . . . 89
1. INTRODUCTION
Regression testing and maintenance are important activities to ensure high quality for modified software systems. Typically, these activities require a great deal of time, money, and effort, so they can be a significant burden for software companies that often have a time pressure with product release [10, 15]. One way to help this situation is to apply test case prioritization (TCP) that identifies more important test cases (e.g., test cases that are likely to detect more faults) and run them early within the limited time block. With this approach, companies can increase the chances to detect and fix faults early.
Due to their appealing benefits in practice, various test case prioritization techniques have been proposed and studied by researchers and practitioners [19, 60, 62, 66], and many empirical studies have shown the effectiveness of test case prioritization [16, 47]. While the majority of test case prioritization approaches utilize source code information, some researchers have investigated using other software artifacts produced during early development phases, such as system requirements and design documents [8, 36, 59]. For example, Srikanth et al. [59] present an approach that prioritizes test cases using system requirements as well as their importance and fault proneness, and Arafeen and Do [8] cluster test cases using requirements similarities and prioritize them by incorporating code information. Krishnamoorthi and Mary [36] present a technique that prioritizes test cases using requirements and several factors related to the requirements, such as implementation complexity and customer priority.
This trend is encouraging because such artifacts could provide a better understanding about the source of errors. Using system requirements and their risk information, software testers can manage the testing schedule better by identifying more important test cases that are likely to detect defects associated with the risks faced by the system (e.g., safety or security risks). To gain such benefits, a few researchers have started investigating the use of risks with the requirements, and these studies found that using risks along with requirements could improve the effectiveness of test case prioritization [14, 61, 67].
These approaches, however, consider one limited risk type (e.g., fault information collected from the previous version) [14, 61] or do not consider a direct relationship between requirements risks and test cases when they prioritize test cases [67]. Typically, software systems contain various types of risks, thus considering only one limited risk type fails to properly expose important potential risks in the software system. Also, without utilizing a direct relationship between requirements risks and test cases, prioritization
techniques could fail to produce an effective order of test cases that can expose faults early in risk areas. Further, like other test case prioritization research, these studies have evaluated the proposed approaches by measuring how fast the reordered test cases detect faults. However, the approaches utilize risk information to prioritize test cases, so they should be evaluated by measuring whether the detected faults are, indeed, from the locations where risks reside in the product.
1.1. Goals of this Dissertation
In this dissertation, we have proposed new requirements risk-based test prioritization approaches to address these limitations. The goals of this research are to propose new requirements risk-based test case prioritization approaches that can systematically estimate risks residing in software requirements and estab-lish proper relationships between requirements risks and test cases to enhance the overall effectiveness of test case prioritization and detect more faults early in risky components of software systems under regression testing.
1.2. Approaches to Meet these Goals
We followed the following steps to accomplish the aforementioned goals.
First, we proposed a new test case prioritization technique that uses risk levels of potential defect types to identify risky requirements and prioritizes test cases based on the relationship between test cases and these requirements. From this empirical study, we determined that the requirements risk-based technique can positively impact the test prioritization in regressing testing. This research presented in Section 4.1 was published in the Proceedings of the Eighth International Conference on Software Security and Reliability (SERE) in 2014 [28].
Our second approach made the requirements risk estimation process more systematic and precise by reducing subjectivity using a fuzzy expert system. We found that the proposed systematic risk assessment approach that used a fuzzy expert system can address the subjectivity related limitations of our previous approach. We also found that this systematic approach can improve the effectiveness of test prioritization and the efficiency of testing process. This research presented in Section 4.2 was published in the Journal of Information and Software Technology (JIST) in 2016 [29].
Following that, we applied requirements risk-based test prioritization approaches in a very large industrial context using a cloud-based enterprise level application to investigate the effectiveness of require-ments risk-based test prioritization on very large systems and we compared its performance with two other
requirements and requirements risk-based test prioritization approaches can perform better than one of the prevalent industrial test prioritization techniques (random approach). This research presented in Section 4.3 was published in the Journal of Information and Software Technology (JIST) in 2016 [57].
Finally, we proposed a test prioritization mechanism which was based on a fuzzy expert system (FES) that further reduced the involvement of human experts in risks estimation. From this research, we found that the use of requirements risks and fuzzy expert systems can improve the effectiveness of test prioritization. This research presented in Section 4.3 is under review in the Journal of Information and Software Technology (JIST).
To evaluate our new test prioritization approaches, we defined a new evaluation method that shows how fast the reordered test cases can detect faults in the risky areas. To investigate the effectiveness of our approaches, we designed and performed empirical studies using different types of applications such as open source and industrial programs with multiple versions and requirements documents.
1.3. Organization of this Dissertation
The rest of this paper is structured as follows. Chapter 2 of this dissertation describes related work. Chapter 3 describes the approach of this dissertation. Chapter 4, 5, 6, and 7 describe four empirical studies we performed with their results and implications. Chapter 8 discusses conclusions and future work.
2. BACKGROUND AND RELATED WORK
Test case prioritization provides a way to schedule test cases so that testers can run more important or critical test cases early. Various prioritization techniques have been proposed [66], and some of them have been used by several software organizations [39, 60]. The majority of prioritization techniques have used the information obtained from software source code [16, 49, 54]. For instance, one technique,total statement coverage prioritization reorders the test cases in the order of the number of statements they cover. One variation of this technique,additional statement coverage prioritizationreorders the test cases in the order of number of new statements they cover. Other types of code information for aiding prioritization include code change history, code modification, and fault proneness of code [43, 54]. Beyond code-based information, other software artifact types, such as software requirements and design information, have also been utilized. For example, Srikanth et al. [59] proposed a test case prioritization approach using several requirements-related factors, such as requirements complexity and requirements volatility, for the early detection of severe faults. Krishnamoorthi and Mary [36] also proposed a model to prioritize test cases using the requirements specification to improve the rate of severe fault detection. Arafeen and Do [8] proposed an approach that clusters requirements based on similarities obtained through a text-mining technique and that prioritizes test cases using the requirements-tests relationship. These studies reported that using requirements information improved the effectiveness of prioritization.
In addition to requirements and design information, other researchers have used software risk in-formation to prioritize test cases in order to run test cases to exercise code areas with potential risks as early as possible [61, 67]. Many risk-based testing techniques have adopted Amland’s [7] risk model that estimates risk exposure as a product of probability of faults in software components and the impact (e.g., cost or damage) of the corresponding fault if it occurs in the operational environment. In our approaches, we also used the risk exposure of both requirements and risk items to prioritize tests. Stallbaum et al. [61] proposed a technique, RiteDAP (risk-based test case derivation and prioritization), that can automatically generate test case scenarios from activity diagrams and can prioritize test cases using the risks associated with fault information. In this RiteDAP approach, to quantify the risk, probability of failure for each action is estimated by the usage frequency of each action, whereas the damage (impact) caused by that particular failure is estimated through its financial losses. Yoon et al. [67] used the relationship among requirements
risk exposure, risk items, and test cases to determine the order of test cases. Another paper [38] proposed a value-based software engineering framework to improve the software testing process. The proposed multi-objective feature prioritization strategy prioritizes the new features by considering the business importance, quality risks, testing costs, and the market pressure. Further, Felderer and Schieferdecker [23] presented a framework that organizes and categorizes the risk-based testing to aid the adoption of appropriate risk-based approaches according to the circumstances. Erdogan et al. [20] conducted a systematic literature review on the combined use of risk analysis and testing. This survey identified, classified, and discussed the ex-isting approaches in terms of several factors such as main goals and the maturity levels of the approaches. For example, the survey discusses a model-based security testing approach proposed by Zech [70] using risk analysis for cloud computing environments. In Zech’s proposed approach, misuse cases are used on a model-driven approach for test code generation. These existing papers on risk-based testing demonstrate that the use of risks in the software systems can help find critical functional defects that may cause severe security or safety related issues.
Another research area that is relevant to our work is fuzzy expert systems. Fuzzy expert systems have been used in areas that require expert knowledge to make decisions while minimizing several issues, such as uncertainties and subjectivity, in the decision-making process. In general, fuzzy expert systems are applied to various domains, such as diagnosing diseases in the medical field [4, 32], risk assessment in aviation [26], risk assessment in construction projects [13], and selecting superior stocks on the stock exchange [21]. For instance, Adeli and Neshat [4] proposed a fuzzy expert system to diagnose heart disease. Recently, fuzzy expert systems have been used in software engineering areas such as software development effort prediction [5], software cost estimations [35], and risk analysis for e-commerce development [45]. For instance, Ahmed et al. [5] developed a fuzzy expert system to obtain accurate software cost and schedule estimation by managing the uncertainties and imprecision that exist in the early stages of software devel-opment. More recently, some researchers applied fuzzy expert systems to regression testing. Schwartz and Do [53] used a fuzzy expert system to determine the most cost-effective regression testing technique for dif-ferent testing environments by addressing the limitations of existing, adaptive regression testing strategies. Xu et al. [65] applied a fuzzy expert system to deal with the inaccurate and subjective issues present during the test case selection process of regression testing. In this work, we used a fuzzy expert system with re-quirements and their risk information to improve risk estimation processes, thus improving the effectiveness of test case prioritization.
3. APPROACH
In this section we describe the overall approach of our research. Our goals of this dissertation are to propose new systematic requirements and risk-based test prioritization approaches by establishing proper relationships between requirements risks and test cases to increase the effectiveness of test prioritization in regression testing and also to detect more faults early in risky components at a faster rate. To accomplish these goals, we followed the steps given below in our approach:
• Investigate the effectiveness of requirements risk-based technique in test prioritization
• Perform an empirical study which emphasized reducing the threats to validity in the previous study
• Investigate the effectiveness of requirements risk-based test prioritization on a very large industrial system
• Investigate the impact of direct use of expert systems in requirements risk-based regression testing
• Devise a new evaluation technique to measure the effectiveness of test prioritization techniques in terms of detecting more faults in risky components
3.1. Investigate the effectiveness of requirements risk-based technique in test prioritization
In the first step of our approach, we investigated the direct relationship between requirements risks and test cases in order to produce prioritized test cases for regression testing not only to detect more faults early (improve regression testing effectiveness) but also to detect more faults in risky components of software systems.
To accomplish this step, at the beginning, we identified effective risk indicators and items that reflect crucial risks in software requirements. We conducted a controlled experiment on a mid-size software system that was compatible in estimating the risks of software requirements with respect to several risk indicators and risk items. We used the impact and the likelihood of requirements risks to assess requirements’ risks and establish a direct relationship between software requirements risks and test cases in order to obtain an effective prioritized test suite.
We also devised a new evaluation technique to measure the effectiveness of the new prioritization technique in terms of detecting more faults in risky components. We applied this new evaluation technique to determine whether the proposed risk-based test prioritization technique is effective in detecting more
In this research, we found that the use of requirements and their risks can help improve the effec-tiveness of test case prioritization. We also found that the use of requirements and their risks can help early detection of faults that reside in the risky components.
This research also laid the foundation to achieve our major goals of this dissertation. Section 4.1 describes this approach in detail.
3.2. Expand the previous study reducing the threats to validity
Once we determined that our requirements risk-based approach can be effective in test prioritization, our next step was to improve our previous approach by reducing subjectivity related limitations. Therefore, in this step, we investigated how artificial intelligence techniques (Fuzzy Expert System) which are capable of emulating the reasoning of human experts can contribute to reduction of subjectivity in risk estimation that occurs when using the requirements which are specified using natural language.
To do this, we performed an empirical study using a systematic risk assessment approach which is based on a fuzzy expert system. We found that the proposed systematic, risk-based approach was capable of outdoing the control techniques used in this research including state-of-art test prioritization technique. We also found that our proposed systematic approach has the ability to detect a significantly higher number of faults in risky components at low test execution rates. With this step, we were able to further verify the effectiveness of our requirements risk-based approach.
We also expanded the controlled experiment by incorporating industrial and open source software systems and added more control techniques for the experiment. More details of this empirical study is available in Section 4.2.
3.3. Investigate the effectiveness of requirements risk-based test prioritization on a very large indus-trial system
In this step, we investigated the effectiveness of the requirements risk-based test case prioritization approach on a large industrial system. We applied and compared the performance of requirements risk-based test case prioritization approach and two other requirements-based test prioritization techniques on a very large enterprise-level cloud-based software system-as-a-service (SaaS) application.
In the empirical study, we extracted risk information from the large system to perform risk-based prioritization. Section 4.3 describes this approach in detail.
3.4. Investigate the impact of direct use of expert systems in requirements risk-based regression test-ing
Based on our findings from previous steps, we further examined the effectiveness of semi-automated requirements risk assessment techniques and the direct use of expert systems in risk estimation without ignoring the expert knowledge of risk estimation during test prioritization.
At this final step, we focused on reducing the time and cost for test prioritization while further increasing test effectiveness in a systematic way. In this way, we were able to further verify that our require-ments risk-based approach is effective and compelling in industrial settings.
From the results of this research, we found that the use of requirements risks and fuzzy expert systems can not only improve the effectiveness of test prioritization but also make the risk estimation process more efficient. We also observed that the use of fuzzy expert systems can help reduce the risk estimation process’s subjectivity. More detailed information about this empirical study is available in Section 4.4.
4. EMPIRICAL STUDIES
We performed a family of empirical studies to investigate the approaches described in Section 3. The following subsections describe each approach in detail.
4.1. Effective Regression Testing Using Requirements and Risks
The use of system requirements and their risks enables software testers to identify more important test cases that can reveal faults associated with risky components. Having identified those test cases, soft-ware testers can manage the testing schedule more effectively by running such test cases earlier so that they can fix faults sooner. A few research studies found that using risks along with requirements could improve the effectiveness of test case prioritization [14, 61, 67]. These approaches, however, have several limitations such as not considering a direct relationship between requirements risks and test cases when they prioritize test cases or improper use of requirements risks in test prioritization. In addition, these previous approaches are lack of adequate evaluation method.
To address these limitations, we propose a new test case prioritization technique that uses risk levels of potential defect types to identify risky requirements and that prioritizes test cases based on the relationship between test cases and these requirements. In this research, we implemented a the new requirements risk-based prioritization technique and evaluated it considering whether the proposed approach can detect faults earlier overall.
To evaluate our approach, we define a new evaluation method that shows how fast the reordered test cases can detect faults in the risky areas. To investigate the effectiveness of our approach, we have designed and performed an empirical study using an open source program written in Java with multiple versions and requirements documents. Our results show that the new technique is effective in finding faults early and even better in finding faults in the risky components earlier than the existing techniques.
4.1.1. Approach
In this section, we describe the prioritization approach that uses system requirements risks, which has five main steps:
1. Estimate risks by correlating with requirements 2. Calculate the risk weights for requirements
3. Calculate the risk exposure values
4. Evaluate additional factors to prioritize requirements 5. Prioritize requirements and test cases
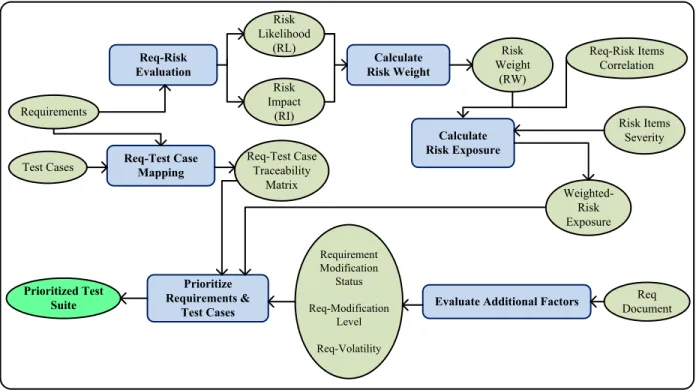
Figure 4.1 gives an overview of the proposed technique. The main steps of the approach are shown in light blue boxes while the inputs and outputs for each step are shown in the ovals. The first four steps are used for calculating requirements priorities, and the last step is used for prioritizing test cases based on the results produced by the first four steps. Note that “Req-Test Case Mapping” activity in the figure is not listed as a part of steps, but this activity is required for the last step (“Prioritize requirements and test cases”) to provide the relationship between requirements and test cases. The following subsections describe the rest of the steps in detail.
Req-Risk Evaluation Requirements Test Cases Risk Likelihood (RL) Risk Impact (RI) Req-Risk Items Correlation Calculate Risk Weight Risk Weight (RW) Calculate Risk Exposure Risk Items Severity Prioritize Requirements & Test Cases Prioritized Test Suite Req-Test Case Mapping
Evaluate Additional Factors DocumentReq
Weighted-Risk Exposure Req-Test Case Traceability Matrix Requirement Modification Status Req-Modification Level Req-Volatility
Figure 4.1. Overview of Requirements Risk-Based Approach 4.1.1.1. Estimate Risks by Correlating with Requirements
Risks related to each requirement of the system were estimated by two graduate students who have several years of software industry experience. The graduate students surveyed the risks related to software product requirements found in the literature [9, 63]. Two risk factors were considered in estimating require-ment risks; Risk Likelihood (RL) and Risk Impact (RI), which are commonly used by other researchers [7].
Not all software risks have the same impact on the software product. Some risks can be acceptable, and some can be catastrophic. Further, their probabilities of occurrence can vary. Thus, for each requirement, we estimated the probability of a risk’s occurrence associated with a requirement (RL) and the degree of the possible damage (RI) caused by a risk for a requirement.
In this experiment, to estimate the RL values, graduate students utilized risk indicators and weights as shown in Table 4.1. The four risk indicators are new requirements, potential security threats residing in the requirements, requirements complexity, and the size of the functions used to implement the requirements. The weights range from 1 to 5, with 5 being considered the highest importance. By examining these risk indicators in the system, we can understand the system’s risk level. For example, often new requirements tend to introduce new faults to the system because new requirements have not been validated yet, so having new requirements could increase the risk level. Potential security threats residing in the requirements, such as threats related to confidentiality, integrity, availability, and privacy can also increase the risk level. When requirements complexity increases, developers might misunderstand the requirements and produce a wrong product; thus, requirements complexity can affect the risk level in the system. Further, similar to require-ments complexity, large size functions that are associated with requirerequire-ments could increase the risk level by introducing unexpected errors. In our experiment, Line of code (LOC) was used to measure the size of the functions.
Table 4.1. Weights of risk indicators
Indicators Weights
New requirements 5
Potential security threats 5 Requirements complexity 3
Size 1
For each requirement, each indicator’s contribution of risk level is quantified using a scale range from 1 to 10 where 1 indicate less probability whereas 10 indicates the highest probability. The Equation 4.1 is used to calculate the RL value.
RL(Reqj)= n X
i=1
(Wi∗Rji) (4.1)
wherenis the number of indicators;Wi is the weight of the indicator, andRjiis the risk level value of the
The RL value for each requirement was calculated by two graduate students individually, and these two RL values were averaged to obtained the final RL(Avg)value. The following example shows the
cal-culation of the RL value for the UC1S1 requirement (“The health care personnel creates a patient as a new user of the system.”) and the second column of Table 4.2 shows the averaged RL values.
RL(U C1S1)= (5*0) + (5*5) + (3*5)+ (1*6)= 46
Table 4.2. Risk Weights of Requirements Requirements RL(Avg) RI(Avg) RW
UC1S1 47.5 4.75 2.26 UC2S1 46.5 8.00 3.72 UC3S4 74.5 8.75 6.52 UC6S1 57.5 6.00 3.45 UC6S2 66.5 6.75 4.49 UC8S1 52.5 4.25 2.23 UC9S1 75.5 6.25 4.72 : : : : UC34S6 67.5 5.25 3.54
The magnitude of RI for each requirement was estimated in terms of technical impact (i.e., how a potential failure related to a requirement affects the system’s performance) and the impact on target users’ activities associated with the requirement. Assuming both impact indicators are equally important RI of requirements are calculated using the Equation 4.2. For each requirement, impact level of each indicator is quantified using a scale range from 1 to 10 where 1 indicates the lowest impact and 10 indicates the highest impact level.
RI(Reqj)= (Tj+Aj)/2 (4.2)
whereTj is the technical impact level ofReqjandAj is the impact level on target user activities in terms of Reqj.
The following example shows the calculation of RI for the UC1S1 requirement. Similar to RL cal-culation, the averaged RI values are showed in the third column of Table 4.2.
RI(U C1S1)= (4 + 5)/2 = 4.5
4.1.1.2. Calculate the Risk Weights for Requirements
Using two risk weight factors that we obtained from the previous step, risk likelihood (RL) and risk impact (RI), we calculate risk weight (RW) by following Amland’s risk model [7].
The RW values are obtained using the following equation:
RW(Reqj) =RL(Avg)j∗RI(Avg)j ∗0.01 (4.3) whereRL(Avg)j is the averaged risk likelihood ofReqjandRI(Avg)j is the averaged risk impact ofReqj.
Table 4.2 shows a portion of RW values foriTrustrequirements (version 1). The RL(Avg) values
range from 0 to 140. A value of 0 indicates no likelihood of risk, whereas 140 indicates the highest like-lihood of risk. The RI(Avg) values range from 0 to 10. A value of 0 indicates no impact of risk, whereas
10 indicates the highest impact of risk. In this example, for the UC1S1 requirement, we obtained 47.5 and 4.75 as RL and RI, respectively. The RW value for UC1S1 was obtained by applying Equation 4.3 as follows:
RW(U C1S1)= 47.5*4.75*0.01 = 2.26
The RW values range from 0 to 14. A value of 0 means no risk, and 14 means the highest risk. The RW value for UC1S1 is 2.26, which indicates a low risk. In Table 4.2, UC3S4 has the highest RW (6.52), and UC8S1 has the lowest RW (2.23). In fact, the UC3S4 requirement allows a licensed health care professional (LHCP) to access laboratory results of patients, to see upcoming appointments, and to reject or accept comprehensive reports. There is a relatively high risk of misusing a patient’s confidential information, such as laboratory results, by LHCP or a hacker. Due to security and complexity related risks reside in this requirement, it obtained relatively a high RL value. If the confidentiality of patients’ sensitive data are breached or patients’ privacy is violated, severe consequences such as monetary and reputation losses may occur. The performance of the system may go down and the users of the system may not be able to use some functionalities. Thus, the requirement obtained a relatively high RI value.
4.1.1.3. Calculate the Risk Exposure Values
So far, we explained how to calculate RW values for the requirements. Although the RW values of the requirements illustrate how risky each requirement is in terms of the risks identified for the requirements themselves, RW does not provide information about whether the requirements are associated with potential defect types of the system. (Note: One particular requirement can be associated with multiple defect types,
which indicates that such a requirement has a high potential to expose several defects.) Using this informa-tion, we can identify the requirements that are related to common failures of a software product, thus we can assign high priorities, which will be used in prioritizing test cases to such requirements.
To obtain such information, we adopted the process defined by Yoon et al. [67], and improved it by considering weights for each risk item based on our experiences. The modified process is as follows: (1) Identify software risk items (RiIM) as shown in Table 4.3. Risk items are potential defect types of a particular system. We used software risk items derived from studies based on different applications and standards [9, 30, 63]. The input problem is one example. During system operation, input data can cause several problems. For instance, a system may crash or perform erroneously if the input data are not validated before they are executed or if the data are beyond the valid boundary.
(2) Calculate risk exposure values for the risk items. Here, risk exposure (RE) values quantify the risk level for the risk items.
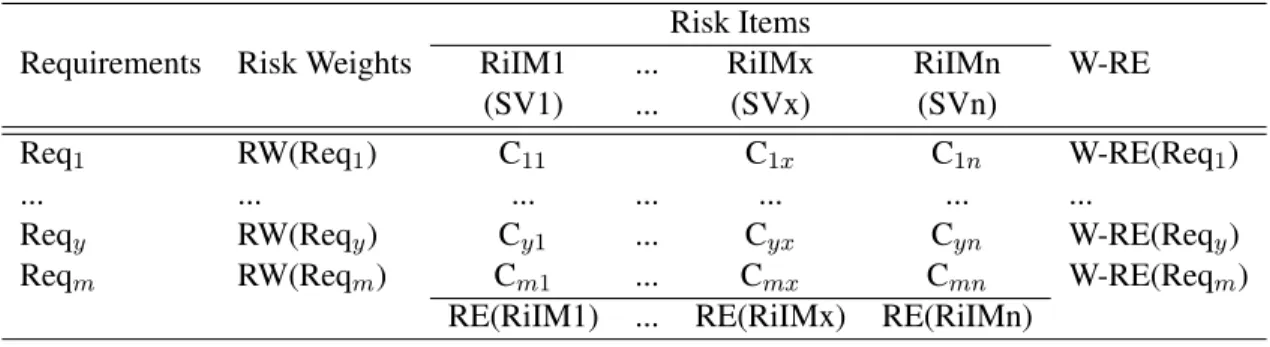
To find the probability of fault occurrence, we considered the association of risk items and re-quirements. A requirement may associate with several risk items. A risk item can have many requirements associated with it. When a particular risk item associated with more requirements, its probability of fault oc-currence will increase. In order to determine the impact of risk items, the risk weight (RW) of requirements is employed. The impact of risk items increase when its associated requirements have high risk weights. Table 4.4 shows a matrix to calculate the risk exposure (RE) values for risk items and the weighted risk exposure (W-RE) values for requirements.
Table 4.3. Software product-risk items Risk Item Abbreviation Input Problem IP
Output Problem OP
Calculation Calc
Interactions Inac Error Handling ErHa Startup/ShutDown St/Sh
The matrix lists requirements, risk weights for requirements, and a set of risk items. Each risk item (RiIMx) has a severity value (SVx) that indicates how risky the item is. The severity values are defined
in Table 4.5. If a risk item is associated with a certain requirement, the Cmx value is 1; otherwise, the
Table 4.4. Risk Exposure and Weighted Risk Exposure Matrix Risk Items
Requirements Risk Weights RiIM1 ... RiIMx RiIMn W-RE
(SV1) ... (SVx) (SVn)
Req1 RW(Req1) C11 C1x C1n W-RE(Req1)
... ... ... ... ... ... ...
Reqy RW(Reqy) Cy1 ... Cyx Cyn W-RE(Reqy)
Reqm RW(Reqm) Cm1 ... Cmx Cmn W-RE(Reqm)
RE(RiIM1) ... RE(RiIMx) RE(RiIMn)
matrix shows RE values for risk items, and RE values are calculated using Equation 4.4; the last column shows W-RE values that are calculated by incorporating RE values with severity values of risk items for each requirement. The final outcome of this step, the W-RE values, is used to prioritize requirements.
Equations 4.4 and 4.5 are used to calculate the risk exposure values for risk items and the weighted risk exposure values for requirements.
RE(RiIMx) = m X
i=1
(RW(Reqy)∗Cyx) (4.4)
wheremis the number of requirements,RW(Reqy)is the risk weight ofReqy, andCyxis 1 when requirement Reqy is associated with the risk itemRiIMxor 0 otherwise.
W −RE(Reqy)= n X
i=1
(RE(RiIM x)∗Cyx∗SVx) (4.5)
wherenis the number of risk items for the system;RE(RiIM x)is the risk exposure value of the risk item,
RiIMx;Cyxindicates the correlation between the requirement,Reqy, and the risk item,RiIMx; andSVx
is the severity value of the risk item,RiIMx.
Table 4.5. Severity of risk items Severity Value Description
1 Slightly critical risk item 2 Moderately critical risk item 3 Very critical risk item 4 Most critical risk item
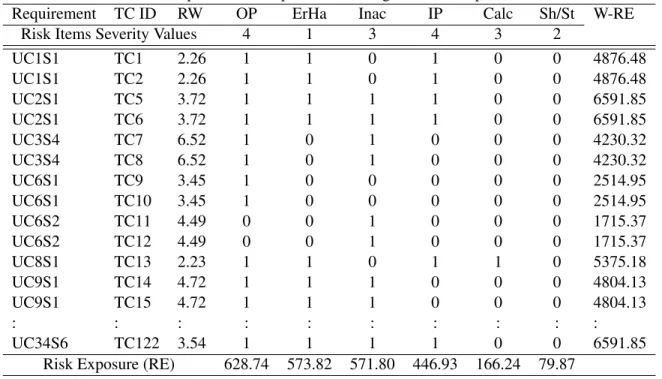
Table 4.6 shows a sample data set collected from our experiment. In this example, we can see that the output problem risk item is associated with all requirements except for UC6S2. Thus, the risk exposure value of the output problem risk item can be calculated by using Equation 4.4 as follows:
Table 4.6. Example of Risk Exposure and Weighted Risk Exposure of iTrust
Requirement TC ID RW OP ErHa Inac IP Calc Sh/St W-RE
Risk Items Severity Values 4 1 3 4 3 2
UC1S1 TC1 2.26 1 1 0 1 0 0 4876.48 UC1S1 TC2 2.26 1 1 0 1 0 0 4876.48 UC2S1 TC5 3.72 1 1 1 1 0 0 6591.85 UC2S1 TC6 3.72 1 1 1 1 0 0 6591.85 UC3S4 TC7 6.52 1 0 1 0 0 0 4230.32 UC3S4 TC8 6.52 1 0 1 0 0 0 4230.32 UC6S1 TC9 3.45 1 0 0 0 0 0 2514.95 UC6S1 TC10 3.45 1 0 0 0 0 0 2514.95 UC6S2 TC11 4.49 0 0 1 0 0 0 1715.37 UC6S2 TC12 4.49 0 0 1 0 0 0 1715.37 UC8S1 TC13 2.23 1 1 0 1 1 0 5375.18 UC9S1 TC14 4.72 1 1 1 0 0 0 4804.13 UC9S1 TC15 4.72 1 1 1 0 0 0 4804.13 : : : : : : : : : : UC34S6 TC122 3.54 1 1 1 1 0 0 6591.85
Risk Exposure (RE) 628.74 573.82 571.80 446.93 166.24 79.87
Because the output problem has a high RE value compared to other risk items, it implies that the output problem is a highly risky area for this product.
After calculating RE values, we calculate the W-RE values for each requirement by following Equa-tion 4.5. For instance, we obtain the W-RE value for UC1S1 as follows.
W-RE(U C1S1) = (628.74*1*4) + (573.82*1*1) + (571.80*0*3) + (446.93*1*4) + (166.24*0*3) + (79.87*0*2) = 4876.48
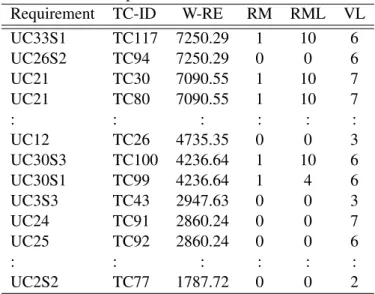
After calculating the W-RE values for requirements, we prioritize requirements by their W-RE in descending order. Table 4.7 shows a portion of our data. From the table, we can see that each requirement has one or more corresponding test cases (the last subsection explains how to map these two) and requirements are appeared by their W-RE in descending order. When multiple requirements have the same value (e.g., UC33S1 and UC26S2 have the same value, 7250.29, in the table), we need to decide which one should be picked first among others. To aid that process, we consider additional factors for prioritization, and the next section explains them.
4.1.1.4. Evaluate Additional Factors to Prioritize Requirements
We utilize the W-RE values as a primary factor to prioritize requirements, but if multiple require-ments have the same value, we need to have a way to break the tie. One simple way is to randomly choose a candidate and repeat the process until all remaining requirements with the same value are chosen. In
Table 4.7. Example of Prioritized Test Suite - iTrust
Requirement TC-ID W-RE RM RML VL
UC33S1 TC117 7250.29 1 10 6 UC26S2 TC94 7250.29 0 0 6 UC21 TC30 7090.55 1 10 7 UC21 TC80 7090.55 1 10 7 : : : : : : UC12 TC26 4735.35 0 0 3 UC30S3 TC100 4236.64 1 10 6 UC30S1 TC99 4236.64 1 4 6 UC3S3 TC43 2947.63 0 0 3 UC24 TC91 2860.24 0 0 7 UC25 TC92 2860.24 0 0 6 : : : : : : UC2S2 TC77 1787.72 0 0 2
this study, however, we consider three factors that can be potentially effective in finding error-prone re-quirements [8, 25, 36, 58]: requirement modification status, level of modification, and level of requirement volatility.
Requirement modification and its modification level were determined by comparing two consecutive versions. For new requirements, we assigned the highest level of modification because new requirements can cause serious source code modifications and can introduce new faults to the system [8]. Volatile re-quirements are susceptible to have faults in later versions of the system. However, the impact of volatile requirements in terms of introducing system faults is relatively low compared to requirement modifications. We used modification status as the second factor for prioritization, followed by the level of modification and the level of requirement volatility. If the requirements are still tied after applying all the factors, they are ordered randomly.
Table 4.7 shows the values for these three factors applied to each requirement. RM, requirement modification status, has two values to indicate whether the requirement is modified (1) or not (0). RML indicates the level of modification. VL indicates the level of requirements volatility. These values ranges from 0 to 10. The value 0 indicates the lowest level and 10 indicates the highest level. Again, for the first two requirements, UC33S1 and UC26S2, in the table, because they have the same W-RE value, their priority is decided by comparing the next factor, RM. UC33S1 has 1 and UC26S2 has 0 for RM, so UC33S1 is picked first for prioritization.
4.1.1.5. Prioritize Requirements and Test Cases
After collecting all the values we described, we prioritize requirements using the W-RE values and the additional factors. Next, to obtain prioritized test cases, we need a traceability matrix that shows mapping relationships between requirements and test cases. In our case, we used the traceability matrix that came withiTrust. (The developers created requirements and tests mapping information).
Often, multiple test cases are created for a single requirement, meaning that the prioritization values for all tests with the same requirement are the same. Thus, after mapping test cases to their corresponding requirements, we randomly order tests with the same priority. ForiTrust, only one or two test cases are associated with the same requirement.
4.1.2. Empirical Study
In this study, we investigate the following research questions:
RQ1: Can requirements risk-based test case prioritization improve the rate of fault detection for test suites? RQ2: Can requirements risk-based test case prioritization find more faults in the risky components early?
4.1.2.1. Object of Analysis
Table 4.8. Experiment Object and Associated Data
Versions Size Requirements Test Mutation Mutation
(KLOCs) Cases Faults Groups
v1 24.42 91 122 54 13
v2 25.93 105 142 71 12
v3 26.70 108 157 75 12
An open source application(iTrust)was utilized for this experiment. TheiTrustprogram is a patient-centric electronic health record system which was developed by the RealSearch Research Group at North Carolina State University. Four versions of the iTrust system (version 0, 1, 2, and 3) were used in our experiment. The test cases used in this study were functional test cases associated with requirements and written byiTrustsystem developers. Each version’s metrics are listed in Table 4.8. The metrics forv0, which is the base version of iTrust, are not listed in the table because regression testing starts with the second release of the system. We, however, use information from v0 to obtain mutants forv1. Our experiment requires faults in the program, so we utilize mutation faults from our previous study [8].
4.1.3. Variables and Measures 4.1.3.1. Independent Variable
Our study manipulated one independent variable, test case prioritization technique. We considered four control techniques and one heuristic prioritization technique as follows:
• Control Techniques
– Original (Torig): The object program provides the testing scripts. Torigexecutes test cases in the order in which they are available in the original testing script.
– Code metric (Tcm): This technique uses a code metric that we defined in our previous study [8]. The code metric is calculated using three types of information obtained from source code, Line of Code (LOC), Nested Block Depth (NBD), and McCabe Cyclomatic Complexity (MCC), which are considered good predictors for finding error-prone modules [52, 69].1
– Requirements-based clustering: We consider two requirements-based clustering techniques pro-posed by Arafeen and Do [8] as follows:
∗ Tcl-orig-prior (Tcop): This technique uses the original test case order for prioritization and the prioritized cluster order for selection.
∗ Tcl-cm-prior (Tccp): This technique uses the code metric for prioritization and the priori-tized cluster order for selection.
The previous study [8] used several cluster sizes, but in this study, to simplify the comparisons, we chose cluster sizes of 10 and 20 which showed moderate and the best results, respectively.
• Heuristic (Trrb): The heuristic technique uses requirements and their risks to prioritize test cases as described in Section 4.1.1.
4.1.3.2. Dependent Variables
We considered two dependent variables as follows:
• Average Percentage of Fault Detection (APFD): The APFD [18, 41, 50] value represents the average for the percentage of fault detection during the execution of a particular test suite. The APFD values range from 0 to 100 and are monitored during test suite execution and represent the area under the curve by plotting percentage of faults detected on the y-axis of a graph, and percentage of test suite
1
run on the x-axis. The prioritization techniques are being considered as better techniques when their APFD values are closer to 100, and the technique that obtains the highest APFD value is considered to be the best prioritization technique. LetT be a test suite containingntest cases, and letF be a set ofmfaults revealed byT. LetT Fibe the first test case in orderingT0ofT, which reveals faulti. The
APFD value for test suiteT0is given by the equation:
AP F D= 1−T F1+T F2+· · ·+T Fm
nm +
1 2n
To illustrate this measure, consider an example program with 10 faults and a test suite of five test cases, A through E, with fault detecting abilities, as shown in Figure 4.2. Suppose we order the test cases as C-E-B-A-D. After executing test case C, we have uncovered 70% of the faults while utilizing only 20% of the test cases. Next, when test case E is run we have uncovered 100% of the faults while executing only 40% of the test cases. In contrast, if we order the test cases as E-C-B-A-D, after running test case E we uncover 30% of the faults. Next, after running test case C we uncover 100% of the faults. The area inside the rectangles represents the weighted percentage of faults detected over the fraction of the test suite executed. The solid lines represent the gain in detecting the percentage of faults. The area under the curve represents the weighted Average Percentage of Faults Detected (APFD). A higher APFD score indicates higher rate of fault detection. Thus, in this case ordering test cases as C-E-B-A-D yields a better APFD score of 84% than ordering test cases as E-C-B- A-D that yields an APFD score of 76%.
• Percentage of Total Risk Severity Weight (PTRSW): PTRSW shows how effective the test suite is for finding more faults in the system’s risky components as early as possible. The PTRSW value ranges from 0% to 100%. If we run all test cases, the PTRSW value reaches 100%. If we execute a portion of the test cases by stopping at a certain point, the PTRSW value is under 100% and the higher the value is, the better the technique is. The following equation shows how to calculate PTRSW:
PTRSW = (TRSW/GTRSW)*100%
The Total Risk Severity Weight (TRSW) and the Grand Total Risk Severity Weight (GTRSW) are explained in detail in the following section.
100 90 80 70 60 50 40 30 20 10 0
Test Case Order: C-E-B-A-D Test Case Order: E-C-B-A-D
Test Suite Fraction Test Suite Fraction
Perce nt D et ect ed Fa ul ts P er cen t D et ect ed Fa ul ts
Test
Fault
1
2
3
4
5
6
7
8
9
10
A
X
X
B
X
X
C
X
X
X
X
X
X
X
D
X
E
X
X
X
0 0.2 0.4 0.6 0.8 1.0 0 0.2 0.4 0.6 0.8 1.0 100 90 80 70 60 50 40 30 20 10 0 APFD = 76% Area = 84%Figure 4.2. APFD Example (Rothermel et al.) 4.1.4. Experimental Setup and Procedure
The requirements risk-based approach requires several types of information, such as requirements-tests mapping information, requirements modification information, risk exposure (RE) and weighted risk exposure (W-RE) values, requirements-classes/methods association information, and fault-test association information.
The test cases and requirements-tests mapping information came withiTrust. To obtain require-ments modification information, we manually inspected the requirerequire-ments across all versions. Risks associ-ated with the requirements were estimassoci-ated and documented as explained in Section 4.1.1.
The RE values for the risk items and the W-RE values for requirements were obtained using the steps explained in Section 4.1.1. To obtain fault data for this experiment, a set of mutation faults created in the previous study [8] was used. We created mutant groups by randomly choosingnmutation faults (between 1 and 10) from those available with that particular version of the program. We repeated this process for each version, and we obtained 13, 12, and 12 mutant groups for v1, v2, and v3, respectively. Because we need to
know the locations for the mutation faults to measure PTRSW, we used the ByteMe mutation analysis tool to identify the classes and methods altered by mutation faults.
To locate the requirements affected by the modification, using the mutation analysis tool, we built a requirements-classes/methods trace file that shows which classes and methods were used to implement a particular requirement. This information, along with the requirements risks, was used to estimate risks for system classes. In this way, a risk caused by a particular mutation fault in a system component was estimated, and the Risk Severity Weight (RSW) value was assigned to the mutation fault. The RSW value ranges between 0 and 10. RSW is 0 if a mutation fault does not cause any risk, and it becomes 10 if a mutation fault causes severe risks in a critical component.
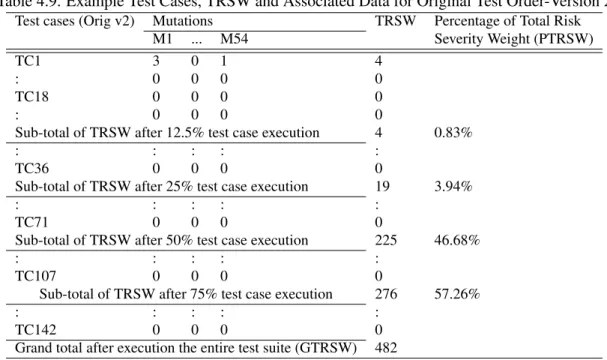
Table 4.9. Example Test Cases, TRSW and Associated Data for Original Test Order-Version 2 Test cases (Orig v2) Mutations TRSW Percentage of Total Risk
M1 ... M54 Severity Weight (PTRSW)
TC1 3 0 1 4
: 0 0 0 0
TC18 0 0 0 0
: 0 0 0 0
Sub-total of TRSW after 12.5% test case execution 4 0.83%
: : : : :
TC36 0 0 0 0
Sub-total of TRSW after 25% test case execution 19 3.94%
: : : : :
TC71 0 0 0 0
Sub-total of TRSW after 50% test case execution 225 46.68%
: : : : :
TC107 0 0 0 0
Sub-total of TRSW after 75% test case execution 276 57.26%
: : : : :
TC142 0 0 0 0
Grand total after execution the entire test suite (GTRSW) 482
A mutation fault is detected by one or more test cases. When multiple test cases detect the same mutation fault, all those test cases are assigned the same RSW value. Also, a single test case can detect multiple mutation faults. In that case, all RSW values for the associated mutation faults are added to obtain the Total Risk Severity Weight (TRSW) for that test case. The TRSW values for test cases are summed to get the Grand Total Risk Severity Weight (GTRSW) for the test suite. Table 4.9 shows sample RSW, TRSW, and GTRSW values calculated for the original test order ofiTrustVersion 2. Columns 2, 3, and 4 contain RSW values of sample test cases. For example, when we execute 12.5%, 25%, 50%, and 75% of the original order of test cases, the PTRSW values are 0.83%, 3.94%, 46.68%, and 57.26%, respectively. As we can
see from the results in the next section, these values are relatively low compared to other techniques, which means the original order of test cases is not able to detect faults in the risky components early.
After collecting all the required data, we performed prioritization techniques. We calculated the APFD and PTRSW values for each test case obtained from the techniques.
4.1.5. Data and Analysis
In this section, we present the results of our study and data analyses for each research question. (We discuss further implications of the data and results in Section 4.1.6.)
4.1.5.1. The effectiveness of requirements risk-based prioritization for improving the rate of fault detection of test cases (RQ1)
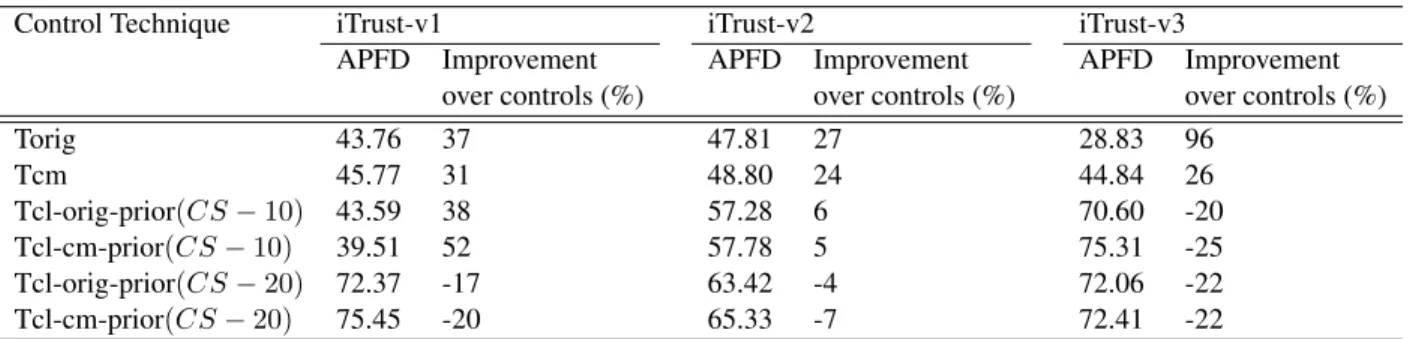
Our first research question (RQ1) considers whether a requirements risk-based approach can help improve the effectiveness of test case prioritization. To answer this question, we compare techniques based on the results shown in Table 4.10. The first column in the table lists the control techniques. CS-10 and CS-20 in the cluster-based techniques denote the cluster size that we explained in Section 4.1.3.1. The second column represents the average APFD value of each control technique for version 1, and the third column shows the improvement rates of our requirements risk-based approach over the control techniques. Subsequent columns repeat the same format (APFD values of the controls and the heuristic’s improvement rates over the controls) for versions 2 and 3.
The results in Table 4.10 indicate that requirements risk-based prioritization outperformed the first two control techniques (Torig and Tcm) across all versions; the improvement rates ranged from 24% to 96%. In the case of cluster-based control techniques, the results varied. At a cluster size of 10 (CS-10), the heuristic outperformed the controls for the first two versions, but for version 3, it was not better than the controls. At a cluster size 20 (CS-20), the heuristic did not yield improvement over the controls.
Table 4.10. APFD Comparison And Improvement Over Controls
Control Technique iTrust-v1 iTrust-v2 iTrust-v3
APFD Improvement APFD Improvement APFD Improvement over controls (%) over controls (%) over controls (%)
Torig 43.76 37 47.81 27 28.83 96 Tcm 45.77 31 48.80 24 44.84 26 Tcl-orig-prior(CS−10) 43.59 38 57.28 6 70.60 -20 Tcl-cm-prior(CS−10) 39.51 52 57.78 5 75.31 -25 Tcl-orig-prior(CS−20) 72.37 -17 63.42 -4 72.06 -22 Tcl-cm-prior(CS−20) 75.45 -20 65.33 -7 72.41 -22
Torig Tcm Tcop- 10 Tccp- 10 Tcop- 20 Tccp- 20 Trrb Torig Tcm Tcop- 10 Tccp- 10 Tcop- 20 Tccp- 20 Trrb Torig Tcm Tcop-10 Tccp-10 Tcop-20 Tccp-20 Trrb | | | | | | | | | | | | | | | | | | | | | 100- 75- 50- 25-
Version 1 Version 2 Version 3
Figure 4.3. APFD Boxplots for All Controls and Heuristic
To visualize our results, we illustrate them in boxplots as shown in Figure 4.3, which presents the APFD values for all techniques and versions. The horizontal axis corresponds to the techniques while the vertical axis represents the APFD values. Each boxplot for version 1 has 13 data points, and for versions 2 and 3, 12 data points are presented.
Examining the boxplots, we observe similar trends from the tables (average values). For versions 1 and 2, the heuristic outperformed the control techniques except for two cases, and for version 3, the heuristic only outperformed two control techniques. The boxplots for version 1 show a wider distribution than the other two versions, and the distance between the minimum and maximum values is very wide forTcop-20andTrrb. For version 2, the data distributions across techniques are similar, and they do not show extremely low or high values unlike the results for version 1. For version 3, the control techniques that used clustering with a cluster size of 10 show a wider distribution than other techniques. When we examined theiTrustrequirements, we found that newly added requirements caused a considerable number of code modifications. The cluster based prioritization technique used code modification information and requirement implementation priority as the primary criteria to prioritize requirement clusters. This factor might have influenced the cluster based approach to produce better results over our approach.
4.1.5.2. The effectiveness of requirements risk-based prioritization for finding faults associated with risky components (RQ2)
With RQ1, we examined whether prioritization that utilizes requirements and their risks can be effective at finding faults earlier. The results are encouraging, but we do not know whether the early detected faults are, indeed, the faults that reside in the risky components. Thus, our second research question (RQ2) considers whether the requirements risk-based approach can be more effective in finding faults associated with risky components early compared to the control.
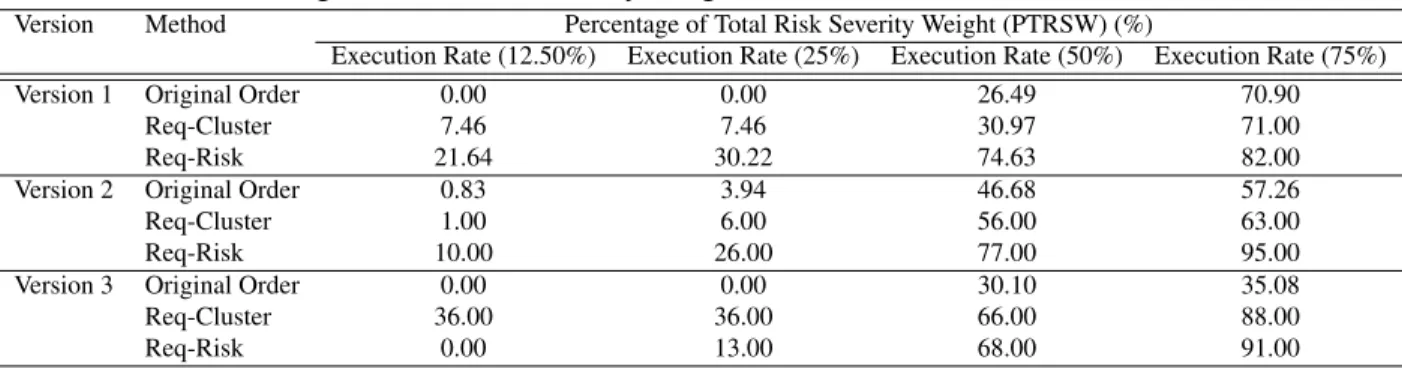
To investigate this research question, we measured the PTRSW values that we described in Sec-tion 4.1.3.2, which show how fast the technique can detect faults in the risky components. For this eval-uation, we considered two control techniques: original (Torig) that produced lowest APFD value and the cluster-based technique with a cluster size of 20 that produced the best results (Tccp) for the RQ1. Ta-ble 4.11 shows the results when we foreshorten the test execution process by 12.5%, 25%, 50%, and 75%. This means that, for a 50% cutting ratio, we simulate the effects of having the testing process halted half way through.
The results show that our risk based approach can detect more faults in the risky components early than the controls except for two cases (Tccpat 12.5% and 25% execution rates for version 3). In particular, our approach produced relatively high fault detection rates at 50% for version 1 and 75% for version 2. These results indicate that the use of requirements risks during prioritization was effective in locating faults that reveal risks early. Further, even when companies need to cut their testing process short due to their product release schedule, still can identify and fix more important faults under the limited time, budget than otherwise.
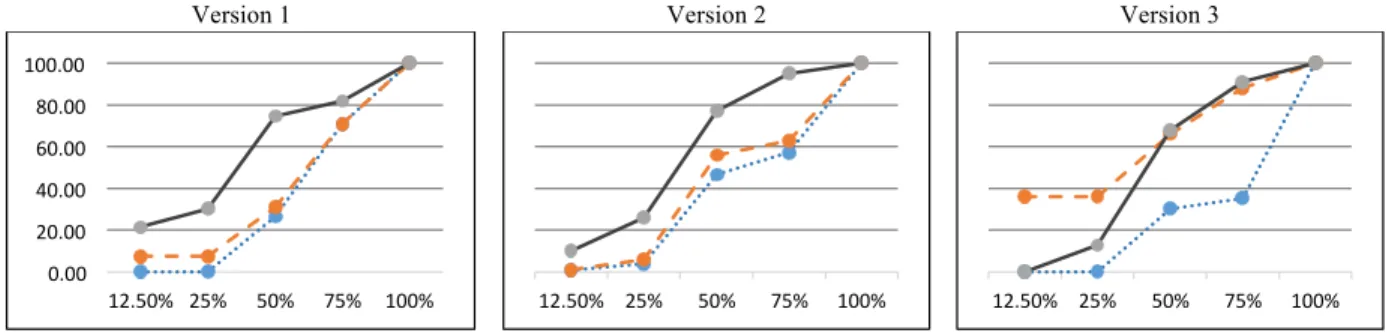
Figure 4.4 shows the results graphically. The horizontal axis shows the percentage of test execution, and the vertical axis represents the PTRSW values. This figure includes the results for a 100% test execution rate. As we observed from the Table 4.11, our approach outperforms the controls at all percentage levels for versions 1 and 2, but for version 3, our approach is not better thanTccpunder the 50% test execution rate. Again, we speculate that using code modification information worked better for version 3 because version 3 underwent a major code modification that included a large number of requirements changes. From this observation, we think that combining our approach with code modification information for versions that go through major changes could improve the outcome.
Table 4.11. Percentage of Total Risk Severity Weight (PTRSW) for Different Test Execution Levels
Version Method Percentage of Total Risk Severity Weight (PTRSW) (%)
Execution Rate (12.50%) Execution Rate (25%) Execution Rate (50%) Execution Rate (75%)
Version 1 Original Order 0.00 0.00 26.49 70.90
Req-Cluster 7.46 7.46 30.97 71.00
Req-Risk 21.64 30.22 74.63 82.00
Version 2 Original Order 0.83 3.94 46.68 57.26
Req-Cluster 1.00 6.00 56.00 63.00
Req-Risk 10.00 26.00 77.00 95.00
Version 3 Original Order 0.00 0.00 30.10 35.08
Req-Cluster 36.00 36.00 66.00 88.00
Version 1 Version 2 Version 3
! ! !
Req-Risk Req-Cluster Original Order
! Editable!graphs! ! ! ! ! ! ! ! 0.00! 20.00! 40.00! 60.00! 80.00! 100.00! 12.50%! 25%! 50%! 75%! 100%! 12.50%! 25%! 50%! 75%! 100%! 12.50%! 25%! 50%! 75%! 100%! 0.00! 20.00! 40.00! 60.00! 80.00! 100.00! 120.00! 12.50%! 25%! 50%! 75%! 100%! 12.50%! 25%! 50%! 75%! 100%! 12.50%! 25%! 50%! 75%! 100%!
Figure 4.4. PTRSW Comparison Graphs for All Versions of iTrust 4.1.6. Discussion and Implications
From our results, we drew the following observations. First, our results suggest that the use of requirements and their risks can help improve the effectiveness of test case prioritization. The proposed technique performed better than techniques that used original order and source code information, but for the clustering techniques, the results were not consistent (in particular, for version 3). As we discussed in Section 4.1.5, we speculate that the use of prioritization factor and code change pattern in version 3 affected this outcome. The source code of version 3 was considerably affected by requirements changes. For this situation, the use of code modification information (e.g., code metric) would work better in identifying test cases that exercise more error-prone components. This observation indicates that we might need to consider different test case prioritization factors under different circumstances.
Second, our study results strongly support the conclusion that the use of requirements and their risks can help early detection of faults that reside in the risky components. The requirements associated with the critical risk items are assigned high priorities and those requirements are further prioritized depending on the degree they correlate with additional requirement-risks related factors (requirements modification and volatility). Hence, test cases associated with requirements having more risky behaviors get top priorities in the test suite, and this mechanism is the primary reason for the successful early detection of faults that reside in the risky components.
The results of the study provide important implications for software industry. Typically, companies that build safety or mission critical systems spend enormous time and effort in testing because the con-sequences of system failure often involve high costs and can even be life threatening. Also, the majority of modern software systems are web-based and deployed through the internet. This means that software systems are vulnerable to various security attacks, and thus they require thorough testing. For both cases,
finding critical faults early plays an important role in producing reliable systems more cost-effectively. Fur-ther, as we discussed in the previous section, the proposed technique was able to detect more critical faults early under the limited time slots. Thus, using our approach, companies can manage their production sched-ule more effectively by fixing costly faults as early as possible.
4.1.7. Threats to Validity 4.1.7.1. Construct Validity
The risk identification is subject to human judgment (in our case, graduate students). Therefore, the results can be biased by the personnel’s knowledge and experience. Control for this threat can be achieved through applying our approach to the industrial environment with various stakeholders (i.e., software devel-opers, testers, system users, etc.) who can perform such task.
4.1.7.2. Internal Validity
In this study, we assumed that there are no project or process risks associated with the requirements. We only considered the software product risk category when evaluating the RE of risk items. This assump-tion potentially influences the effectiveness of the technique but can be minimized by considering more product risk items.
4.1.7.3. External Validity
Our experiment used theiTrustsystem, a mid-size, open source application which has requirements documents. This limitation to generalization can be addressed by using different sizes of industrial applica-tions with future studies. However, applying our approach to large industrial applicaapplica-tions might not be ideal because large systems could consist of thousands of requirements and thus performing risk estimations with such a large number of requirements would be a very time consuming process. Under such circumstances, we can identify a set of subsystems that have potential risks and apply our approach to those subsystems. 4.1.8. Conclusions
In this research, we proposed a new test case prioritization method, which is based on requirements risks information, and assessed the approach by comparing other existing techniques. Our results indicated that the requirements risk-based prioritization can be effective in detecting faults early and even better in locating faults with the risky components early. With the proposed approach, software companies can manage their testing and release schedules better by providing early feedback to testers and developers so that they can fix the problems as soon as possible.