rsif.royalsocietypublishing.org
Research
Cite this article:
Ahnert SE, Fink TMA. 2016
Form and function in gene regulatory
networks: the structure of network motifs
determines fundamental properties of their
dynamical state space.
J. R. Soc. Interface
13:
20160179.
http://dx.doi.org/10.1098/rsif.2016.0179
Received: 2 March 2016
Accepted: 23 June 2016
Subject Category:
Life Sciences – Physics interface
Subject Areas:
biocomplexity, bioinformatics, systems biology
Keywords:
network motif, Boolean network, feed-forward
loop, gene regulatory network, basin entropy
Author for correspondence:
S. E. Ahnert
e-mail: [email protected]
Electronic supplementary material is available
at http://dx.doi.org/10.1098/rsif.2016.0179 or
via http://rsif.royalsocietypublishing.org.
Form and function in gene regulatory
networks: the structure of network motifs
determines fundamental properties of
their dynamical state space
S. E. Ahnert
1and T. M. A. Fink
21Theory of Condensed Matter Group, Cavendish Laboratory, University of Cambridge, JJ Thomson Avenue,
Cambridge CB3 0HE, UK
2London Institute of Mathematical Sciences, 35A South Street, London W1K 2XF, UK
Network motifs have been studied extensively over the past decade, and certain motifs, such as the feed-forward loop, play an important role in regu-latory networks. Recent studies have used Boolean network motifs to explore the link between form and function in gene regulatory networks and have found that the structure of a motif does not strongly determine its function, if this is defined in terms of the gene expression patterns the motif can produce. Here, we offer a different, higher-level definition of the ‘function’ of a motif, in terms of two fundamental properties of its dynamical state space as a Boolean network. One is the basin entropy, which is a complexity measure of the dynamics of Boolean networks. The other is the diversity of cyclic attractor lengths that a given motif can produce. Using these two measures, we examine all 104 topologically distinct three-node motifs and show that the structural properties of a motif, such as the presence of feedback loops and feed-forward loops, predict fundamental characteristics of its dynamical state space, which in turn determine aspects of its functional versatility. We also show that these higher-level properties have a direct bearing on real regulatory networks, as both basin entropy and cycle length diversity show a close correspondence with the prevalence, in neural and genetic regulatory networks, of the 13 con-nected motifs without self-interactions that have been studied extensively in the literature.
1. Introduction
Network motifs, which are small subgraphs of directed networks, have been the subject of much research over the past decade [1,2], and certain motifs, such as the feed-forward loop, are known to play an important role in gene regulatory networks [3]. It has been shown that some motifs appear much more frequently than others in real-world networks, and that the signatures of their relative enrichments with respect to a null model are similar for wide classes of networks. Motifs can thus be used to classify networks into ‘super-families’ [2]. In a parallel development, Boolean networks, which were originally studied in the context of large random networks [4,5], have emerged as models of specific gene regulatory networks, particularly in the context of plant development [6,7] and the cell cycle [8,9]. While the relative prevalences of network motifs can be understood as a topological, static property of a net-work, Boolean networks offer a way to measure the dynamical capability of a network. In this work, we study the Boolean dynamics of network motifs in order to explore the relationship between structure and dynamics, and, more broadly, between form and function. In biology, the form of the phenotype is often strongly determined by its function. This is true at the level of organisms, which exhibit a remarkable degree of specialization according to the
&
2016 The Authors. Published by the Royal Society under the terms of the Creative Commons Attribution License http://creativecommons.org/licenses/by/4.0/, which permits unrestricted use, provided the original author and source are credited.characteristics of their environment, such as their predators (e.g. in the form of camouflage) and prey (e.g. the anteater’s snout). It also holds true down to the molecular level, at which proteins evolve in order to form protein complexes of very specific structures [10,11]. It seems reasonable that a link between form and function should also hold in biological networks, which is why the existence of such links has been investigated in the recent literature [12 –14], including through Boolean networks of network motifs [15]. The results of this work have suggested that the form and function of network motifs are not closely linked because: (i) the struc-ture of network motifs does not strongly determine its functional versatility, if this is defined in terms of initial and final states and (ii) a given functional task (again defined in terms of initial and final states) can be performed by more than one structure. Earlier work in this direction, employing other models, has similarly found that the structure of a motif does not determine its function, if ‘function’ is defined in terms of the variety of gene expression patterns that can be produced by the motif [12–14].
In this work, we examine the link between the form and function of network motifs differently, by defining their func-tional versatility in terms of two structural properties of their dynamical attraction basins. The first property is basin entropy, which serves as a measure of dynamical complexity in Boolean networks [16,17]. The second is the number of different attractor cycle lengths that can be realized in state space for a given network motif. We show that both of these measures strongly depend on the presence of feedback loops and feed-forward loops in the motif. These two loops are the simplest triangle motifs and have been shown to play an important role in biological regulatory networks [2,3,18]. In particular, we demonstrate that motifs containing a three-node feedback loop have increased basin entropy and a larger diversity of attractor cycle lengths. By contrast, motifs that contain a feed-forward loop and no three-node feedback loop have particularly low basin entropy and low cycle length diversity. Finally, we connect these results to the frequencies of motifs in real-world gene regulatory net-works and signal-transduction netnet-works [2]. We show that both basin entropy and cycle length diversity are inversely correlated with the relative enrichment of network motifs, meaning that motifs containing feedback loops are suppressed in real-world regulatory networks. In summary, the structu-ral properties of network motifs strongly determine their functional versatility as regulatory circuits, if we define this functional versatility in terms of attractor properties.
2. Boolean dynamics of network motifs
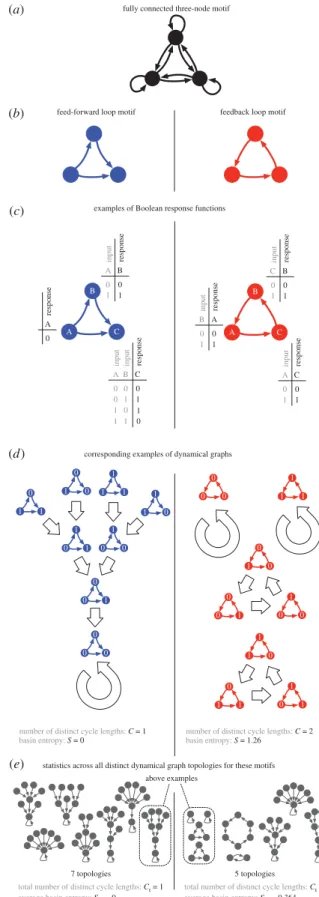
The fully connected three-node network motif with all nine possible edges is depicted in figure 1a, while figure 1bshows examples of two simpler three-node network motifs with just three edges: a feed-forward loop and a three-node feedback loop. Similar to Payne & Wagner [15], we study the dynamics of such three-node network motifs using Boolean dynamics. A Boolean network is a directed network in which each node has a binary state (0 or 1), and each node withkinputs is associ-ated with a string of 2k bits. This string, a so-called Boolean
function, is an update rule. In each time step, all nodes are updated according to their Boolean function, which specifies the state of the node for any of the 2kpossible combinations
B A C B A C A B 0 1 0 1 input response A C 0 0 0 1 input response B 0 1 input 1 1 0 1 1 0 A 0 response C B 0 1 0 1 input response A C 0 1 0 1 input response B A 0 1 0 1 input response 1 1 1 1 1 1 0 1 0 1 0 1 0 0 1 0 0 0 1 0 0 1 1 0 0 1 1 0 0 0 0 1 0 0 0 1 1 0 0 1 1 0 0 1 1 1 0 1
number of distinct cycle lengths: C = 1
basin entropy: S = 0
number of distinct cycle lengths: C = 2
basin entropy: S = 1.26 fully connected three-node motif
feed-forward loop motif feedback loop motif
examples of Boolean response functions
total number of distinct cycle lengths: Ct = 1
average basin entropy: Sav = 0
total number of distinct cycle lengths: Ct = 4
average basin entropy: Sav = 0.364 corresponding examples of dynamical graphs
(a)
(b)
(c)
(d)
(e) statistics across all distinct dynamical graph topologies for these motifs above examples
7 topologies 5 topologies
Figure 1.
Illustration of motifs as Boolean networks. (a) The fully connected
three-node motif, showing all nine possible connections. (b) Two example
motifs, the feed-forward loop (left) and the feedback loop (right). (c) Examples
of Boolean functions that could be placed on these example motifs. The binary
node states are updated simultaneously according to the table of update rules
for each node, and the inputs to that node. (d) The dynamical graphs for these
example Boolean functions, showing the resulting transitions (shown as broad
arrows) between the eight possible states of these three-node motifs. (e) All of
the different topologies of dynamical graphs that can occur for these two motifs,
with the example topologies of step (d) highlighted, and two measurements of
these dynamical graph topologies: the average basin entropy
S
avand the total
number of different cycle lengths
C
t.
rsif.r
oy
alsocietypublishing.org
J.
R.
Soc.
Interfa
ce
13
:
20160179
2of thekinputs from other node states (figure 1c). In a Boolean network ofNnodes, the dynamics determined by the Boolean functions gives rise to a directed transition graph of 2Nnodes,
representing all the 2Npossible states of the network. We will
refer to such graphs as adynamical graph, and each motif can have several of these, corresponding to different Boolean func-tions. If we ignore the specific combinations of states that the nodes in the dynamical graph correspond to, and only focus on their connectivity, then many dynamical graphs become isomorphic, meaning that they share the same dynamical graph topology.
2.1. Characterizing the state space of network motifs
The nine possible edges of the three-node motif (shown in figure 1a) give rise to 29¼512 possible ways of connecting three nodes. Many of these however are equivalent (such as three rotated versions of the feed-forward loop shown in figure 1b, left). If one takes into account all such equivalencies, 104 topologically distinct three-node motifs remain. By calculat-ing all dynamical transition graphs (such as those shown in figure 1d) and comparing their unlabelled topologies one arrives at 951 distinct dynamical graph topologies (such as those shown in figure 1e). In contrast with previous work [15], which used pairs of specific initial and final network states to measure the functionality of motifs, our approach is to use dyna-mical graph topologies. The two dynadyna-mical graphs that arise from the two motifs in figure 1bwith the Boolean functions shown in figure 1care shown in figure 1d. Because the three nodes of the feed-forward loop have two, one and zero inputs, respectively, there are 2ð22þ21þ20Þ
¼27¼128 possible configurations of Boolean functions in this motif, one of which is shown in figure 1c (left). The 128 configurations for the feed-forward loop can lead to seven different dynamical graph topologies (figure 1e, left). For the feedback loop (in which each node has one input), there are 2ð21þ21þ21Þ
¼26¼64
possible configurations, one of which is shown in figure 1c (right). These 64 configurations give rise to altogether five differ-ent dynamical graph topologies (figure 1e, right). We can characterize each dynamical graph topology in terms of two properties. The first is the basin entropy, which was introduced as a complexity measure for Boolean networks in [16,17]. It is defined as
S¼ X
i silnsi,
where si is the size of the ith attraction basin as a fraction
of the total state space. For the feed-forward loop with the example of Boolean functions in figure 1c(left), the dynamical graph (shown in figure 1d, left) only has one attraction basin, sos1¼1 andS¼0. For the three-node feedback loop example (figure 1d, right), we have two basins of size 1 and two of size 3, so that s1¼1/8, s2¼1/8, s3¼3/8 and s4¼3/8, giving a basin entropy ofS¼1/4 ln (1/8)þ3/4 ln (3/8)¼ ln 82(3/4) ln 31.26. The basin entropy is minimal when all states lie in one attraction basin and maximal when all states form separate attractors.
The second measure we can use to characterize a dynami-cal graph topology is the number of distinct cycle lengthsC in the dynamical graph. In the feed-forward dynamical graph example of figure 1d(left), we only have one cycle of length 1, i.e.C¼1, because we reach a fixed point when all three nodes have state 0. The feedback example (figure 1d,
right) on the other hand has two cycles of length 1 and two cycles of length 3, and therefore two distinct cycle lengths, orC¼2.
For both of these measures,SandC, we can now define aggregated versions for each motif: the average basin entropy Savis calculated across all distinct dynamical graph topolo-gies for a given motif, which are found by considering all possible Boolean functions for that motif. Similarly, the total number of distinct cycle lengthsCtis also determined across all of these topologies. The value ofSavfor the seven topologies of the feed-forward loop is zero, as all have a single attraction basin that fills the entire state space, and Ct¼1, as all of these basins have a 1-cycle as their attractor. For the feedback loop, on the other hand, two of the five topologies consist of more than one basin, resulting in a value ofSav¼0.364. We haveCt¼4 for the feedback loop,
1-node highest-order FBL no FFL FFL 2-node 3-node no FBL
all 104 distinct motif topologies
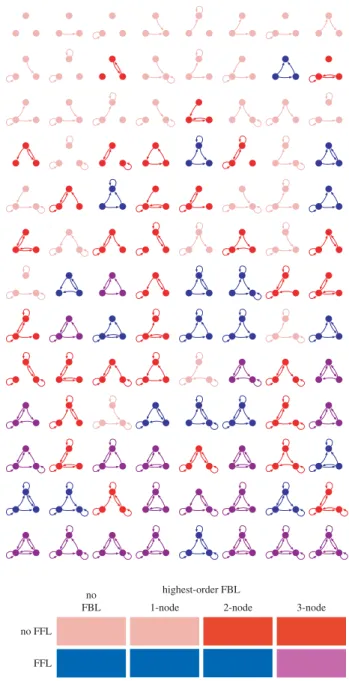
Figure 2.
All 104 topologically distinct motifs, colour-coded according to the four
categories described in the text. These are motifs containing (i) no feed-forward
loops, and no two-node or three-node feedback loops (pink), (ii) no
feed-forward loops, and two-node or three-node feedback loops (red), (iii) feed-feed-forward
loops and no three-node feedback loops (blue), and (iv) feed-forward loops and
three-node feedback loops (purple).
rsif.r
oy
alsocietypublishing.org
J.
R.
Soc.
Interfa
ce
13
:
20160179
3as we find four different cycle lengths (1, 2, 3 and 6) across the five dynamical graph topologies.
2.2. Characterizing the structure of network motifs
Our overall aim is to establish whether the structure of a motif determines its dynamical behaviour, and thus its func-tion as a regulatory unit. So far, we have introduced two quantities, Sav and Ct, which allow us to characterize the dynamical state space of a motif. For an effective comparison of structure and dynamics, we also need to characterize the structure of the motifs. We do this by describing the 104 dis-tinct motifs in terms of feed-forward loops and feedback loops. We already used both the feed-forward loop and the
three-node feedback loop as examples in figure 1. These two motifs are the two simplest triangle motifs, and can therefore be viewed as basic units of any three-node triangle motif, which is also why other network measures have been defined using them as a basis [19,20]. The feed-forward loop is known to play an important role in biological regu-latory networks [2,3], and feedback loops occur for example in the context of negative self-regulatory circuits [18]. For our classification of motif structure, we also consider two-node and one-node feedback loops (also referred to as self-loops or self-interactions). We partition the 104 motifs into four classes of roughly equal size: (i) motifs that contain no feed-forward loops and no two-node or three-node feedback loops, (ii) motifs that contain no feed-forward
0 1 2 3 4 5 6 7 8 9 10
different dynamical cycle lengths (
Ct
)
different dynamical cycle lengths (
Ct
)
no. edges in motif
0 1 2 3 4 5 6 7 8 9 10
0 1 2 3 4 5 6 7 8 9 10 0 1 2 3 4 5 6 7 8 9 10
no. edges in motif 1 2 3 4 5 6 7 8 1 2 3 4 5 6 7 8 1 2 3 4 5 6 7 8 (a) (b) (c) (d) 1 2 3 4 5 6 7 8 1-node highest-order FBL no FFL FFL 2-node 3-node no FBL
Figure 3.
(a–d) The total number of different cycle lengths
C
tthat can be realized with motifs of a given number of edges. All four panels show the values for all
104 motifs, but with different categories highlighted. These are the four structural classes of motifs defined in the text. The colour code is given below the four
panels. Motifs with feed-forward loops and without three-node feedback loops (blue) exhibit few cycle lengths for a given number of edges, while those motifs
without forward loops and with two-node and three-node feedback loops (red) show high numbers of different cycle lengths. Motifs with only 1-node
feed-back loops or no loops at all show few cycles (pink), while those with feed-forward and three-node feedfeed-back loops can accommodate many cycle lengths (purple).
rsif.r
oy
alsocietypublishing.org
J.
R.
Soc.
Interfa
ce
13
:
20160179
4loops, but do contain two-node or three-node feedback loops, (iii) motifs that contain feed-forward loops, but no three-node feedback loops, and (iv) motifs that contain feed-forward loops and three-node feedback loops. These four categories represent the four possible combinations of the presence or absence of the two basic loops in network motifs, the feedback loop and the feed-forward loop. Figure 2 shows all 104 motifs colour-coded according to this classification.
Figure 3 shows the total number of distinct cycle lengths Ctfor the 104 motifs as a function of the number of edges in the motifs and broken down into the four structural cat-egories described above. As the number of edges in a
Boolean network is closely related to the total length of the Boolean functions, it represents a proxy for the potential processing power of the network. Accordingly, the values of Ct for all 104 motifs show a broad positive correlation with the number of edges. For a given number of edges, however, there are clear differences in the values of Ct for the motifs in our four categories. Motifs with a feed-forward loop but without a three-node feedback loop show the least cycle diversity of Ct for a given number of edges (shown in figure 3c in blue). Motifs with no feed-forward loop and two-node or three-node feedback loops on the other hand exhibit high values of Ct for a given number of edges (figure 3b, red), meaning that they are capable of 0 0.1 0.2 0.3 0.4 0.5 0.6 0.7 0.8 0.9 1.0 0 0.1 0.2 0.3 0.4 0.5 0.6 0.7 0.8 0.9 1.0 0 1 2 3 4 5 6 7 8 9 10
average basin entropy (
Sav
)
average basin entropy (
Sav
)
no. edges in motif
0 1 2 3 4 5 6 7 8 9 10
0 1 2 3 4 5 6 7 8 9 10 0 1 2 3 4 5 6 7 8 9 10
no. edges in motif 0 0.1 0.2 0.3 0.4 0.5 0.6 0.7 0.8 0.9 1.0 0 0.1 0.2 0.3 0.4 0.5 0.6 0.7 0.8 0.9 1.0 1-node highest-order FBL no FFL FFL 2-node 3-node no FBL (a) (b) (c) (d)
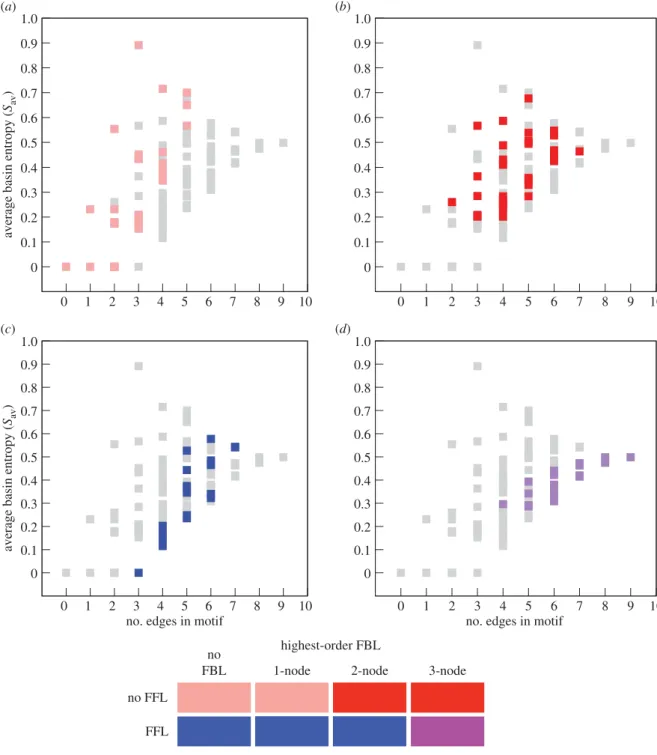
Figure 4.
(a–d) The average basin entropy
S
avmeasures the fragmentation of the dynamical graphs of a motif. This quantity is shown here against the number of
edges in each motif. All four panels show the values for all 104 motifs, but with different categories highlighted. These are the four structural classes of motifs
defined in the text. The colour code is given below the four panels. Motifs with feed-forward loops and without three-node feedback loops (blue) exhibit relatively
low values of
S
avfor a given number of edges, while those motifs without feed-forward loops and with feedback loops (pink and red) exhibit higher values of
S
avfor
a given number of edges. Note that the three values for
S
av¼
0 and 0, 1 and 2 edges correspond to motifs without any loops at all. Motifs with feed-forward and
three-node feedback loops (purple) have intermediate values of
S
av.
rsif.r
oy
alsocietypublishing.org
J.
R.
Soc.
Interfa
ce
13
:
20160179
5producing many different cycle lengths in their dynamical behaviours. Motifs with no feed-forward loops and no two-node or three-two-node feedback loops have universally low Ct values (figure 3a, pink), while motifs with feed-forward loops and three-node feedback loops have universally high Ct values (figure 3d, purple). Note that there are motifs with four and five edges in both of these extreme categories, which shows how much the dynamical complexity of a motif depends on the arrangement, rather than the number, of its edges.
Similarly, figure 4 shows the average basin entropySavof the 104 motifs as a function of the number of edges, for the four structural categories. The largest values of the basin entropy are displayed by motifs with 1-node feedback loops (figure 4a, in pink). Note that the five motifs that have no loops of any kind have average basin entropy Sav¼0. These are in the same structural category as the 1-node feedback loops, and are represented in figure 4 by the three points atSav¼0 and 0, 1 and 2 edges. For a given number of edges, motifs that contain a feed-forward loop and no three-node feedback loops tend to display lowerSav values (figure 4c, in blue), and motifs that contain two-node and three-two-node feedback loops and no feed-forward loop display higherSavvalues (figure 4b, red). Motifs that contain both feed-forward loops and three-node feedback loops exhibit relatively low basin entropy for a given number of edges, but the total range ofSavvalues narrows considerably with increasing numbers of edges (figure 4d, purple). These results show that the average basin entropy offers a complementary definition of dynamical complexity toCt. Between them these two measures reveal that there is indeed a strong connection between certain structural charac-teristics of a motif and aspects of its dynamical behaviour. The values ofSavandCt for all 104 motifs can be found in the electronic supplementary material.
2.3. Real-world regulatory networks
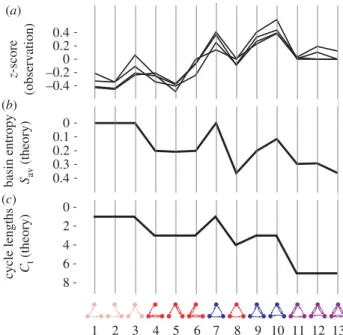
We now consider a subset of the 104 motifs, namely the 13 connected motifs without self-interactions. This important subclass is of interest as it has been studied extensively in the literature, and was the basis for the seminal work on network motifs, by Alon and co-workers [1,2]. The frequencies of these 13 motifs, relative to a null model, were used to define ‘superfamilies’ of networks that exhibit similar motif frequency distributions. One such superfamily included signal-transduction networks in mammalian cells, neural networks and transcription networks. The enrichment signa-ture across the 13 motifs, expressed in the form of az-score to show the deviation from the null model, is adapted directly from [2] in figure 5a. In figure 5b,c, we show the values of SavandCt, respectively, for the same motifs, plotted on an inverted scale. The enrichment profiles show a striking simi-larity to those ofSavandCt, which becomes even clearer if we compare the gradients of the series rather than the absolute values. The Pearson correlation between the successive changes in basin entropy and those in the motif enrichments for real-world networks is 20.7862 (p-value: 3.5410211), and the equivalent correlation for the number of cycle lengths is20.8166 (p-value: 1.5010212). If we compare the profiles with the structural classification of the motifs, shown under-neath them in figure 5, we see that the lower values of the motif enrichment (and, correspondingly, the higher values of the basin entropy and cycle length number, plotted on
an inverted scale) occur when the motif contains a three-node feedback loop (motifs 8, 11, 12 and 13 in figure 5) and to a lesser extent when it contains a two-node feedback loop (motifs 4, 5, 6). This indicates that feedback loops are suppressed in these networks relative to the feed-forward loop. The close correlation with the dynamical complexity of Boolean network motifs as measured by the basin entropy suggests that the fragmentation of state space may be a reason why the feedback loop motif appears to be less desir-able in real-world regulatory networks. Only those triangle motifs (7, 9 and 10) which do not contain any feedback loops are highly enriched. These results also underline the importance of the feed-forward loop, which has been estab-lished as an important building block of biological networks [3]. Note that whileSavandCtare strongly corre-lated (Pearson: 0.8705) for the 13 connected motifs without self-interactions, they are only weakly correlated (Pearson: 0.4092) across all 104 motifs.
basin entropy Sav (theory) z -score (observation) 0 0.1 0.2 0.3 0.4 –0.4 –0.2 0 0.2 0.4 0 2 4 6 8 1 2 3 4 5 6 7 8 9 10 11 12 13 cycle lengths C t (theory) (b) (a) (c)
Figure 5.
This figure compares the average basin entropy
S
avand the total
number of distinct cycles
C
twith the enrichments, in four real-world
regu-latory and neural networks, of the 13 connected three-node motifs
without self-interactions. The four networks are two developmental
transcrip-tion networks in fruit fly and sea urchin, a signal-transductranscrip-tion network of
mammalian cells, and the neural network of
Caenorhabditis elegans. These
data are adapted directly from the seminal study of these 13 motifs in [2]
and were kindly made available by the authors of this work. (a) The
enrich-ment profiles for these networks are shown relative to a null model, in the
form of a
z-score. Note that the motifs without any feedback loops (7, 9 and
10) are the most prevalent. (b) The values of the basin entropy
S
avare shown
for the same motifs on an inverted scale, and exhibit a striking similarity to
the motif
z-scores. On this inverted scale, the former shows a slight
down-wards trend with increasing edge number in the motifs, whereas the latter
shows a slight upwards trend. The successive gradients of these two profiles
however match almost perfectly. To separate the effects of edge number from
other characteristics of motif structure, we compare the successive differences
in
z-score between motifs
DZ
with the differences in average basin entropy
DS
avand find that these show a strong correlation with a Pearson coefficient
of
2
0.7862. (c) The values of
C
t, the total number of distinct cycle lengths,
for these motifs, which follow a similar pattern to the
z-scores and
S
av. The
correlation of the successive differences
DZ
and
DC
tis similarly high
(
2
0.8166). Note that
C
t, like
S
av, is shown on an inverted scale.
rsif.r
oy
alsocietypublishing.org
J.
R.
Soc.
Interfa
ce
13
:
20160179
63. Discussion
In our structural classification of the 104 networks into four categories, we chose to group networks with two-node and three-node feedback loops together if they did not contain feed-forward loops. The reasons for this were that this classifi-cation produced roughly equal-sized categories, and that the dynamical behaviours of these networks were sufficiently similar. This did not hold for networks with two-node and three-node feedback loops that did contain feed-forward loops. In these, the networks with only a two-node feedback loop exhibited very different dynamics from those containing a three-node feedback loop, and had more in common with networks that had only a one-node feedback loop or none at all. Feedback loops have been shown to occur in some regulatory networks, but only in small numbers in transcriptional networks [2,21]. The likely reasons are that feedback loops tend to consist of a transcriptional regulation and a protein–protein interaction, such as the much studied p53-MDM2 loop [18]. One of these regulations is typically a negative one, to enable self-regulation, as purely positive feedback loops would probably lead to an irre-versible—and therefore highly undesirable—cellular state [22]. The danger of such runaway states may be another reason why feedback loops are uncommon. Perhaps the most promi-nent example of a transcriptional feedback loop is an artificial one, the repressilator [23], which exhibits noisy performance, offering another reason why purely transcriptional feedback loops are suppressed.
The values ofSavandCtboth show a slight downwards trend (on the inverted scale) with increasing edge number in the motifs, whereas the motifz-scores show a slight upwards trend. A likely reason for this relative divergence could be that a larger number of edges in a motif is likely to result in more complex partitions of state spaces, which in turn mean higher basin entropy and greater cycle length diversity. One would therefore expect an underlying trend towards higher basin entropy and cycle length number with increasing edge
number. As we show above, we can control for this underlying effect by considering the gradients of the profiles, for which we observe strong correlations between the gradients of the z-scores and the gradients ofSavandCt.
4. Conclusion
A number of publications have addressed the link between the structure and dynamics or, more broadly speaking, form and function of network motifs [12–15]. In this literature, ‘function’ has been defined in terms of gene expression patterns, which has led to the conclusion that a single structure can lead to a wide variety of functional behaviours in this sense. Form there-fore does not dictate function on this level. If we however define function on a higher level, in terms of topological prop-erties of the state space, a clear relationship between structure and function emerges. That this relationship is likely to be meaningful is indicated by the close correspondence between the topological properties—basin entropy and cycle length number—and the enrichments of motifs in regulatory networks and neural networks. The presence of feedback loops in a motif results in a profoundly different organiza-tion of state space, even if the feedback loops are among feed-forward loops. This is also why the highly stable, unfrag-mented attraction basins of simpler feed-forward loops provide a reliable template for the implementation of a variety of gene expression patterns (which, in other contexts such as [12–15], would be described as different ‘functions’ of the circuit). It is highly unlikely that these fundamental topological properties of the state space do not influence the biological evolution of regulatory networks.
Competing interests.We declare we have no competing interests. Funding.S.E.A. was supported by the Royal Society.
Acknowledgements.The authors wish to thank U. Alon and his group for sharing the raw data of the motif prevalencez-scores.
References
1. Milo R, Shen-Orr S, Itzkovitz S, Kashtan N, Chklovskii D, Alon U. 2002 Network motifs: simple building blocks of complex networks.
Science298, 824 – 827. (doi:10.1126/science.298. 5594.824)
2. Milo R, Itzkovitz S, Kashtan N, Levitt R, Shen-Orr S, Ayzenshtat I, Sheffer M, Alon U. 2004 Superfamilies of evolved and designed networks.Science303, 1538 – 1542. (doi:10.1126/science.1089167) 3. Mangan S, Alon U. 2003 Structure and function of
the feed-forward loop network motif.Proc. Natl Acad. Sci. USA100, 11 980 – 11 985. (doi:10.1073/ pnas.2133841100)
4. Kauffman SA. 1969 Metabolic stability and epigenesis in randomly constructed genetic nets.
J. Theor. Biol.22, 437 – 467. (doi:10.1016/0022-5193(69)90015-0)
5. Samuelsson B, Troein C. 2003 Superpolynomial growth in the number of attractors in Kauffman networks.Phys. Rev. Lett.90, 098701. (doi:10.1103/ PhysRevLett.90.098701)
6. Espinosa-Soto C. 2004 A gene regulatory network model for cell-fate determination duringArabidopsis thalianaflower development that is robust and recovers experimental gene expression profiles.
Plant Cell16, 2923 – 2939. (doi:10.1105/tpc. 104.021725)
7. A´lvarez-Buylla ERet al.2008 Floral morphogenesis: stochastic explorations of a gene network epigenetic landscapePLoS ONE3, e3626. (doi:10.1371/journal. pone.0003626)
8. Li F, Long T, Lu Y, Ouyang Q, Tang C. 2004 The yeast cell-cycle network is robustly designed.Proc. Natl Acad. Sci. USA101, 4781 – 4786. (doi:10.1073/pnas. 0305937101)
9. Orlando DA, Lin CY, Bernard A, Wang JY, Socolar JES, Iversen ES, Hartemink AJ, Haase SB. 2008 Global control of cell-cycle transcription by coupled CDK and network oscillators.Nature453, 944 – 947. (doi:10.1038/nature06955)
10. Levy ED, Pereira-Leal JB, Chothia C, Teichmann SA. 2006 3D complex: a structural classification of
protein complexes.PLoS Comput. Biol.2, e155. (doi:10.1371/journal.pcbi.0020155)
11. Ahnert SE, Marsh JE, Hernandez H, Robinson CV, Teichmann SA. 2015 Principles of assembly reveal a periodic table of protein complexes.Science350, aaa2245. (doi:10.1126/science.aaa2245)
12. Ingram PJ, Stumpf MP, Stark J. 2006 Network motifs: structure does not determine function.BMC Genomics
7, 108. (doi:10.1186/1471-2164-7-108) 13. Wall ME, Dunlop MJ, Hlavacek WS. 2005 Multiple
functions of a feed-forward-loop gene circuit.J. Mol. Biol.349, 501– 514. (doi:10.1016/j.jmb.2005.04.022) 14. Macı´a J, Widder S, Sole´ R. 2009 Specialized or
flexible feed-forward loop motifs: a question of topology.BMC Syst. Biol.3, 84. (doi:10.1186/1752-0509-3-84)
15. Payne JL, Wagner A. 2015 Function does not follow form in gene regulatory circuits.Sci. Rep.5, 13015. (doi:10.1038/srep13015)
16. Krawitz P, Shmulevich I. 2007 Basin entropy in boolean network ensembles.Phys. Rev.
rsif.r
oy
alsocietypublishing.org
J.
R.
Soc.
Interfa
ce
13
:
20160179
7Lett.98, 158701. (doi:10.1103/PhysRevLett.98. 158701)
17. Krawitz P, Shmulevich I. 2007 Entropy of complex relevant components of boolean networks.Phys. Rev. E76, 036115. (doi:10.1103/PhysRevE.76.036115) 18. Lahav G, Rosenfeld N, Sigal A, Geva-Zatorsky N,
Levine AJ, Elowitz MB, Alon U. 2004 Dynamics of the p53-Mdm2 feedback loop in individual cells.Nat. Genet.36, 147 – 150. (doi:10.1038/ng1293)
19. Fagiolo G. 2007 Clustering in complex directed networks.Phys. Rev. E76, 026107. (doi:10.1103/ PhysRevE.76.026107)
20. Ahnert SE, Fink TMA. 2008 Clustering signatures classify directed networks.Phys. Rev. E78, 036112. (doi:10.1103/PhysRevE.78.036112)
21. Lee TIet al.2002 Transcriptional regulatory networks inSaccharomyces cerevisiae.Science298, 799 – 804. (doi:10.1126/science.1075090)
22. Tyson JJ, Chen KC, Novak B. 2003 Sniffers, buzzers, toggles and blinkers: dynamics of regulatory and signaling pathways in the cell.
Curr. Opin Cell Biol.15, 221 – 231. (doi:10.1016/ S0955-0674(03)00017-6)
23. Elowitz MB, Leibler S. 2000 A synthetic oscillatory network of transcriptional regulators.Nature403, 335 – 338. (doi:10.1038/ 35002125)