Cost and performance
of EV batteries
Final report
for
The Committee on
Climate Change
21/03/2012
Element Energy Limited 20 Station Road Cambridge CB1 2JD Tel: 01223 227764 Fax: 01223 353 475
Executive summary
BackgroundDeep decarbonisation of the road transport sector can only be achieved through the introduction of electrified drivetrains. A key component within an electric vehicle (EV) in terms of overall cost and performance is the battery.
The Committee on Climate Change commissioned Element Energy, Axeon and Prof. Peter Bruce of EastChem to investigate the future trajectory of batteries cost and performance. This report describes the current state of development and cost of batteries, before mapping the future cost and performance of lithium-ion batteries out to 2030. The trajectory of battery technology beyond 2030 is investigated through the study of lithium-air batteries, currently the most promising post lithium-ion battery.
Current lithium-ion batteries: performance
A range of battery chemistries have been deployed in EVs, most notably the use of nickel metal hydride in the Toyota Prius. However energy density has emerged as the most important metric in battery design, leading to lithium family chemistries becoming the dominant chemistry for pure and Plug in Hybrid EV (PHEV) applications.
Currently, cells suitable for transport applications typically have an energy density of 100-180Wh/kg, are available at a capacity of 40 Ah/cell, and (with careful thermal and operational management) may achieve 10 years of life in automotive operation. Automotive cells cost ca. $400/kWh but the actual cost of the battery system is higher due to the need for electronic and thermal management. The whole battery system including cells, structural support, thermal management and electronic balance, is called the battery pack. The cost of a battery pack for a pure EV is approximately $800/kWh, i.e. double the cost of the cells alone.
Automotive cells represent only a marginal share (<5%) of the rechargeable lithium-ion cells market. The largest market is consumer electronics, such as batteries for laptops and phones. Consumer cells are smaller and have less stringent performance specifications than automotive cells in terms of power, battery life and safety. Small consumer cells cost under 250$/kWh, but these figures do not translate directly to automotive cells because of their more stringent requirements and the engineering challenge of manufacturing large cells.
Today’s typical lithium-ion cells characteristics and technology development path
Battery chemistry innovations first appear in the electronic consumer market before trickling down to the more demanding automotive market several years later. The time interval between chemistries first being demonstrated in laboratory conditions, and then deployed in vehicles, is observed to be 15-25 years.
15 to 25 years
since proof of concept Consumer cells 10-15 years of R&D <$250/kWh <4Ah Up to 200Wh/kg Automotive cells ~$400/kWh Up to 40Ah 100-180Wh/kg Proof of concept
This indicates that out to 2020, step-change improvements in performance of automotive batteries are highly unlikely to occur as there are no “breakthrough” technologies approaching the consumer market today.
Future lithium-ion batteries: performance
Much of the current R&D is on improving the energy density of cells via new chemistries. As well as greater vehicle range, increasing energy density has the potential to reduce costs as a result of less material per kWh and fewer cells to monitor. Two routes are being pursued to improve energy density: developing electrode materials with higher capacity (mAh/g); or developing cells using higher voltage chemistry.
Next-generation technologies delivering higher specific energy are likely to be nickel cobalt manganese and composite cathodes and high capacity anodes (silicon), estimated to be available in a series vehicle ca. 2020. Higher voltage cathode chemistries are expected to follow.
These developments could take the energy density of lithium-ion cells close to 300Wh/kg. As the automotive market grows, new cells will be increasingly developed for that market as well as trickling down from the consumer cell market.
Future lithium-ion cells technology development path Post lithium-ion batteries: performance
There are several technologies in lab/prototype stage which have the potential to offer superior battery performance. The most notable are sulphur batteries and lithium-air batteries which have the highest theoretical energy density (greater than 2,500 Wh/kg). However they all have significant technical challenges that must be overcome before practical batteries with acceptable life and safety characteristics are available to the automotive market.
Based on the observed development times for battery technologies and the current challenges lithium-air cells face, practical lithium-air batteries for automotive applications are not expected before 2030.
This report sets out a reasonable basis for predicting future Li-Air performance between 500-1000Wh/kg (at cell level - a factor 2-3 improvement over expectations for Li-Ion in 2030). This is based on historical data on the ratio between theoretical and practical energy of other chemistries and is in accordance with expert opinion.
Battery cost modelling
Following a review of existing battery cost models, a bottom-up component-based approach to cost modelling of lithium-ion cells to 2030 was developed. The cost model contains cell component and pack component costs, where each is designed to be fit for purpose for a set of vehicles over the period to 2030. Within the cell module there are sub models related to cell design, material consumption, manufacturing cost, factory
In R&D today Consumer cells
Automotive cells
Development of new materials to improve energy density: High capacity anode and Route1: High capacity cathode Route 2: High voltage cathode
In R&D today
~300Wh/kg 2030
throughput and overheads. The packing cost module represents physical supports, environmental control, wiring, battery management system and power electronics. Post 2030 cost projections are based on cost estimates of lithium-air batteries.
Two main cost drivers have been identified:
The improvement in material properties delivering higher energy densities
The improvement in material properties is represented through a detailed technology roadmap of lithium-ion cathode and anode characteristics up to 2030, developed from a review of current R&D efforts and progress.
The scaling up in production of large cell formats
Cost improvements occur through increased volumes and cell size standardisation. Pack assembly – a large contributor to the total pack cost – is also expected to benefit from increased volume and standardization of components.
Results
Current costs for a pure EV of ~$800/kWh at pack level translates into a pack cost of $21,000 for a 2012 medium sized BEV with a range of 150km. In 2030, under a baseline scenario, this is predicted to drop to $6,400 for a BEV with a range of 250km.
Results for a medium sized pure battery electric car – 30kWh pack
Batteries for PHEVs are more constrained by power density, as the smaller packs have higher discharge rates during acceleration. It results in a higher cost per kWh for a PHEV compared to pure battery electric vehicle.
Lithium air batteries (if successfully deployed) can bring cost savings at the cell level. However this saving is reduced by the increased cost of packing arising from the lower cell voltage and the requirement for more air management. Our cost modelling suggests that in the long term, the deployment of Li-air would not be expected to bring a significant cost reduction on the pack level compared to the advanced lithium-ion batteries expected to be developed by 2030. However the ca. 50% weight saving which may be expected with Li-air would have other benefits such as reduced chassis weight and better performance.
Barriers and key challenges
The technology roadmap assumes that lithium-ion chemistries will reach their highest practicable energy density through the development of high voltage cathodes. There are significant and fundamental technical challenges to be overcome before these technologies can be deployed, such as the development of an electrolyte stable at a high voltage.
The cost benefits brought by high production volume of battery packs are highly dependent on the uptake of EVs. Looking at the announced new production capacity, there is a significant risk of over-capacity in the next 5 years if consumers do not take to the technology; this could stall further investment.
$5,000
$10,000
$15,000
$20,000
$25,000
2011 2020 2030To
ta
l p
ac
k
co
st
$
200 kg pack
160 kg pack
300 kg pack
-50% in cost
- 30% in mass
-70% in cost
- 45% in mass
Contents
1 Introduction ... 1
2 Plug in vehicles and battery attributes... 3
2.1 Choice of vehicles to model ... 3
2.2 Vehicle battery architectures ... 5
2.2.1 Introduction to batteries ... 5
2.2.2 Automotive battery technologies ... 6
2.2.3 Lithium ion cells ... 9
2.2.4 Battery pack attributes ... 10
3 Understanding current automotive cells ... 16
3.1 Historical trends of lithium-ion cells ... 16
3.2 Cost and performance of current lithium ion cells ... 19
3.3 Cost of automotive packs ... 23
3.4 The rechargeable battery industry ... 24
4 Looking ahead: chemistries of the future ... 27
4.1 Battery taxonomy ... 27
4.2 Key R&D challenges and development status ... 28
4.2.1 Intercalating cathodes... 28 4.2.2 Intercalating anodes ... 30 4.2.3 Alloying anodes ... 31 4.2.4 Electrolyte ... 32 4.2.5 Sulphur metal ... 33 4.2.6 Lithium-air ... 34
4.3 National programs and international research ... 37
4.4 Technology roadmap ... 39
5 Cost and performance model ... 42
5.1 Review of existing models ... 42
5.1.1 Modelling methodologies ... 42
5.1.2 Review of state of the art battery cost models ... 43
5.2 Chosen methodology ... 45
5.3 Key assumptions and scenarios ... 47
6 Battery cost and performance to 2050 ... 50
6.1 Bottom up model results to 2030... 50
6.1.1 Baseline outputs ... 50
6.1.2 Conservative and optimistic outputs ... 57
6.2 Long term cost and performance ... 59
6.3 Interpretation ... 62
7 Conclusions ... 64
8.1 Vehicle and pack attributes ... 68
8.2 Model diagram ... 71
8.3 Model inputs and assumptions ... 72
8.3.1 Cell design ... 72
8.3.2 Technology roadmap of active materials ... 74
8.3.3 Cell material costs ... 75
8.3.4 Cell production cost ... 79
8.3.5 Pack assembly ... 81
8.3.6 Other costs ... 83
8.4 Cost sensitivity ... 84
8.5 Model results to 2030 ... 86
8.5.1 Baseline results ... 86
8.5.2 Conservative scenario results ... 90
Authors
For comments or queries please contact: Celine Cluzel [email protected] Tel: +44 (0) 330 119 0984 Craig Douglas [email protected]
Reviewers
Shane Slater, Director, Element Energy
Prof. P. G. Bruce FRS, FRSE, School of Chemistry, University of St Andrews George Paterson, Director of Sales, Axeon
Dr Valentina Gentili, Electrochemical Engineer, Axeon Dr Allan Paterson, Senior Electrochemical Engineer, Axeon
Acknowledgements
The authors would like to thank Oxis Energy, and many cell suppliers and cell material suppliers (who would like to remain anonymous) for sparing some of their time to give insights on their industry. The authors also thank the Argonne National Laboratory team and German Aerospace Centre team who have both developed battery cost models and shared some of their methodology choices.
Acronyms and terminology
ANL Argonne National Laboratory
Anode The electrode of a cell at which oxidation occurs. By convention this is the negative electrode and is the electrode that electric current flows into (and electrons flow out of) at discharge. It is typically carbon based.
BEV Battery Electric Vehicle. Apure battery electric vehicle contains a battery and an electric motor only. The vehicle is charged by mains electricity. Examples include the Nissan Leaf and Mitsubishi i-MIEV.
BMS Battery Management System BOM Bill of materials
CAPEX Capital Expenditure
Cathode The electrode of a cell at which reduction occurs, by convention this is the positive electrode and is the electrode that electric current flows out of (and electrons flow into) at discharge.
CCC Committee on Climate Change
CGGC Centre on Globalization, Governance & Competitiveness DC Direct Current
DECC Department of Energy and Climate Change DfT Department for Transport
DLR German Aerospace Centre DOD Depth of discharge
DoE Department of Energy (of United States)
EastChem The Edinburg And St Andrews research school of Chemistry
EE Element Energy
EPRI Electric Power Research Institute ESW Electrolyte Stability Window EV Electric Vehicle
FC Fuel Cell
ICE Internal Combustion Engine IP Intellectual Property
kW Kilowatt (unit of power)
kWh Kilowatt hour (unit of energy, 3.6MJ)
LCO Lithium Cobalt Oxide. Cathode active material LFP Lithium Iron Phosphate. Cathode active material LL Layered-layered. Type of cathode active material LMO Lithium Manganese Oxide. Cathode active material LMP Lithium Manganese Phosphate. Cathode active material
Low CVP Low Carbon Vehicle Partnership
LTO Lithium Titanate Oxide. Anode active material MIT Massachusetts Institute of Technology MPV Multi Purpose Vehicle
NEDC New European Drive Cycle
NMC Nickel Manganese Cobalt. Cathode active material OEM Original Equipment Manufacturer
PHEV Plug in hybrid electric vehicle. A PHEV can be charged from mains electricity and runs in electric mode until the battery is depleted (or high power is demanded), at which point the ICE takes over. An example of this vehicle is the Toyota Plug-in Prius.
PIV Plug In Vehicle
R&D Research and Development REEV Range Extender EV
SEI Solid Electrolyte Interface
SMMT Society of Motor Manufacturers and Traders SOC State of charge
TCO Total Cost of Ownership
UK United Kingdom
1 Introduction
Background
The Committee on Climate Change (CCC) was established in 2008 to advise the UK Government on climate change issues, and particularly the setting of carbon budgets and the scope of those budgets. In its first report published in 2008, the Committee concluded that the UK should aim to reduce Kyoto greenhouse gas emissions by at least 80% below the 1990 levels by 2050.
A key consideration for the CCC in recommending the level of carbon budgets is the cost-effectiveness of the abatement technologies needed to achieve them, relative to DECC’s carbon prices.
When looking at the road transport sector, the potential for improvement of internal combustion engines (ICEs) and the potential of biofuels are not enough to achieve deep levels of decarbonisation of the road transport sector. This can only be achieved through the introduction of electrified drivetrains. The battery is the key component within an electric vehicle (EV) which determines its overall capital cost and performance. Therefore, the task of determining the cost-effectiveness of EVs is predominantly one of identifying the future trajectory of battery cost and performance.
Objectives of the work
In this context, the CCC appointed Element Energy to develop a model and thereby a roadmap of battery cost and performance for a selection of EV applications, from now to 2050. This work provides insight on cost reduction drivers as well as barriers. Element Energy leads a team including Axeon and Professor Peter Bruce, Professor of Chemistry at the EaStCHEM.
The findings of this work will be used by the CCC in their analysis of the relative cost of ownership of different types of vehicle over the medium-term (to 2020 and 2030) as well as supporting their recommendations on the types of vehicle that are most likely to deliver cost-effective emissions reductions over the longer term (to 2050).
Methodology
The approach taken is a bottom up, component based model of battery cost, which takes in consideration likely improvements in the current battery technologies, up to 2030. Longer term costs are estimated based on the best – in terms of prospective energy density – future battery technology.
Structure of the report
Section 3 introduces the plug-in vehicles chosen to represent the UK market, and gives a general introduction to batteries and their attributes.
Section 4 presents current automotive batteries in terms of performance and costs. A short presentation of the historical development of lithium-ion batteries, for applications other than transport, is used to give an insight on the potential speed of development of new automotive batteries.
In section 5, prospective battery improvements or new chemistries are presented in terms of key R&D challenges and development status. This review, along with main national research programs and insights gathered from historical battery development, is used to inform the technology roadmap of the model (speed of battery technology improvement).
Section 6 describes the model methodology, which was developed after a review of existing models, as well as key assumptions, while results are outlined in section 7. Detailed model input data and supplementary results data have been placed in the Appendix.
Note on currency: some costs are expressed in US dollars ($) as it is the currency used in international trade and it allows our results to be compared with results published by other sources. An exchange rate of £1=$1.5 is used. Future costs are expressed in today’s prices.
About the authors and reviewers
Element Energy is a consultancy specialising in low carbon energy technologies. Element Energy has conducted innovative analyses of low carbon road transport, from cost analysis, recharging infrastructure analysis and consumer preference modelling. Element Energy has led the collaborative team effort involving Axeon and Professor Peter Bruce. Axeon is Europe’s largest independent supplier of automotive battery systems, working with a large number of cell suppliers. Axeon’s primary input to this project has been helping to develop cost models for battery assembly, provide data on cost and performance of current batteries as well as provide links with cell manufacturers to ensure the cell cost and performance models are accurate.
Peter Bruce is Professor of Chemistry at the EaStCHEM (Edinburgh and St. Andrews Research School of Chemistry). His group is a recognised leader in the electrochemistry of energy storage devices, with a significant body of research on lithium-based batteries. Prof. Bruce provided the technical insight to understand the scientific challenges limiting battery performance.
2 Plug in vehicles and battery attributes
The Committee on Climate Change (CCC) is carrying out an analysis of road transport technologies in terms of cost of carbon abatement. In this context, the Committee has commissioned two studies. A first team has been modelling the cost and performance of vehicles (excluding the cost of batteries for plug-in vehicles) while a second team – Element Energy, Axeon and Prof. Bruce – has been working exclusively on batteries for plug-in vehicles. This report presents the results of the battery cost and performance modelling exercise.
This section presents the characteristics of plug-in vehicles representative of the UK market (present and future) as well as their corresponding battery attributes.
2.1 Choice of vehicles to model
The specification (hence cost) of a battery changes significantly depending on the vehicle it powers, as well as the drivetrain (pure BEV or PHEV for example). In this section of the analysis, the UK vehicle market is segmented to develop a limited number of representative vehicle types. A bespoke pack is then designed for each of these for its cost to be modelled. Assumptions have to be made on certain design issues; an example is the EV range requirement. It is lower than ICE vehicles now and is set to increase in the future but is assumed to stay lower than for ICE vehicles. This assumption is based on evidence that consumers value capital cost savings more than range, and so are more prepared to accept range constraints rather than a very expensive vehicle.
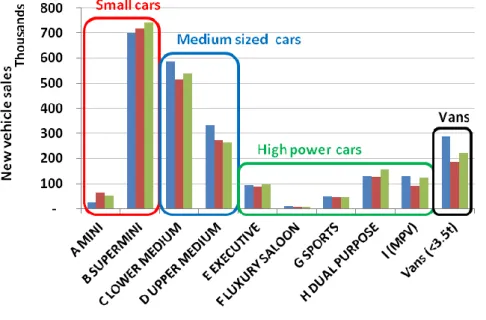
The UK road transport market is dominated by cars, with a small contribution from commercial vehicles (vans, buses and trucks). The scope of this work is the car market and the van market (light commercial vehicles, gross vehicle weight under 3.5 tonnes). The UK car market is traditionally segmented into 9 vehicle classes, from the ‘A segment’ (small city car, e.g. Toyota iQ, Hyundai i10) to the ‘I segment’ (Multi Purpose Vehicle, e.g. Renault Scenic, Ford Galaxy). Figure 2-2 shows SMMT data on the respective sale volumes of each car segment; along with sales of vans.
The plug-in car market is represented in the model through 3 classes: small cars (A&B segments), medium size cars (C&D segments) and high power cars (E&H segments). This is in line with the overall vehicle market modelling conducted in parallel of this work.
Figure 2-1 Context of the battery cost modelling
Cost and energy consumption of vehicles to 2050
Cost and energy consumption of vehicles to 2050 – excluding the battery
cost Non-plug in vehicles Plug in vehicles
Work commissioned by the CCC
Cost and performance of batteries to 2050
Work commissioned by the CCC – presented in this report
Technologies comparison (total cost
The van sector represents <10% of cars and vans sales, and less than any of the 3 car classes defined for the cost modelling. Within the van sector, the large panel van and standard panel van represent 55%1 of sales. The difference in performance of these van classes is minimal (with less than a 13% difference in gCO2/km); therefore only one class
of van is represented in the model: the panel van (kerb weight ~ 2t, e.g. Ford Transit). Other small commercial vehicles were not included due to their similarity to C&D and E&H class cars from which they derive.
Figure 2-2 Annual vehicle sales by segment in Great Britain. Source: SMMT 2011
Characteristics (engine output, kerb weight etc) of each segment have been aggregated to form vehicle datasets for two powertrains: pure battery electric vehicle (BEV) and plug-in EV (PHEV). Current characteristics have also been projected to the future based on expected vehicle energy consumption improvement. Table 2-1 shows the resulting vehicle dataset for medium sized cars (C/D segment); see Appendix 8.1 for details on the methodology and full datasets.
Table 2-1 C&D BEV and PHEV vehicle attributes in 2011 and 2030 for use in the battery cost modelling
Attribute BEV PHEV
2011 2030 2011 2030
Range (km) 150 250 30 80
Energy consumption (kWh/km) 0.14 0.097 0.15 0.106
Max pack mass (kg) 300 180 150 120
Motor peak power (kW) 70 70 60 60
Usable energy (kWh) 21 24 4.6 8.5
Usable energy means ‘required energy to achieve the target range’; the total energy is actually greater as batteries are generally not fully discharged/charged; this is explained in the next section.
1
2.2 Vehicle battery architectures
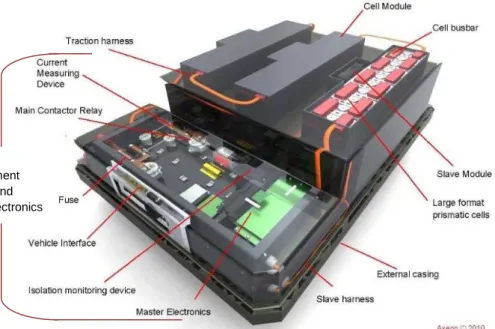
Figure 2-3 provides an example of an automotive battery pack. A pack is composed of a large number of cells. As cells have a relatively low voltage (between 1.5-4V) and limited capacity, these cells are arranged in series (to increase the overall voltage to a usable level) and in parallel. Cells may be arranged into relatively self-contained modules which themselves are arranged in series and parallel as required by the vehicle drivetrain. The sections below first provide an overview of cells and their architecture, followed by the rest of the pack elements.
Figure 2-3 Example of a battery pack. Source: Axeon guide to batteries
2.2.1 Introduction to batteries
All batteries consist of: two electrodes: which supply and collect charge, connected to an external electrical circuit
an electrolyte: this conducts ions which move between the electrodes (cations (e.g. H+) and anions (e.g. OH-)) but it does not conduct electrons, which must instead flow through an external circuit.
chemical fuel: two species (elements or compounds) that spontaneously react due to a desire to reach a lower energy state (different electro potentials)
In many common batteries, each of the two chemical fuels (solid) is attached to its corresponding electrode (which is solid), and the two electrodes are immersed in a liquid electrolyte. However, in general: the electrolyte may be liquid (lead-acid) or a polymer in liquid (lithium polymer); and the chemical fuel supplied to the electrodes can be solid (e.g. lead-acid batteries), liquid (flow batteries) or gaseous (Zinc-air or Lithium-Air).
The voltage of the battery is the sum of voltages of the reactions at the anode and cathode. The battery capacity is set by the mass of reactive materials in the battery, the quantity of electrons released per mole of material, and the cell voltage.
Battery Management System and power electronics
Table 2-2 Examples oxidation reactions and resulting specific energy.
ff PbO2 Al Li LiCoO2
Molar mass g/mol 239 26.98 6.94 97.87
Electropotential V 1.94 1.66 3.05 4.2
Electron per mol 2 3 1 1
kJ/g 1.57 17.81 42.40 4.41
Wh/kg 435 4,947 11,779 1,150
There are three routes to maximise specific energy at the half reaction level:
High electro potential:combining a highly electronegative and electropositive species
High stochiometric transfer of electrons, i.e. electrons per mole of reactants Low molar mass of the participating species
The table above shows that certain species (e.g. pure Lithium) have a very high specific energy (ca. 12,000Wh/kg is very close to petrol/diesel). However in practice, the achieved specific energy of a cell may be much less because:
The reactive element may need to be combined with other, heavier elements to allow the reaction to be reversible (e.g. Li to lithium cobalt oxide LiCoO2)
Only a fraction of the mass of the battery is the reactants (typically between 25-40%) the rest comprising electrolyte, charge collectors, electrode substrate, physical containment, and unused/unreacted species.
The battery energy density can be increased by:
Using reacting species with high theoretical energy densities:
e.g. elemental Lithium or Aluminium (ideally) or Hydrogen (Nickel/Metal Hydride) Better battery design: minimise non-reacting components, reducing the quantity
of electrolyte, e.g. liquid species and thin solid electrolyte (ZEBRA batteries) Sourcing the oxidising species from the battery surroundings, e.g. metal-air cells Taking both of the reacting species from the battery surroundings:
fuel cells, flow batteries (but then the “battery” should include the mass of the reactant container)
2.2.2 Automotive battery technologies
While lithium ion is emerging as the preferred automotive technology, other technologies have been deployed in vehicle application. A brief overview of lead-acid, nickel-cadmium (Ni-Cd), nickel metal hydride (Ni-MH) and molten salt is set out below.
Lead acid
Lead acid batteries are better understood than any other battery types and were used in the earliest traction vehicles. Their benefits are the very low cost and very high reliability. However they are limited by a very low specific energy (a practical upper bound is 50Wh/kg) and this has all but excluded their serious consideration in a practical mass market electric vehicle. This is likely to remain the case, unless users are happy to accommodate low speeds, very limited ranges (less than 100km) and frequent fast charging (which the technology is capable of). Lead acid batteries are currently in use in applications where limited range and speed are not a concern (e.g. golf cart, mobility scooters, forklifts) and in electric bikes. They are also used in small series electric cars such as the 2 seater Norwegian Buddy (20-60km range, maximum 80km/h).
Nickel-Cadmium
Ni-Cd batteries were used in EVs in the 90s and early 2000s but have since been banned for consumer use and vehicle applications by the European Commission in 20062 on toxicity grounds. They are authorised only for military and medical applications.
Nickel Metal Hydride
Ni-MH batteries currently dominate the (non plug-in) hybrid market but cannot compete with lithium ion batteries in the plug-in market because of their lower specific energy (<100Wh/kg against 100-180Wh/kg for current lithium ion cells). Ni-MH batteries have been used in the most popular hybrid vehicle model – the Toyota Prius – and have proved reliable. Despite this positive experience, Toyota has turned to lithium-ion chemistries for their plug-in hybrid model, supporting the argument that higher energy densities are required to deliver a fit-for-purpose electric vehicle.
Molten salt
These are batteries which operate at elevated temperatures (ca. 300deg. C), and include sodium sulphur, sodium nickel chloride (e.g. the ZEBRA battery) and lithium iron sulphide. There has been some deployment in commercial vehicles and the THINK and Smart (in the first electric version only) cars.
High temperatures are required to keep the metal-salt electrolyte in liquid form and must be maintained even when the vehicle is not in operation. The energy and CO2 penalty
arising from this can be very substantial, and is a serious drawback to the use of molten salt batteries as a CO2 reduction technology in vehicles.
Complementary technologies: capacitors and flywheels
A capacitor is an electronic device that stores an electric charge, consisting of one or more pairs of conductors separated by an insulator. Capacitors are found in common electronic devices, and are used in circuit boards e.g. to create a time delay circuit, store a voltage, filter frequencies and block direct current.
Capacitors considered for vehicle applications are much larger and have a much higher energy density than conventional capacitors. They are “electric double-layer capacitors”, often called ultracapacitors or supercapacitors.
Capacitors can charge and discharge very quickly; their power density can be 10 times greater than for a lithium-ion battery. This characteristic makes them a good complementary technology: using capacitors in tandem with a battery insulates the battery from high power peaks and helps preserve its life. In practise, the added cost and complexity of capacitors do not make them an attractive solution for plug-in vehicles3. They are used in some hybrid vehicles (e.g. BMW 1 fuel cell hybrid vehicle) and there is on-going work to improve their suitability for use in vehicles and decrease their costs. Table 2-3 summarises the current status of capacitors. Their low energy density (<10Wh/kg currently, 20Wh/kg in development versus 100-180Wh/kg for current lithium-ion cells) disqualifies them as a storage solutlithium-ion for EVs. Although life characteristics are better than for batteries, capacitors suffer from life limitations too; parameters accelerating their degradation include: electrical aspects, temperature, vibrations, pressure and humidity.
2
Directive 2006/66/CE
3
Table 2-3 Capacitors current and target characteristics.
Available
capacitors4 Under development
Energy Max 5-6 Wh/kg 15-20 Wh/kg5
Life 106 cycles USABC target: 750k / 150,000 miles for HEV Cost $10,000/kWh6 USABC target: 130$/system (60Wh)
Flywheels, like capacitors, show higher specific power than batteries but lower specific energy (<50Wh/kg). They are not expected to power vehicles on their own but could be complementary technologies to batteries in the future.
Flywheels have been tried on vehicles in France in the 50’s, as well as in Switzerland (buses) as engine ‘power assist’. They are a good energy storage solution for stationary applications, but in moving applications they need complex stabilization mechanisms, which made them impractical for vehicle applications. Recent developments have seen new flywheel systems entering racing vehicle applications, but again this has been as a hybrid technology rather than an energy storage solution.
Summary
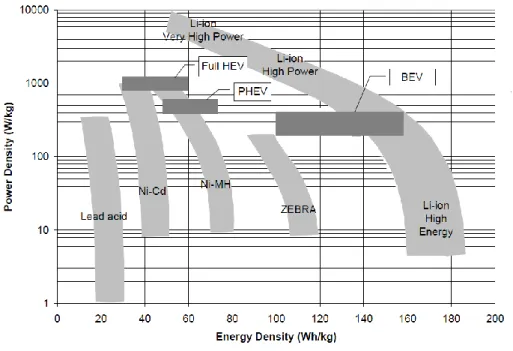
The above review describes that in automotive battery applications, and as can be seen in the graph below, the primary trend is increasing energy density. This has favoured a move towards lithium chemistries, even though other chemistries can demonstrate greater longevity, and lower specific costs. On this basis, the remainder of this section focuses on lithium chemistries, their operation, potential and their drawbacks.
Figure 2-4 - Ragone plot comparing power and energy densities of battery technologies. Source: CARB 2007
4
Mastragostino M., Lithium-ion batteries and supercapacitors for HEV, International workshop on distributed energy systems, Milano April 2009
5
Smith P., Jiang T. and Tran T., High Energy Density Ultracapacitors, Annual Merit Review, DOE Vehicle Technologies Program, Washington, D.C, June 2010
6
2.2.3 Lithium ion cells
In a Li-ion cell, lithium ions shuttle back and forth between the intercalating electrodes. The principle of intercalation is the reversible insertion of a guest atom (or molecule) into a host structure without inducing a major disruption of the host material.
This is represented in the figure below. In operation (discharge cycle), the positive (ions) and negative (electrons) charges leave the anode for the cathode: the flow of electrons across a potential difference in the external circuit can be used to do work (e.g. drive a motor) while the ions move across the electrolyte. In this case the guest atom is the lithium ion.
Figure 2-5- Schematic of ions (charge and discharge) and electrons (discharge) movements in a lithium ion cell. Source: Axeon
The next figure depicts cell components in more detail:
The most common active material for the anode is graphite. Current anode R&D focuses on developing materials that are safer, and have a higher capacity (charge per unit of weight) than graphite (~300 mAh/g).
The cathode active material is currently either a lithium metal oxide or lithium iron phosphate. Current R&D is focussing on improving the reversibility of the active material, and developing new active materials with higher voltages and/or higher capacity (mAh/g). The current highest reversible capacity used in commercial cells is approximately 160mAh/g. This is considerably lower than the anode capacity and therefore there is a greater R&D focus on the cathode than the anode.
Current collectors - also called foils - are made of aluminium at the cathode and copper at the anode. In the case of a lithium titanate anode the current collector is aluminium due to higher electrode potential Vs Li.
The separator provides separation of the electrodes while being porous to the conducting lithium ions. A polymer or solid electrolyte could eliminate the need for an additional separator, as these can act as both an electrolyte and a separator.
R&D efforts are directed at improving separator stability for safety and reducing separator thickness. The separator can be coated with a ceramic to improve thermal stability (developed by German company Evonic).
The electrolyte is liquid (or a polymer/liquid or gel), most typically a lithium salt (e.g. LiPF6) dissolved in organic solvents that conduct ions. Electrolyte additives can be used
to increase performance or improve cell life and safety (life and safety attributes are defined in the next section). The challenge of current R&D is to increase the voltage range the electrolyte can operate over, known as the electrolyte stability window.
Some solid materials could conduct as much as liquid electrolytes, with the advantage of avoiding leaks. One of the big challenges in using solid material is maintaining surface contact between electrodes and electrolyte over a wide temperature range, as the materials in contact have different thermal volume expansion properties.
2.2.4 Battery pack attributes
Cells are assembled in series (to build voltage) and parallel (to build capacity, Ah) into modules, which in turn are assembled into a pack. The total energy of the pack is the voltage multiplied by the capacity. The cell voltage for a given type of battery is more or less constant (e.g. lithium-ion cells are ca. 3-4V), while the capacity will vary based on the cell design and size. For this reason, when pack assemblers are buying cells, they are quoted prices in $/Ah rather than $/kWh and the battery capacity (Ah) is sometimes quoted rather than its energy (kWh).
The pack components ensure the cells are performing at their best, and they are briefly described here:
Battery Management System (BMS): an assembly of circuit boards that monitor the cells (e.g. temperature, voltage), and monitors the whole pack to determine state of health and state of charge. It ensures the safety of the pack and interfaces with the vehicle electronics and charger. Its cost increases with the number of cells it has to monitor.
Power electronics distribute the high currents and include safety devices: shunts, fuses, contactors and safety disconnect. Note that these are distinct from the power electronic devices required on the vehicle that outside of the
pack (e.g. DC-DC conversion for managing voltage/current between a pack and a motor driver).
Wiring harnesses are made to connect the main controller to the slave monitoring boards, wiring and connectors (containing copper). Connectors to the vehicle electronics have to pass automotive standards and sometimes require high ingress7 protection levels (IP), which contributes to cost.
Internal cell support: made of plastic and/or metal, it holds the cells together to the correct compression levels and allows a module assembly process. When the pack is liquid cooled, the cell support is more complex as it acts as a cooling matrix, e.g. it has a network of groves for the coolant to circulate through. Temperature control: heating, cooling, heatsinks, fans, etc. Maintaining the
battery pack in the optimum temperature window is essential to maintaining and extending battery life. For battery packs to be global products, both cooling and heating are needed. Cooling can be active or passive. In active cooling, a fluid (water, another liquid or air) cools the cell surface with forced circulation. In passive cooling, excess heat is dissipated from the side of the cell or pack without forced ventilation.
Delivering energy (kWh) and power (kW) are the first two obvious functions of a battery. There are, however, other attributes crucial to the viability of an electric vehicle. This section gives a short description of a selection of battery pack attributes and how they relate to its cost and performance in the cost modelling.
Energy
In the model, the usable energy (kWh) for a given vehicle is defined by the energy consumption and target vehicle range, for example a segment C&D car is fitted with 23kWh (useable energy) pack to deliver a 150 km range (from Table 2-1, page 4). The total energy of the pack is however always higher: the full window of charge is not used. A state of charge (SOC) of 100% and a depth of discharge (DOD) of 100%8 are avoided for several reasons:
To meet power requirements: batteries have lower discharge power at low SOC and lower charge power at high SOC.
To reduce safety risks: limiting the maximum SOC avoids overcharge situations. To maximise the battery life: lowering the DOD window extends the battery cycle
life. Some chemistries (e.g. manganese oxides) degrade when fully charged or fully discharged, due to chemical reactions with the electrolyte or cathode material. Calendar life is also affected by the maximum SOC (see below for definitions of cycle and calendar life).
This is schematically represented in the next figure. The SOC/DOD window is referred as DOD window thereafter for simplicity.
Although the DOD window varies with the battery chemistry and level of thermal management in place, a typical DOD window is 80% for BEV packs and 70% for PHEV9. It is lower for PHEV applications as the higher power to energy ratio makes the power requirement more difficult to meet at low state of charge. These are the baseline values used in the cost model. In this report, model results reporting cost per kWh refers to the total kWh rather than the useable kWh.
7
Such as ingress of water and particulates
8
SOC and DOD are interchangeable terms in the sense that 0% SOC = 100% DOD and vice versa. DOD is most commonly used when referring to life cycle and battery testing.
9
Figure 2-7 Illustration of a battery with 80% DOD/SOC window Power
The power (kW) a battery can deliver depends on the intrinsic properties of the chemistry (kinetics of particles involved), it varies across the SOC and is defined for different time intervals (continuous and peak, e.g. 2s). Power is the measure of how quickly the battery can release its energy. The battery power output informs the thermal management demand.
In operation, a power based battery may also be used with a constrained SOC window to ensure that the maximum charge and discharge performance is achieved across the entire usable energy window. Different chemistries have different degrees of variation of power capability with state of charge, due to variation in voltage profile and this must be taken into account when deriving SOC window.
For the purpose of a model looking at future costs, the power requirements of the modelled packs are defined by the peak motor output (see Appendix 8.1 for values). In a BEV pack, the large amount of energy carried for range requirements means the power requirements can be met easily i.e. the required pack discharge current is distributed through many/large cells so the power to energy ratio is low. In smaller capacity PHEV packs, the power to energy ratio is high: the battery cells must discharge at higher rates. This translates into a different cell design and higher thermal management demand and ultimately a higher cost per kWh for PHEV packs.
Voltage
The minimum nominal voltage (V) required from a pack today is typically 300 or 350V for cars, and can be up to 700V for vans. A higher voltage reduces losses in wiring and in the electric motor. Using packs of lower voltage would be cheaper at battery level but would effectively move the cost to other parts of the vehicle, e.g. the motor and electronic control equipment. In the cost model, a 300V pack requirement is assumed in all years.
Battery life
On standing, a battery cell deteriorates even if it is not used; it has a ‘calendar life’. The ageing is due to chemical side reactions occurring between the electrodes and electrolyte and any dissolved impurities. The ageing mechanism cannot be stopped, but can be significantly attenuated through storage at an appropriate temperature range and by the
Battery state of charge (SOC) /Depth of Discharge (DOD):
0% SOC 100% SOC 0% SOC 100% DOD 100% SOC 0% DOD Usable DOD/SOC window Total battery energy 29kWh Usable battery energy 23kWh Low discharge power,
overcharge risk, affects life State of charge (SOC)
seen by the driver:
Low discharge power, affects life
use of additives. Ageing has two outcomes: impedance growth (resulting in lower current output capability) and capacity (Ah) loss.
A battery also has a ‘cycle life’: it deteriorates when used; some lithium deposits and reacts, i.e. it will not intercalate at the electrodes and so will not carry charge. The battery capacity (Ah) is thus reduced. Typically the end of life for vehicular application is defined as the point when the battery capacity is less than or equal to 80% of its original capacity. Mechanisms for influencing battery life are well understood, and are similar for all chemistries, although they affect them to different extents. EV OEMs minimise the temperature impact through thermal management of the battery pack (e.g. forced air, liquid cooled) and they do not allow a full DOD window on the pack, i.e. they oversize the pack.
Table 2-4 lists the parameters influencing battery life and gives the life requirement as defined by the USABC (United States Advanced Battery Consortium, consortium of US car OEMs involved in battery research funding).
Battery life is critical for the economics of EVs both in terms of total cost of ownership but also in terms of the environmental impact10; both would greatly be affected if the battery must be replaced before the vehicle end of life.
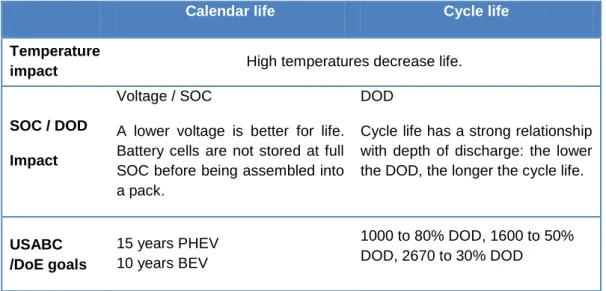
Table 2-4 Battery life dependencies and typical requirements
Calendar life Cycle life
Temperature
impact High temperatures decrease life.
SOC / DOD Impact
Voltage / SOC
A lower voltage is better for life. Battery cells are not stored at full SOC before being assembled into a pack.
DOD
Cycle life has a strong relationship with depth of discharge: the lower the DOD, the longer the cycle life.
USABC /DoE goals 15 years PHEV 10 years BEV 1000 to 80% DOD, 1600 to 50% DOD, 2670 to 30% DOD Safety
Lithium-ion batteries have several failure mechanisms that can lead to thermal runaway11 and thus cause a safety hazard. A thermal runaway can start from a sufficiently large internal short circuit or, following a shock, from deposited lithium that becomes very reactive. As cells contain combustible materials, in particular the electrolyte, a fire can develop.
There have been incidents in the past with lithium ion cells that have resulted in large scale and costly recalls of laptop batteries. Sony had to recall 340,000 laptop batteries in 2006 in the US alone, after overheating batteries caused property damage and minor
10
See DOI: 10.1021/es903729a for a life cycle analysis of EVs
11
Increase in temperature resulting in an increase reaction rate and net release of energy, increasing the temperature further.
burns12. No serious injuries have been caused by small battery pack thermal runaway, but with a large vehicle pack the consequences could be more dramatic. This is why the safety of battery cells is a prime concern for car OEMs.
Separators – which separate the electrodes and thus prevent short circuits – play a key role in terms of safety13. A lot of improvement work is taking place, for example preventing their softening at high temperatures. Evonik pioneered ceramic coatings to give better temperature stability. However this is not enough to make a cell perfectly safe. The quality of the electrode is the key to minimising the growth of dendrites (lithium deposits) which can push through the separator and thus create an internal short circuit14. The Sony laptop battery product recall was not due to inherent safety concerns around Li-ion cells and the materials themselves, but as a result of detectLi-ion of metallic particles due to manufacturing control issue. The metallic particles resulted in increased probability of dendrite growth and therefore short circuit. Also the chemistry in use at the time suffered from thermal runaway that could occur at lower battery temperatures and could occur naturally during discharge in confined spaces. Other Li-ion chemistries are safer, in that thermal runaway can only happen at more elevated temperatures that are not likely to occur during normal operation.
Quality manufacturing must be employed to ensure the quality of electrodes and thus improve cell safety. The quality of electrode manufacturing is defined by minimal variation of electrode characteristics such as thickness, porosity etc within one batch, and high repeatability, the ability to produce with high degree of uniformity across batches. Scaling up from small cells to large cells for EVs scales up the quality control challenge, because there is the need to control micro particles and ensure uniformity, but over a much bigger electrode area.
Automotive cell safety demands dictate the need for reduced contaminants in finished electrodes, i.e. cleaner working environments. Current best clean standards installed in cell manufacturing are ISO6 (maximum 1million particles ≥ 0.1 µm per m3
) while ISO4 or ISO5 (10,000 and 100,000 particles per m3) levels are needed for safety demands of automotive cells15.
Safety concerns at vehicle OEMs level translate into longer vehicle development lead times, due to cell testing. OEMs test cells assembled in pack in real-life conditions, e.g. pilot vehicles, for several months to ensure the final product is safe.
Other parameters
Battery packs have other attributes, briefly summarised here:
Operating temperature range, e.g. ca. -5°C to +40°C for today’s packs. For reference, the USABC minimum goals for long term commercialization are -40°C to +50°C (20% performance loss permitted) and long term goal -40°C to +85°C. The cost of technologies (pack thermal control) allowing for such a wide temperature range are not explicitly estimated in the cost model.
12
Source: U.S. Consumer Product Safety Commission
13
One of the reasons for laptop battery recalls were due to poor (thin) separators
14
Barnett, New safety technologies for lithium-ion cells and batteries, Batteries 2011 conference, Mandelieu, September 2011
15
Quass J., Benhamou E., Keil A., Advances in Battery Electrode Coating, Drying and Solvent Recovery System Design, Batteries 2010 conference, Mandelieu, September 2010
Charging rate: continuous charge rate (commanding pack recharge time) and pulse rate (regenerative breaking). Current generation batteries are specified at lower charge rates, but higher discharge rates. This is due to concerns about safety and the very close control that is required during high charge currents while ensuring safe operation. Future batteries might be required to handle charging rates higher than the typical current charging post (3 to 7kW). For reference, the USABC long term goal is 40-80% SOC in 15 minutes. Charging rate capabilities are not explicitly modelled.
Volume and mass. In the development of the specification of plug-in vehicles to model, an indicative maximum pack volume and maximum pack mass have been defined, see the Appendix 8.1.
Summary
Battery pack cost will be modelled for a selection of vehicles representative of the UK market: small cars, medium sized cars, high power cars and panel vans. Current vehicles attributes such as energy consumption are defined based on existing models while future vehicles attributes account for the expected light weighting and increased range. Drivetrains considered are pure electric and plug-in hybrid electric.
The general architecture of a battery has been presented: cells, module, thermal control and electronics controls.
Among the past and existing automotive battery technologies, lithium-ion has the highest energy density and has replaced other battery chemistries in production vehicles. On this basis, it will be the only technology modelled for the short term. Current lithium ion cells work on the principle of intercalation: reversible insertion
of a guest atom (lithium) into a solid host structure without inducing a major disruption of the host material (electrode materials).
Attributes of batteries have been presented. Some, such as safety and life, affects the lithium-ion battery pack design and cost as they require oversizing the pack and integrating an advanced thermal control.
3 Understanding current automotive cells
This section presents current lithium-ion cells, starting with historical development of cells, followed by performance and cost of automotive cells across the existing lithium chemistries16. Costs of automotive packs are then introduced, followed by a short description of the battery industry.
3.1 Historical trends of lithium-ion cells
The first commercial rechargeable lithium-ion cell, sold in Japan in 1991, had a lithium cobalt oxide cathode (LCO) and a hard carbon anode. Performance (e.g. Ah, Wh/kg) and the costs of cells have since significantly improved, materials have diversified and the market size has grown. Table 3-1 gives a snapshot of performance, cost change and market size for lithium-ion cells; these are commented in this section.
Table 3-1 Consumer market size and 18650 cell costs & size. Source: Avicenne 2011 and manufacturers’ data
1999 2011
Mobile phones sold (millions)
Li-ion cells 100 1,400
Ni-MH cells 200 0
Laptops sold (millions) – Li-ion cells 14 225 Tablets sold (millions) – Li-ion cells 0 65
Tons of Li-ion cathode material 4,583 55,000 Li-ion 18650 cell price ($/kWh) 2,600 240
Typical Li-ion 18650 size (Ah) 1.5 2.2
Performance trajectory and cell markets
From an initial 0.8Ah capacity, 18650 cells (the most common and mass produced model, a cylindrical 18 mm diameter, 65 mm high cell) reached 2.3Ah in 2005 and up to 2.6Ah today, corresponding to a specific energy increase from 90Wh/kg to around 200Wh/kg17. This remarkable trajectory is the result of several improvements:
- Moving from a hard carbon anode (~200 mAh/g capacity) to graphite anodes, (~280 mAh/g capacity)
- Introduction of electrolyte additives in 1998, allowing further graphitisation of the anode (from 280mAh/g to 360mAh/g)
- Engineering process improvements, packing efficiencies e.g. reduction of non active materials in the cathode (less carbon and less binder), increasing the weight of active materials from approximately 85 to 95%.
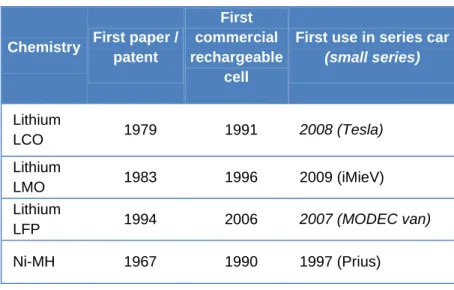
By 2005, engineering process improvements had reached their limit and further improvements in energy density or cost reductions had to come from other sources; new cathode materials (with higher capacity or lower cost) started to be developed. Table 3-2 gives a list of cathode materials used in commercially available lithium-ion cells. While some chemistries are now used in vehicles, the main cell market is still consumer electronics: phones, laptops and cameras etc (see Figure 3-1). Li-ion cells market share exceeded the cumulative share of Ni-Cd and Ni-MH cells by 2004, and now they account for 80% of the rechargeable battery market.
16
Usually referenced by the chemistry at the cathode
17
2.9Ah cells are due to enter the market soon, based on silicon/carbon anode, they correspond to 230Wh/kg
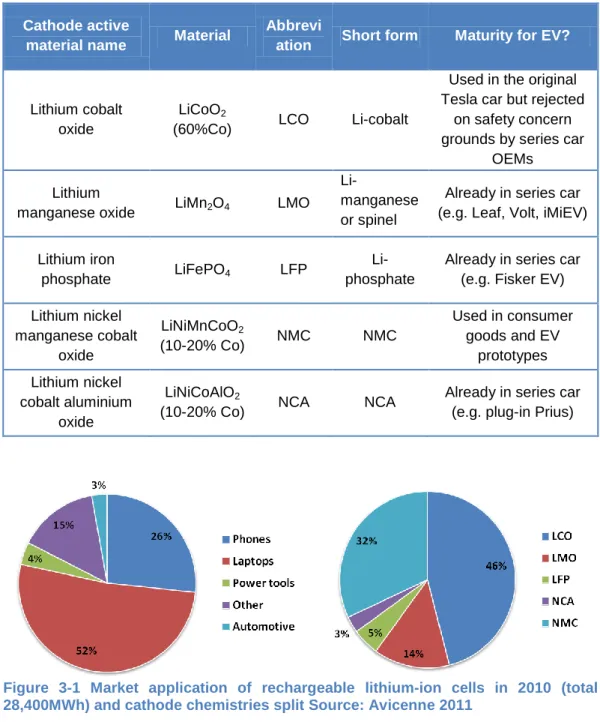
Table 3-2 Current or close to market cathode materials for automotive cells
Cathode active
material name Material
Abbrevi
ation Short form Maturity for EV?
Lithium cobalt oxide
LiCoO2
(60%Co) LCO Li-cobalt
Used in the original Tesla car but rejected
on safety concern grounds by series car
OEMs Lithium
manganese oxide LiMn2O4 LMO
Li-manganese or spinel
Already in series car (e.g. Leaf, Volt, iMiEV) Lithium iron
phosphate LiFePO4 LFP
Li-phosphate
Already in series car (e.g. Fisker EV) Lithium nickel manganese cobalt oxide LiNiMnCoO2 (10-20% Co) NMC NMC Used in consumer goods and EV prototypes Lithium nickel cobalt aluminium oxide LiNiCoAlO2
(10-20% Co) NCA NCA
Already in series car (e.g. plug-in Prius)
Figure 3-1 Market application of rechargeable lithium-ion cells in 2010 (total 28,400MWh) and cathode chemistries split Source: Avicenne 2011
Cost trajectory
The cost of 18650 cells was reduced mainly due to high volume production as well as some manufacturing efficiency gains. However, the cost of cells for EVs does not benefit directly from the small cell production optimisation. Scaling up the processes to make larger cells brings new challenges, especially around quality control, and the industry does not have the volume production experience yet. Interviewed cell manufacturers are of the opinion that the cost of large cells cannot go down to the cost of small mass produced cells, at least not without a decade of experience.
Development time
New chemistries developed for the consumer electronics market find their way to the vehicle market, typically many years later18. Table 3-3 provides some examples.
The industry consensus is that this lag between consumer cells and vehicle cells will remain constant because the development of a new product is easier (less stringent requirements, especially in terms of battery life) and lower risk in small battery sizes where the market is larger.
This means chemistries that are not already in use in consumer applications today are not expected to penetrate the automotive market for at least 5 years. The next chemistry in line to be used in series vehicles is the NMC cathode, already used in prototype vehicles.
As the published literature search reveals no chemistries demonstrating a step-change in performance increase entering the consumer cell market today, it is reasonable to assume there will be no step-change in automotive cell performance by 2020. Instead we expect a gradual performance improvement. In the longer term, as the automotive market increases, cells will be increasingly developed for that market.
The time lapse between proof of concept in lab and commercialization for successful battery chemistries is at least 10 years, and as the table below shows, may be significantly greater. This is the time it takes to go from one promising electrode chemistry, finding a compatible opposite electrode, and refining the cell (structure of materials, electrolyte etc) into a product with rate and life characteristics appropriate for consumer electronics.
This has profound consequences for the landscape of batteries for vehicles in the years to come: any new chemistry that is still at the proof of concept stage in the laboratory will not be expected to penetrate the automotive market for at least 10-15 years.
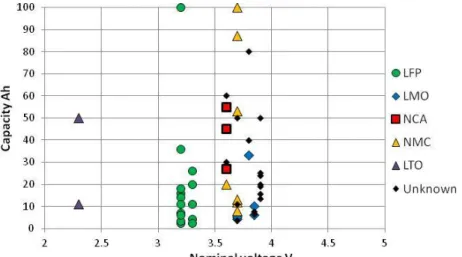
Table 3-3 Development time of chemistries from proof of concept to commercial cell
Chemistry First paper /
patent
First commercial rechargeable
cell
First use in series car
(small series) Lithium LCO 1979 1991 2008 (Tesla) Lithium LMO 1983 1996 2009 (iMieV) Lithium LFP 1994 2006 2007 (MODEC van) Ni-MH 1967 1990 1997 (Prius) 18
The only exception is the nano-structured lithium titanate anode which was developed by Altairnano for power applications other than small consumer cells such as grid support, uninterruptable power supply, military and transport.
3.2 Cost and performance of current lithium ion cells
The previous section introduced the general and historical lithium-ion cell market whereas this section focuses on describing the current lithium cells characteristics.
Cathode chemistries
As introduced earlier, several cathode materials have been developed since the original lithium cobalt oxide (LCO). Table 3-4 summarises the strengths and weaknesses of the current 5 cathode chemistries type19.
As mentioned earlier, LCO cathodes are not considered appropriate for automotive applications due to the safety risk they would present. Their high cobalt content, a material of high and volatile price, was a driver for developing alternative cathode materials.
Table 3-4 Comparison of performance of current lithium ion cells
Cathode LCO Lithium Cobalt Oxide LMO Lithium Manganese Oxide NCA Lithium nickel cobalt aluminium oxide NMC Lithium nickel manganese cobalt oxide LFP Lithium iron phosphate
Type Metal oxides Polyanion
Energy Power Safety Expected
cost High (Co) Low High (Ni, Co)
Medium to High (Ni, Co) Low Low temperature High temperature Cycle life Calendar life
LMO cathodes – also called spinel in reference to their structure – have the advantage of being based on non toxic and cheap manganese. The main limitation of LMO is the dissolution of manganese in the electrolyte, which translates into a shortened life, especially at high temperatures. Batteries based on LMO cathodes need advanced thermal management to mitigate this sensitivity to high temperature.
The NCA and NMC cathodes have had wide adoption in the laptop and power tool markets, taking market share away from the LCO cathodes, thanks to their lower cobalt content and overall good performance. NMC cathodes present more advantages in terms of both safety and potential for improvement of the reversible capacity mAh/g and voltage. They will therefore be taken forward to the cost model.
Poly-anion type cathodes, such as LFP, are considered intrinsically safer than metal oxide cathodes that can release their oxygen more readily and fuel a potential thermal
19
Note that the exact composition of the cathode material varies across suppliers and can be a mix of chemistries described here, e.g. Boston Power has developed a ‘LMO-LCO’ cathode.
runway. LFP is more stable at high temperatures than most chemistries, but its kinetics (i.e. power) are poorer at low temperatures; this is mitigated by processing the LFP into nano-sized particles, although this compromises the volumetric energy density.
Figure 3-2 plots the volumetric and gravimetric energy and power densities for a selection of currently available lithium-ion cells. While the energy density is clustered by chemistries, the power density shows a greater spread of values within each electrode type; this is linked to the internal design of the cell which can be adapted to be more power intense, e.g. by changing the way the active material is loaded on the electrode. There is a trade-off between high energy and high power: cells dedicated to power applications, i.e. PHEVs, are more power dense and less energy dense than cells designed for BEVs. Currently metal oxide cathodes are seen as the more likely candidates for BEVs whereas LFP is perceived as better for PHEV applications.
Figure 3-2 Energy and power densities of currently available lithium-ion cells. Compiled from manufacturer data
Expected life
Quality automotive cells can achieve today, in laboratory conditions20:
1,000 cycles or over at 100% DOD. There are variations across chemistries, with LFP being noticeably better.
5 to 10 years (or over) but this is very temperature dependent and varies across chemistries. This translates in the need for a very good thermal management in the car, especially for LMO, the most temperature sensitive chemistry in terms of calendar life. Cells with LTO (lithium titanate oxide) anodes show excellent life, possibly exceeding 20 years at ambient temperature.
Based on this, the cost model includes the cost of advanced thermal management in the packing costs, even in future costs.
The temperature impact on battery life is recognized by car OEMs; they provide guidelines on this to drivers, and caveat their warranty. For instance the Nissan Leaf warranty booklet stipulates, amongst other conditions, that the 8 years/100,000miles warranty on the lithium-ion battery “does not cover damages or failure resulting from or caused by exposing a vehicle to ambient temperatures above 49°C for over 24hours or storing a vehicle in temperatures below -25°C for over 7 days”.
20
Based on an independent third party analysis on competitive products.
Li
gh
te
r
Cell size
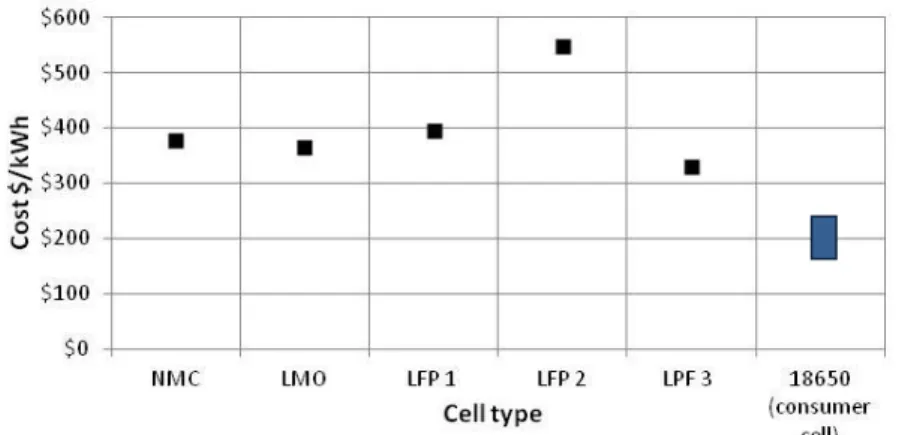
Cells for consumer markets are relatively small, with capacity lower than 10Ah. Driven by vehicle, grid support & IT markets, larger cells are entering the market. Figure 3-3 shows capacity and voltage of a selection of currently available lithium-ion cells. Each chemistry has a specific voltage band but can be manufactured in various sizes.
Large cells allow a reduction in the number of (parallel) cell strings in a car and thus bring pack assembly cost reductions. They are however more difficult to manufacture; the mechanical integration in pick and place, stacking and winding stages are more difficult to do accurately to ensure critical alignment of electrode stack with high uniformity. High capacity cell manufacture currently results in typically lower cell yield and slightly higher cell to cell variation compared to smaller format cells. As discussed earlier, the quality control in large format cells is more difficult when trying to prevent manufacturing problems such as the ingress of small particles that could lead to cell defects, given the large surface area of electrode per cell.
Our industry contacts consider that cells up to 40Ah are safe today for vehicle applications and that the 40-60Ah band is mostly of good quality. Cells above 60Ah are currently not generally dedicated to car applications, with the exception of converted vans that tend to use very large cells.
Figure 3-3 - Voltage and capacity of currently available lithium-ion cells. Compiled from manufacturer data.
Cost
Data on cell cost was collected through a survey of cell manufacturers; see Figure 3-4 for quoted cost of EV cells of comparable characteristics. There is no evident correlation between chemistries and price across quotes obtained from different suppliers.
One might expect that NMC cells (cathode based on expensive raw materials such as cobalt and nickel) and LMO (cathode made from cheap manganese) cells to reflect the difference in cathode material cost.
The feedback from project partners is that, in theory, there ought to be a difference but it is small and currently masked by strategic pricing: cell suppliers adapt their price to the customer or project depending on the size of the opportunity. There is no clear visibility on the real cost of lithium-ion cell chemistries. A predominant Japanese cell manufacturer currently providing cells for car OEMs revealed they have a client target of $300-350/kWh by 2015, without specifying the cathode chemistry.