Institut de Recherches Économiques et Sociales
de l'Université catholique de Louvain
Diasporas
M. Beine, F. Docquier and C. Özden
Diasporas
Michel Beine
a, Frédéric Docquier
band Ça¼
glar Özden
ca University of Luxembourg and CES-Ifo
b FNRS and IRES, Université Catholique de Louvain, IZA-Bonn and CReAM-London.
c World Bank, Development Research Group
Revised version - February 2009
Abstract
Migration ‡ows are shaped by a complex combination of self-selection and out-selection mechanisms. In this paper, we analyze how existing diasporas (the stock of people born in a country and living in an another one) a¤ect the size and human-capital structure of current migration ‡ows. Our analysis ex-ploits a bilateral data set on international migration by educational attainment from 195 countries to 30 OECD countries in 1990 and 2000. Based on simple micro-foundations and controlling for various determinants of migration, we …nd diasporas increase migration ‡ows, lower their average educational level and lead to higher concentration of low-skill migrants. Interestingly, diaspo-ras explain majority of the variability of migration ‡ows and selection. This suggests that, without changing the generosity of family reunion programs, education-based selection rules are likely to have moderate impact. Our re-sults are highly robust to the econometric techniques, accounting for the large proportion of zeros and endogeneity problems.
JEL Classi…cation: F22, O15
Keywords: Migration, self-selection, network/diaspora externalities.
Earlier versions of this paper have been presented at the "Migration and Development" confer-ence (Lille, June 2008), at the "Globablization and Brain Drain" conferconfer-ence (Tel Avid and Jerusalem, December 2008). The paper bene…tted from comments and suggestions by Luisito Bertinelli, Serge Coulombe, Caroline Freund, Eric Gould, Gordon Hanson, Will Martin, David McKenzie, Mario Piacentini, Samaschwar Rao, Hillel Rapoport, Assaf Razin, Mark Rosenzweig, Maurice Schi¤ and Antonio Spilimbergo. We would like to thank Sara Salomone for gathering data on guest workers’ agreements. The second author acknowledges …nancial support from the Belgian Federal Govern-ment (PAI grant P6/07 Economic Policy and Finance in the Global Equilibrium Analysis and Social Evaluation) and the TOM (Transnationality of Migrants) Marie-Curie research and training net-work. The …ndings, conclusions and views expressed are entirely those of the authors and should not be attributed to the World Bank, its executive directors or the countries they represent.
"On the day I left Nigeria, I felt sad because I was leaving my family behind. I believed I would return eight years later, probably marry an Igbo girl, and then spend the rest of my life in Nigeria But 25 years ago, I fell in love with an American girl, married her three years later, and became eligible to sponsor a Green Card visa for my 35 closest relatives, including my parents and all my siblings, nieces and nephews. The story of how I brought 35 people to the United States exempli…es how 10 million skilled people have emigrated out of Africa during the past 30 years. We came to the United States on student visas and then changed our status to become permanent residents and then naturalized citizens Our new citizenship status helped us sponsor relatives, and also inspired our friends to immigrate here." (Philip Emeagwali)1
1
Introduction
Diasporas constitute invisible nations that reside outside their origin countries. In 2000, there were over 6 million Mexicans working in the United States, more than 1.2 million Turks in Germany and more than 0.5 million Algerians in France. In relative terms, 45 percent of the Surinamese-born were in the Netherlands; about 35 percent of the native-born from Grenada were in the United States; over 25 percent of Samoans were in New Zealand. Despite some of these staggering numbers, migrant diasporas exhibit diverse patterns, especially in terms of their human capital and education levels. Only 6.5 percent of the 22,000 Angolans in Portugal have post-secondary education whereas this proportion rises to 80 percent among the 715 Angolans in Canada. In total, 90 percent of all Angolan migrants with post-secondary education live in just …ve destination countries in the OECD.
This paper explores the role of existing diasporas on the size, educational structure and concentration of migration ‡ows across di¤erent destinations. Understanding the role of migrant diasporas, especially how that role interacts with governments’ migration policies is a critical issue for both sending and receiving countries. In addition to the welfare of its citizens living under other countries’jurisdiction, sending countries’governments are concerned about the costs and bene…ts of migration on the residents who stay at home. For the receiving countries, migrants generate signi…cant externalities on the natives through capital and labor markets and as well public
1Extract of the keynote speech by Philip Emeagwali at the Pan African Conference on Brain
Drain, Elsah, Illinois on October 24, 2003. Philip Emeagwali won the 1989 Gordon Bell Prize, which has been called "supercomputing’s Nobel Prize", for inventing a formula that allows computers to perform their fastest computations - a discovery that inspired the reinvention of supercomputers. He was extolled by then U.S. President Bill Clinton as "one of the great minds of the Information Age" and described by CNN as "a Father of the Internet". He is the most searched-for scientist on the Internet.
…nance channels (see Borjas, 1994, 1995, 1999, Razin and Sadka, 2004, Friedberg and Hunt, 1995, among others). In short, regardless of question at hand, diasporas in‡uence the welfare of all parties concerned - families back at home in the origin country, potential migrants searching for better opportunities and the natives in the destination country.
A large literature in sociology and economics has identi…ed that migrants’ net-works facilitate further migration of people, movement of goods, capital, and ideas across national borders (see Rauch and Casella, 1998, Rauch and Trindade, 2002, Munshi, 2003, Rauch, 2003, Gao, 2003, Rapoport and Kugler, 2006, Docquier and Lodigiani, 2008). As it is presented repeatedly in the literature, the structure and the size of migration ‡ows arise from a complex mix of self-selection factors (wage di¤erentials, probability to …nd a job, welfare programs and amenities, migration costs, etc.) and out-selection factors (immigration policies at destination, mobility agreements, etc.). Our contribution is to show the role played by existing diasporas in shaping various characteristics of these ‡ows.
Several studies focused on the self-selection mechanism, generally disregarding network externalities. Extending Roy’s model (see Roy, 1951), Borjas (1987) demon-strate that migrants from poor countries with high returns to skills tend to be neg-atively selected, thus explaining how changes in the origin mix of US immigrants (from EU countries to Latin American and Asian countries) over time has a¤ected their average skills and performance in the US labor market. Assuming that migra-tion costs decrease with educamigra-tional attainment, Chiquiar and Hanson (2005) develop a model compatible with positive, negative and intermediate selections, depending on the range of the schooling distribution. They …nd that Mexican emigrants, while much less educated than U.S. natives, are on average more educated than residents of Mexico and tend to occupy the middle and upper portions of Mexico’s wage dis-tribution. In terms of observable skills, there is intermediate or positive selection of immigrants from Mexico.
Existing migrant networks play an important role on the migration decisions of potential migrants. Relying on the informational and …nancial support provided by the network, newcomers can lower their migration and assimilation costs. As dis-cussed in Massey et al. (1993), models of migrant diasporas are based on the theory of ‘network externalities’. In particular, Carrington, Detragiache and Vishwanath (1996) show that when moving costs decrease with the size of the network already settled in the destination (an assumption which is supported by many sociological studies), migration occurs gradually over time. Migration tends to follow geographi-cal, cultural or political channels and low-moving-cost individuals migrate …rst. Their presence lowers the migration costs of the next group and the process continues as long as bene…ts exceed costs of migration2. In addition to these cost-based network
externalities, diasporas attract new migrants via family reuni…cation programs if the
2Pedersen, Pytlikova and Smith (2008) also …nd evidence of strong network e¤ects in immigration
destination country government has implemented them. In most continental Euro-pean countries, family reuni…cation is the main route for many potential migrants. Even in one of the most selective country such as Canada, about 40 percent of immi-grants come under the family reuni…cation and refugee programs, rather than selec-tive employment or skill-based programs. Emegwali’s quotation perfectly illustrates these channels. Through network e¤ects (“our presence [. . . ] inspired our friends to immigrate here”) and family reuni…cation programs (“I became eligible to sponsor 35 relatives for a Green Card”), existing diasporas positively impact future ‡ows of migrants.
Only a few papers analyze the linkages between diasporas and the structure of migration ‡ows. Building on Chiquiar and Hanson (2005), Mc Kenzie and Rapoport (2007) start from the intermediate selection case (which re‡ects the Mexico-to-US pattern) and demonstrate that a decrease in migration costs generally has a stronger e¤ect on low-skill migration than on high-skilled migration.3 Using survey data from
Mexico, they show that the probability of migration increases with education in com-munities with low migrant networks, but decreasing with education in comcom-munities with high migrant networks. Taking advantage of a recent data set on international migration by educational attainment (see Docquier, Lowell and Marfouk, 2009), our paper generalizes this result by analyzing the role of diaspora size on the educational structure of migration from 195 countries to the 30 OECD countries. Accounting for the usual determinants of migration and correcting for several econometric problems, we show that larger diasporas increase migration ‡ows and lower their average edu-cational level, as expected. To reinforce this result, we analyze the e¤ect of diasporas on the geographic concentration of high-skill and low-skill migrants. We show that diasporas increase the concentration of low-skill migrants relative to high-skilled ones. Interestingly, diasporas explain a large portion of the variability of migrants’‡ows (71 percent) and selection (47 percent). These percentages capture both network ex-ternalities that lower migration costs and the e¤ect of family reuni…cation programs. Thus, without changing the generosity of these family reunion programs, education-based migrant selection rules are likely to have a moderate impact,especially in coun-tries hosting large diasporas. These results are highly robust to various econometric techniques, accounting for the large proportion of zeros and possible correlation of the network size with unobservable components of the migration ‡ows.
The remainder of the paper is organized as following. Section 2 describes migration data and presents some stylized facts on the size and structure of diaspora and mi-gration ‡ows. Section 3 derives testable predictions from a stylized theoretical model. Econometric issues are discussed and empirical results are presented in Section 4. Finally, Section 5 concludes.
3Bertolini (2009) provides also similar evidence from the Ecuadorian migration to Spain and the
US. The negative selection of Ecuadorian migrants to the US is largely explained by the size of the networks at destination.
2
Stylized facts
The term diaspora (in ancient Greek, "a scattering or sowing of seeds") refers to dispersion of any people or ethnic population, voluntarily or by force, from their tra-ditional homelands and the ensuing developments in their culture in the destination, mostly as a minority. In the economic sense, the diaspora refers to migrants who gather in relatively signi…cant numbers in a particular destination country or region. Some examples are the Turkish Gastarbeiter in Germany, South Asian workers in the Persian Gulf and Cuban migrants in the US.
Following this de…nition, we consider the size of a diaspora as the population (aged 25+) born in country i and living in country j. We use the Docquier, Lowell and Marfouk (2007, referred to as DLM from now on) database which extends and updates Docquier and Marfouk (2006). Based on census and register information on the structure of migrant communities in all OECD countries in 1990 and 2000, DLM database provides the stock of immigrants from any given country in each of the OECD countries by education level. The dataset covers only the adult population aged 25 and over, thus excludes children and students who emigrate temporarily to complete their education. In addition, migration is de…ned on the basis of the country of birth rather than citizenship4.
The main strength of the DLM database is that it distinguishes between three levels of education for migrants. High-skilled migrants are those with post-secondary education. Medium-skilled migrants are those with upper-secondary education com-pleted. Low-skilled migrants are those with less than upper-secondary education, including those with lower-secondary and primary education or those who did not go to school. The main characteristics of the diaspora that we consider in this paper are the following:
the size of the diaspora, measured as the population aged 25+ born in country
i and living in the OECD country j (6=i).
the education level of the diaspora, proxied by the log-ratio of the proportions of high-skill to low-skill migrants.
the concentration of the diaspora, measured as the Her…ndhal index applied to the distribution of the diaspora across di¤erent destinations.
Table 1 shows the 20 largest bilateral migrant communities residing in the OECD countries, both by overall size and by di¤erent education levels. The distinction
4Even though this is the standard de…nition of a migrant, especially in the economics literature,
the dataset does not include second generation children who are born in the destination country even though they might constitute an important part of a diaspora in the sociological sense. This is simply due to absence of comprehensive administrative data in tracking of the migrants’children. However, we expect diaspora sizes inclusive and exclusive of second generation to be highly correlated.
between skilled and unskilled diasporas and its consequences is one of the most im-portant contributions of this paper. With respect to the size, Table 1 allows to observe directly some of the determinants of the size of the diaspora, especially at a given destination country. As clearly seen in Table 1, the sizes of sending and receiving countries’populations are primary determinants of the size of the diasporas. That is why the United States appears as the home to many of the largest migrant commu-nities and larger developing countries (such as Mexico, Turkey, the Philippines and India) are the main sending countries. Other factors, such as wage di¤erentials, phys-ical distance, linguistic proximity, colonial links, immigration policies at destination, are also frequently identi…ed in the empirical literature as determinants of migration and clearly in‡uence the migration corridors listed in Table 1.
In order to shed some preliminary light on how existing networks a¤ect migration ‡ows and and especially their human capital (educational) composition, let us look at the size and the educational structure of the Turkish diaspora in three di¤erent European countries: Germany, Spain and Luxembourg. Turkey is an interesting case since it does not have any colonial links, has no linguistic proximity with any of the major destination countries5 but has large diasporas in a limited number of countries
like Germany (see Table 1). The geodesic distance between Turkey and the three considered European countries is broadly the same and wage levels at destination are not very di¤erent across destination countries (they are higher in Luxembourg and lower in Spain). The data on the size of diaspora and the educational structure of those diasporas display striking di¤erences. In 2000, there were only 194 Turkish migrants in Luxembourg, with 44% (26%) with a tertiary (primary) education level. In Germany, the corresponding …gures are 1.2 million Turkish migrants with 6% (86%) with a tertiary (primary) educational level. In Spain, there were 1040 Turkish migrants, with 33% (29%) with a tertiary (primary) educational level. This simple example highlights the striking relationship between migrants’networks and both the size and the skill composition of migration ‡ows.
What is the extent of the relationship between diasporas and migration ‡ows and how general is it in the data? Figure 1 provides another perspective and depicts the size of bilateral diasporas and the proportion of post-secondary educated (high-skilled) from four origin countries: Mexico, Morocco, Algeria, Mauritania. The curves are the exponential trends estimated for all origin countries and show that there is negative relationship between the diaspora size and the level of education. This …gure shows the importance of analyzing bilateral data with econometric models that account for origin and destination country speci…c e¤ects.
The next question is on the concentration/dispersion of migrants across di¤erent destinations. Figure 2 compares the concentration index (measured by the Her…nd-hal’s index) of high-skill and low-skill migrants and indicates that there is a positive relationship between the two. In other words, for many source countries, both the
5Turkish is an Ural-Altaic language. The only European languages that are grammatically close
high and low skilled migrants tend to be either concentrated in few destination coun-tries or relatively dispersed across the globe. A closer look also reveals that a larger share of the observations lie below the 45-degree line on the right side of the …gure indicating low-skill migrants are even more concentrated than high-skilled migrants if the overall migration is concentrated. On the other hand, more observations on the left side of the …gure are above the 45-degree line implying high-skill migrants are more concentrated if the overall concentration level is low. Another contribution of the paper is to empirically identify the determinants of the relative concentration (skilled vs unskilled) of the diasporas.
T a b le 1 . T o p -2 0 la r g e st b il a te r a l d ia sp o r a s T ot al d ias p or as Hig h ly sk illed diasp oras Lo w sk ill ed d ia sp or as Or igi n Destination S iz e Or igi n Destination Size Or igi n Des tination Size Me x ico Un . Stat es 6,374 ,825 Me x ic o Un. S tates 919, 139 Me x ico U n . States 4,454, 823 T urk ey German y 1, 272,00 0 Ph il ipp in es Un. S tates 833, 958 T urk ey G er man y 1,09 7,000 Ph ilipp in es Un. S tates 1, 163,55 5 Ind ia Un. S tates 664, 406 P or tugal F ra n ce 493, 459 Un. Kingdom A u stral ia 969, 004 Canad a Un. S tates 439, 163 Alg er ia F ranc e 4 30,941 Chin a Un . Stat es 841, 699 Ko rea Un. S tates 437, 264 El S al v ad or Un. S tates 39 3,157 Ind ia Un. S tates 836,780 Chin a Un. S tates 434, 547 Ital y German y 36 7,000 Vietnam Un. States 807,30 5 Un. Kingdom Un. S tates 418, 794 Moro cco F rance 336,3 75 Cub a U n . States 803, 500 Ger m a n y Un. S tates 387, 067 Cu ba Un. States 3 30,418 Canad a Un . States 715, 825 Un. Kingdom Aus trali a 381, 348 Ital y F ran ce 33 0,380 Ko rea Un. States 676,64 0 Un. Kingdom Canad a 365, 420 Vietnam Un. S tates 31 0,608 Ger m a n y U n . States 646, 815 Vietnam Un. S tates 347, 127 Chin a U n . States 280,42 2 Un. Kingdom Un . Stat es 637, 584 Cub a Un. S tates 307, 541 Dom. Rep . Un . States 275,0 17 El S al v a d or Un. States 619,185 T ai w a n Un. S tates 220, 280 Sp ai n F ra n ce 267, 219 Un. Kingdom Canad a 580, 250 Japan Un. S tates 202, 300 G u atemala Un. S ta te s 218 ,124 P or tugal F ran ce 53 6,236 Jamai ca Un. S tates 199, 321 Bu lgari a T u rk ey 211,1 72 Dom. Rep. Un. S tat es 527 ,520 Colom bia Un. S tates 184, 472 Ital y Un. S tates 20 6,460 Al ge ria F ranc e 512,7 78 P ol an d Un. S tates 182, 300 Ital y Ca n ada 20 0,665 Ital y Un. States 461,08 5 Ira n Un. S tates 174, 043 Un. Kingdom Austral ia 191,7 64 Ital y German y 456,00 0 Rus sia Un. S tates 156, 984 Uk raine P o land 190,57 8 Jamai ca Un . States 449, 795 Ph il ipp in es Canad a 154, 960 Ind ia Un. Ki n gdom 178 ,551 Sou rc e: Do cq u ier , Lo w ell and Marfouk (2009)
Figure 1. Percentage of highly skilled (Y-Axis) and Log size (X-axis) of diasporas for selected countries
Figure 2. Concentration of the high-skilled (Y-axis) and low-skilled (X-axis) diasporas
3
Theoretical foundations
We consider model of migration with a single skill type in order to model the e¤ects of diasporas. A worker endowed with h units of human capital earns a wage wih
in country i where wi is the skill price in that country. As in Rosenzweig (2008),
this structure re‡ects the assumptions that (i) the main source of variation in wages within a country is the di¤erences in the human capital levels (h) of the residents and (ii) the source of variation in wagesacross countries is the di¤erences in average skill levels and skill prices (wi). The individual utility is linear in income but also depends
on possible moving costs and characteristics of the country of residence. The utility of a type-h individual born in country i and staying in countryi is given by:
uii(h) = wih+Ai+"i
whereAi denotes countryi’s characteristics (amenities, public expenditures, climate,
etc.) and "i is a iid extreme-value distributed random term. The utility obtained
when the same person migrates to countryj is given by
uij(h) =wjh+Aj Cij(:) Vij(:) +"j
The migration costs are divided into two categories. Cij captures moving and
assimilation costs that are borne by the migrant. These would include transportation costs, expenditures to learn the new language, …nd a job and obtain necessary licences to practice a profession etc. Vij represents policy induced costs borne by the migrant
to overcome the legal hurdles set by the destination country’s government’s policies. These costs include visa fees, the bureaucratic barriers for citizenship or even the amount paid to smugglers above the normal cost of transportation when legal entry is restricted. For simpli…cation, we slightly abuse the terminology and refer to Cij
as migration costs and to Vij as visa costs. They both depend on the existing
diaspora networks and human capital level of the migrant as explained below. The main motivation to di¤erentiate between these two types of costs is to identify the role of government’s policy on migration ‡ows and characteristics.
Let Ni denote the size of the native population that is within migration age in
country i. When the random term follows an iid extreme-value distribution, we can apply the results in McFadden (1974) to write the probability that a type-hindividual born in countryi will move to countryj as
Prhuij(h) = max k uik(h) i = Nij Ni = Pexp [wjh+Aj Cij(h) Vij(h)] kexp [wkh+Ak Cik(h) Vk(h)]
Similarly, the ratio of emigrants in country j to residents (Nij=Nii) is given by the
following expression
Nij
Nii
= exp [wjh+Aj Cij(:) Vij(:)] exp [wih+Ai]
or, in logs,
ln Nij(h) Nii(h)
= (wj wi)h+ (Aj Ai) Cij(:) Vij(:) (1)
The ratio of immigrants to di¤erent destinations (Nij=Nik) or migrants to the same
destination with di¤erent human capital levels may be expressed using similar ex-pressions.
Migration costs,Cij, depend on factors such as physical distance (di;j), destination
and origin countries’ social, cultural and linguistic characteristics (xi; yj) as well as
human capital level (h) of the migrant and the size of the diaspora abroad (Mi;j).
Thus, we write
Cij(h) =c(dij; Mij; xi; yj;h) (2)
Distance has a negative e¤ect on migration so c0d > 0. Because social networks lower information, assimilation and adaptation costs, diaspora has a positive e¤ect on migration and lowering of costs soc0M <0. The assumption c0h <0captures the facts that skilled migrants are better informed than the unskilled, have higher capacity to assimilate or have more adaptive skills and, thus, face lower migration costs. Finally, we assume that the advantages of being skilled are likely to be more important when the diaspora size is small and migrants can not rely on others. When the diaspora size is larger, the cost advantages of being skilled decline, i.e. c00hM >0.6
The legal (or the visa) costs, Vij, are determined by the destination country j’s
government’s policies and depend on various factors. These policies can be speci…c to sending country i or depend on individual characteristics of the migrants. Many destination countries have speci…c programs for family reuni…cation or for highly skilled individuals. Other countries sign bilateral free mobility agreements or grant automatic citizenship based on colonial links, common ethnicity or religion. The green card lottery program of the US, for example, has country-speci…c quotas.
Diasporas a¤ect the visa costs mainly through family reuni…cation programs. Let
fj denote the generosity of the family reuni…cation program of countryj which
gener-ally does not discriminate between di¤erent origin countries. The probability that a potential migrant from countryi has a relative in countryj is an increasing function of Mij=Ni. Thus, the overall e¤ect of reuni…cation programs on visa costs depends
on the expression fjMij
Ni .
The migrant’s human capital level also a¤ects the visa costs if there are selective immigration programs such as the H1-B program in the US. We denote the generosity of economic migration programs asej and the overall e¤ect of human capital on visa
costs depends onejh. Finally, we formalize the presence of free mobility agreements
(such as those between EU members) through a dummy variable bij which is equal
6Analyzing the Mexican migration to the US, Mc Kenzie and Rapoport (2007) provide evidence
to one if an agreement exists. As a result, we de…ne visa costs as
Vij(h) = (1 bij)v
fjMij
Ni
; ejh (3)
Policy variables, fj and ej, only matter for origin countries that do not have free
mobility agreements with country j (when bij = 0). The partial derivatives of v(:)
with respect to both of the arguments are negative, v0f <0; ve0 <0, v00f f; v00ee ? 0 and
vef00 (:) > 0: the probability that an individual relies on family reunion program de-creases (resp. inde-creases) when economic program becomes more (resp. less) generous orvice versa.
The net e¤ect of human capital level on visa costs is given by
@Vij @h = (1 bij)ejv 0 e fjMij Ni ; ejh <0;
The e¤ect of human capital on visa costs also depend on the size of the diaspora. When the diaspora size is bigger, the probability that a migrant relies on an economic migration program declines and the probability he relies on family reunion programs increases. Hence, we have
@(@Vij=@h) @Mij = (1 bij)ej fj Ni vef00 fjMij Ni ; ejh >0
since vef00 (:) is positive. With these de…nitions in place, we can write (1) as
ln Nij(h) Nii(h) = (wj wi)h+ (Aj Ai) c(dij; Mij; xi; yj;h) (4) (1 bij)v fjMij Ni ; ejh Self Selection
This simple model and the underlying assumptions allow us to analyze major characteristics of diasporas, especially how the existing diaspora in‡uences the size of migrant ‡ows, their composition in terms of human capital and concentration across di¤erent destinations. Before proceeding to these questions, we …rst analyze how changes in human capital level in‡uence the migration decision of the individual and the overall migration level. From equation (4), we have
@ln [Nij(h)=Nii(h)] @h = (wj wi) c 0 h (1 bij)ejv 0 e (5) which is positive if c0h (1 bij)ejv 0 2 fjMij Ni ; ejh > wi wj 7.
7In practice, some reported zeros might not re‡ect the actual absence of migrants. Due to
con…dentiality and disclosure rules, some statistics o¢ ces report a zero when the diaspora size is lower than a threshold value. We are not able to distinguish these cases from "true" zeros.
In the case of South-North migration, we have wj > wi and, therefore, above
condition always holds. Hence, level of of migration increases with human capital levels and positive selection is observed. Positive selection is even stronger when network e¤ects on moving costs c0h are large and when the host country has a selective immigration policy (i.e. ej is large). We should note that positive selection
does not imply that there are more skilled emigrants than unskilled emigrants, but the higher-skilled have a higher propensity to migrate. If the proportion of the highly-skilled among natives is low (such as in Africa), there will still be more unhighly-skilled than skilled migrants in destination countries. However, the ratio of the skilled to the unskilled will be higher among migrants when compared to natives. For other types of migration (between rich and rich, between poor and poor, or from rich to poor countries), we might havewj wi <0. In that case, negative selection could emerge.
Diaspora Externalities
We now turn to diaspora e¤ects on the size and structure of migration ‡ows. First, from (4), a large diaspora in destinationj unambiguously increases current migration ‡ows to j fromi: @ln [Nij(h)=Nii(h)] @Mij = c0M (1 bij) fj Ni v0f >0 (6) The overall impact depends on the e¤ect of networks on migration costs (c0M) and on the generosity of family reunion programs (fj) together with the e¤ect on visa
costs (v0f). Second, we show that a larger diaspora in country j reduce the ’positive selection’of migrants toj from i:
@2ln [N ij(h)=Nii(h)] @h@Mij = c00hM (1 bij)ej fj Ni vef00 <0 (7) Immigration Policies
What are the implications of these results for immigration policies? Obviously, a more generous immigration policies, both in terms of family reuni…cation and eco-nomic immigration programs, at destination increase the size of immigration ‡ows:
@ln [Nij(h)=Nii(h)] @fj = (1 bij): Mij Ni :vf0 >0 (8) @ln [Nij(h)=Nii(h)] @ej = (1 bij):h:v 0 e>0 (9)
Immigration policies also a¤ect the selection of immigrants. Since vef00 is positive, stronger emphasis on family reunion programs (higher fj) reduces the quality (i.e.
the positive selection) of immigrants:
@2ln [Nij(h)=Nii(h)] @h@fj = (1 bij):ej: Mij Ni :v00ef <0
The e¤ect of stronger economic migration programs (higher ej) on the selection of
immigrant is somewhat ambiguous since the …rst term of the expression below is positive and the second term is negative. A close inspection, however, shows that the net e¤ect is likely to be positive unless vee00 is strongly negative.
@2ln [Nij(h)=Nii(h)] @h@ej = (1 bij):v 0 e (1 bij):ej:h:v 00 ee?0
Our simple model provides many interesting insights and gives rise to many testable predictions. Due to data availability (especially, in the absence of detailed data on bilateral immigration policies), we focus on some important predictions of the empirical section. These can be summarized as follows:
The e¤ect of diasporas on the migration ‡ows is unambiguously positive. This impact is composed of the reduction of migration costs and visa costs through a stronger family reuni…cation e¤ect. Both e¤ects yield a total positive impact. The e¤ect of diasporas on the selection of migrants and the skill ratio is negative. A larger diaspora lowers migration and visa costs for all skill levels but the intensity of reduction is stronger for low-skilled migrants.
The impact of diasporas on the concentration level should be in line with the e¤ect in terms of selection. In particular, if diasporas tends to bene…t a nega-tive selection process, it should increase the concentration of low-skill migrants compared to the concentration of high-skill migrants.
4
Empirical Analysis
In this section, we analyze the determinants of the important characteristics of inter-national migration ‡ows - their size, their educational composition and their relative concentration by education level across di¤erent destination countries. In particular, in line with the theoretical model, we assess the impact of existing diasporas as well as other factors that in‡uence migration ‡ows. We start with OLS regressions but also account for important econometric problems using other techniques. The …rst important issue is the high proportion of observations with either zero or unde…ned values8. The second one is the correlation between the diaspora size and the error
term, due to the presence of some unobservable bilateral components that a¤ect both the size of the diaspora and migration ‡ows. One important aspect of the whole analysis is the robustness of the main results to alternative estimation techniques.
8Some reported zeros might not re‡ect the actual absence of migrants. Due to con…dentiality
and disclosure rules, some national statistics o¢ ces report zero when the diaspora size is below a threshold level. We are not able to distinguish these cases from "true" zeros.
4.1
Size
The …rst question we ask is on determinants of migration ‡ows and the role of the diaspora size. In equation (4), the dependent variable isln [Nij(h)], i.e. the log of the
migration ‡ow between 1990 and 2000 from countryito countryj of individuals with skill level h. We proxy it by taking the di¤erence of the migration stocks observed in 1990 and 2000.
Among the main determinants of migration ‡ows in equation (4) are the wage dif-ferential (speci…c to each skill level), migration costs and the factors in‡uencing visa costs and other legal barriers. In Appendix B, we report the data sources and the way we construct measure the explanatory variables that proxy determinants of migration ‡ows. We have good estimates for skill prices in destination countries (wj) but fairly
imprecise data on wages at origin (wi) in order to construct the wage di¤erential
variable (wj wi). One way of resolving this problem is to include origin country
dummies i that capture the combined e¤ect of all unobserved characteristics of the origin country i on the migration ‡ow to country j. These origin country dummies also capture the role of stock of residents with education level h (ln [Nii(h)]) as well
all migration costs speci…c to the origin country (xi) in equation (4). Pair-speci…c
factors in‡uencing migration costs are captured by geographical distance between the two countries, colonial links (a dummy variable) and linguistic proximity. We also introduce a dummy variable indicating whether the two countries are subject to the Schengen agreement favouring the mobility of persons within the European Commu-nity. The set Aj includes destination-speci…c variables that a¤ect the attractiveness
of countryj in terms of migration such as population sizea and social expenditures as a share of GDP (as a measure of the extent of social welfare). The proxy for selective immigration policies is measured by the share of refugees in immigrants admitted in 1990 by country j. Finally, we capture diaspora e¤ects by size of the diaspora in 1990 and denoted by the variableMi;j: It should be clear that the estimated impact
of Mi;j in the estimation is a combined e¤ect throughCij (network e¤ects that lower
migration costs) and the impact on Vij (family reuni…cation e¤ects that lower visa
costs).
Introducing these variables, we get a …rst speci…cation for the migration ‡ow with observable destination speci…c variables:
ln [Nij(h)] = 0+ 1ln (Mij) + 2di;j + 3wj + 4Aj + i+ ij (10)
where ln [Nij(h)]is the change in the migrant stock observed between 1990 and 2000
from country i to country j with education level h, Mij is the size of the diaspora
in 1990, di;j is a vector of other observable bilateral variables a¤ecting the migration
costs as described above, wj is the level of wages at destination and Aj is a set of
other destination speci…c variables thought to a¤ect the attractiveness of country j. Above speci…cation assumes that the e¤ect of all destination country speci…c vari-ables is well captured by wj and Aj. This is obviously a strong assumption as it is
very likely that other factors play a signi…cant role in attracting migrants in country
j. In addiition, some variable such as the immigration policy might be measured in an imprecise way. The empirical measurement of immigration policies is a well known challenge in the literature and has so far not received a full satisfying treatment. Since we are mainly interested in estimating the impact of Mij , in the next speci…cation,
we introduce destination country dummies j that capture the combined impact of unobserved characteristics of host countries:
ln [Nij(h)] = 0+ 1ln(Mij) + 2di;j+ j+ i+ ij: (11)
Compared to the previous model in (10), introduction of destination country dummies lead to an improvement of the speci…cation and thus can minimize the case of a misspeci…cation bias. Our results in the next section show that insertion of destination …xed e¤ects leads to an increase in theR2 by more than 10 percents. This model should thus be preferred, at least as far the estimation of 1 is concerned.9
4.2
Selection
We use the selection ratio, the number of skilled over unskilled migrants, as the proxy for educational (or the human capital) structure of migration ‡ows and diasporas. It is de…ned as Sij =
Mij(s)
Mij(u), where Mij(s) and Mij(u) refer to the number of skilled and unskilled migrants respectively. In line with Grogger and Hanson (2008) and the original de…nition in Docquier, Lowell and Marfouk (2007), we de…ne skilled and unskilled migrants as migrants with post-secondary and primary education levels, respectively . Equation (4) can be manipulated to be written in terms of the ratio of di¤erent skill levels to the same destination as a result of the extreme-value assump-tion of the error term. Depending on the introducassump-tion of destinaassump-tion dummies or not, the estimated equations are :
ln(Sij) = 0+ 1ln(Mij) + 2di;j + 3wj + 4Aj + i + ij (12)
and
ln(Sij) = 0+ 1ln(Mij) + 2di;j+ j+ i+ ij (13)
The availability of data for 1990 also allows us to study the impact of diaspora on the change in the selection ratio (which is broadly equal to the selection ratio of new migrants). The two estimated speci…cations are then obtained by substitutingln(Sij)
by its change between 1990 and 2000, ln(Sij).
9Of course, the cost of adopting speci…cation (11) is that, we can not estimate the impact of
destination speci…c variables such as the wage levelswjin host countries. Please refer to Rosenzweig
4.3
Relative concentration
We also explore the relative concentration of diasporas across education levels. In particular, we ask whether diasporas tend to lead to more concentration of unskilled rather than skilled migrants at a given destination. We construct our destination-speci…c relative concentration measure as the following:
Cijs Ciju = " Mij(s)= X i Mij(s) #2 " Mij(u)= X i Mij(u) #2
where indices s and u refer to skilled and unskilled migrants. A nice property of this bilateral measure is that its sum across destination countriesj boils down to the di¤erence between Her…ndhal indices for skilled and unskilled migrants.
Once again, we consider regression models with and without destination dummies and consider regression on levels (relative concentration Cs
ij Ciju observed in 2000)
and on change between 1990 and 2000. The models for the levels are :
Cijs Ciju = 0+ 1ln(Mij) + 2di;j + 3wj + 4Aj+ i+ ij (14)
and
Cijs Ciju = 0+ 1ln(Mij) + 2di;j + j+ i+ ij (15)
The speci…cations relative to the changes are obtained by substituting Cs ij Ciju
relative to 2000 by (Cijs Ciju)where refers to the change between 1990 and 2000. The latter speci…cation is particularly demanding since the dependent measures "a di¤erence in di¤erences" of concentration rates.
4.4
Econometric issues
The estimation of models (10-15) entails several econometric challenges that might lead the estimation of those models by OLS to generate inconsistent estimates. There are two basic reasons. The …rst one is related to the occurrence of zero or unde…ned values for the dependent variables in a large portion of the observations. The second one is the potential correlation of ln(Mij) with ij due to the presence of an
unob-servable component a¤ecting the size of the diasporas and the characteristics of new migrants. We now discuss how we address these issues
4.4.1 Zero or unde…ned values for dependent variables
One of the most important features of our dataset is the high proportion of zero observations either for the size of diasporas in 2000 or for the ‡ows of migrants between 1990 and 2000. This naturally occurs in many migration datasets as there is almost none or minimal migration for many country pairs. Pooling the data across the two periods, we have zero values in about 31% of the observations for the stock of migrants and in around 36% for the ‡ows.
Our model is fully consistent with such large number of zero observations. Pre-dicting a continuous number of emigrants, our model is an approximation of the "discrete-number" real world with Nij(h) 2 N. If ln [Nij(h)] < 0, less than one
mi-grant wants to leave her country10. This means that the bilateral migration ‡ow is nil. The probability that Ni;j(h) = 0 is
Pr [(wj wi)h+ (Aj Ai) Cij Vij + ln [Nii(h)]<0]
This case might arise for a number of reasons such as low wage di¤erentials, large distances, high migration or visa costs. In turn, those latter costs obviously depend on the size of the existing diaspora.
Large number of zero observations occurs frequently in other empirical studies in international economics such as gravity equations in trade models. In the estimation of models (10-11) by OLS for the size of migration ‡ows, the high occurance of zero values is likely to lead to inconsistent estimates. The use of a log speci…cation drops the zero observations from the sample which is likely to result in biased estimates of the impact of diasporas and other variables on the migration ‡ows and their selection. For instance, it might be the case that there are no migrants from countryito country
j because migration costs are too high. In turn, migration costs might be too high because distance is too high and there is no diaspora. In this case, the exclusion of those observations leads to underestimation of the impact of the variables a¤ecting the migration costs such as distance, colonial links, linguistic similarities or diasporas. The …rst alternative is to use Poisson regression models that relies on pseudo maximum likelihood estimates, as advocated by Santos Silva and Tenreyro (2006) who show that the use of log linearization for gravity models leads to inconsistent estimates of the coe¢ cients (such as the one relative to distance). A …rst reason, as mentioned before, is the exclusion of zero observations for the dependent variable. A second reason is that the expected value of the error will depend on the covariates of the model and hence will lead to estimation biases of the coe¢ cient. In order to address that, we carry out Poisson regressions of the models explaining the size of the migration ‡ows (i.e. models 10-11). The Poisson solution is nevertheless unfeasible for the selection and the concentration analyses. For the selection, the existence of zero values for Mi;j(h) leads to unde…ned values for Sij, which cannot be handled
by the Poisson approach.11 For the concentration regressions, we end up with many
10In practice, some reported zeros might not re‡ect the actual absence of migrants. Due to
con…dentiality and disclosure rules, some statistics o¢ ces report a zero when the diaspora size is lower than a threshold value. We are not able to distinguish these cases from "true" zeros.
11Strictly speaking, the estimation of models (12-13) leaves out a set of observations for two
reasons. The main reason is that the selection ratio is unde…ned due to the fact that Mij(u) = 0;
i.e. the size of the unskilled diaspora is equal to zero. Poolling the data across the time periods, the fact that there is no unskilled diaspora leads to the exclusion of 35.7% of the observation. A second minor reason is that the use of the log of the skill ratio leaves out observations for which we observedMij(s) = 0 and Mij(u)>0; i.e. a diaspora with some unskilled migrants but no skilled
negative values (more concentration for the unskilled compared to the skilled), which precludes the use of Poisson regression since they are count data models.12
A second alternative involves techniques accounting explicitly for a potential se-lection bias by two-step Heckman regression. In general, for all the features that we analyze (migration ‡ows, selection and relative concentration), the …rst step involves the estimation of a selection equation - the probability for a given country pair to have a positive migration ‡ow.13 The usual procedure implies the use of an instru-ment in the probit equation, i.e. a bilateral variable that in‡uences the probability of observing a diaspora between the two countries but does not in‡uence the size of this diaspora.
It is di¢ cult to …nd such an instrument but one possible candidate is diplomatic representation of the destination country in the origin country. Diplomatic represen-tation might a¤ect the probability of having at least one migrant by setting some kind of threshold on the initial migration and visa costs faced by potential migrants. In the absence of any diplomatic representation of countryj in countryi, the cost to get a visa can simply be too high so that nobody would consider to migrate to coun-try j: The role of diplomatic representation in the migration process is to a certain extent analogous to the role played by a common religion for trade relationships. As argued by Helpman et al.(2007), a common religion (a proxy of costs of establishing business linkages) a¤ects the extensive margin of trade (i.e. the probability of export) but not the intensive margin (i.e. trade volumes). In regressions (10-13), the use of a two-step Heckman approach yields intuitive results both for the ‡ow and for the selection equation. In particular, for the selection equation, we …nd that diplomatic representation of country j in county i tends to positively a¤ect the probability of observing a diaspora of countryiin countryj. Furthermore, the mills ratio turns out to be signi…cant in the ‡ow equation, suggesting that accounting for a selection bias is important.
Since the observed level of diaspora in 1990 is used as a regressor, the use of diplo-matic representation leads to some collinarity problems in the selection equation. In order to mitigate the collinearity problems, it is possible to run Heckman two-step
migrants. The log transformation leads to a further exclusion of 256 pairs of countries (for 1990 and 2000), i.e. to an additional exclusion of 2.1% of the total observations.
12For the relative concentration, we could include in the OLS regressions zero values. Nevertheless,
in order to have consistent subsamples with the analysis of selection and size, we consider a subsample of pairs for which we have non zero values forCs
ij Ciju:These zero values are exclusivelyrelated to
zero values for both concentration indexes , i.e. correspond toCs
ij = 0andCiju = 0:In other words,
we have no case for which concentration levels would be positive and exactly similar between skilled and unskilled.
13To be more precise, for the analysis of migration stock, the probability that a given observation
will be included in the regression is directly related to the probability of observing a diaspora (either regardless of the skill level, either for a particular skill level) for this country pair. For the migration ‡ows, the probability is exactly the same since we have no case of zero migration ‡ow with positive values of the stock in 1990 and 2000. For the analysis of selection, the probability is related to the existence of a diaspora or at least a skilled diaspora.
regressions without any additional instrument. As stressed by Wooldridge (2002), the use of an additional instrument in the probit equation is not strictly necessary. The drawback of not using an additional instrument is that the Mills ratio might become highly collinear with the explanatory variables of the ‡ow equation, which in turn lowers the signi…cance of the coe¢ cients. This is not the case for most of our regressions. This method will therefore be used in the benchmark regressions. Nev-ertheless, as a robustness check, we carry out the same regressions using diplomatic representation as an instrument (See Appendix A).
4.4.2 Correlated unobservables with the diaspora
One issue in identifying and estimating endogenous social e¤ects (like the network e¤ects in this paper) is the presence of unobservable correlated e¤ects as explained by Manski (1993). In our framework, it could be the case that unobservable bilateral components a¤ect the size of the diaspora Mij and the dependent variables. For
instance, unobserved cultural proximity between countryiand countryj might a¤ect simultaneously the stock of migrants, the current ‡ows of new migrants and their selection. The cross-sectional nature of the data prevents us to estimate directly those unobservable components. Therefore, those e¤ects will be included in the error term, which in turn leads to some kind of omitted variable bias and to some correlation between Mij and the error term.
We follow Munshi (2003) and proceed to a variable instrumental estimation of model (11) and (13) in order to address this issue and check the robustness of the results. In each case, we consider two instruments, i.e. variables correlated with
Mij but uncorrelated with the migration ‡ows or the selection ratio. The use of two
instruments allows us to check the empirical validity of this second condition through Hansen over-identi…cation tests. Our …rst instrument is a dummy variable capturing whether the two countries were subject to a temporary guest worker agreement in the 60’s and 70’s. One can expect those guest worker agreements to exert a strong impact on the initial formation of a stock of migrants in the 60’s and the 70’s, hence in‡uencing the stock in 1990. In contrast, it is unclear why those initial agreements would in‡uence the contemporaneous migration ‡ows beyond the impact exerted by the diaspora itself. Examples of such a process are illustrated by the impact of the post-war guest worker agreements between Belgium and Italy or Spain.
The second instrument is a variable capturing the unobserved diaspora in the 60’s through a combination of variables representing some push factor in country i, size in countryi;openness and size in countryj and distance betweeni andj. The basic measure is
IVij ln(popi immstj=distij) conf li
where popi is the population size in the 60’s of country i, immstj is the immigration
stock of country j in the 60’s, distij is the distance betweeni and j and conf li is a
60’s.
Our instrument should be correlated with the size of the diaspora observed in 1990. The variable popi is used as a proxy for the size of potential migrants in
sending countryiwhileimmstj is a proxy of the openness and the size of the receiving
countryj in the 60’s. The product of the two is divided by the distance between the two countries captures the size of migration costs. This variable is multiplied by the con‡ict variable speci…c to the sending country to capture push factors causing people to leave country i. If this last variable is not correlated too much over time, this should impact the stock of migrants in the 60’s but not the ‡ows of migrants coming from countryi in subsequent periods such as the 1990-2000 period. In other terms, the low degree of serial correlation in the conf l variable ensures that our IVij
variable is uncorrelated with our dependent variable, as the usual over identi…cation test supports the exclusion restriction.
We only consider con‡icts observed between 1946 and 1960 in order to capture push-factors leading to emigration in the 1950s and 1960s. We distinguish minor con‡icts (number of battle-related deaths between 25 and 999) denoted CONFL1 and wars (at least 1,000 battle-related deaths in a given year) denoted CONFL2. We …rst use CONFL1; then we use CONFL2 and …nally we add up the two variables. F-stat statistics of …rst stage regressions show that the correlation between this instrument set and the diaspora is relatively high. The results of the Hansen over-identi…cation test suggest furthermore that the second condition of no correlation between the instrument set and the error term is supported by the data.
5
Estimation Results
5.1
Impact on ‡ows
Table 2 presents the estimation results regarding the determinants of migration ‡ows and especially the role of diasporas. Columns (1) through (4) report the results on aggregate ‡ows while columns (5) through (8) give the results for low-skilled and high-skilled migration ‡ows. The OLS estimates of equations (10) and (11) are presented in columns (1) and (2) where a signi…cant number of observations with zero migration ‡ows (and the size of the diaspora in 1990) are dropped. Columns (3) through (8) report the results from the two-step Heckman approach where the regressions without additional instruments are used as the benchmark.
In appendix A, we check the robustness of the results presented in Table 2. Table A1 presents the coe¢ cients obtained with using diplomatic representation as an ad-ditional instrument in the Heckman regressions. Table A2 presents the results of the Poisson regressions. As expected, we …nd that diplomatic representation signi…cantly increases the probability of having a diaspora at destination, re‡ected by the positive and signi…cant coe¢ cient in the selection equation. In all Heckman regressions, the Mills ratio is statistically signi…cant, which suggests that dealing with the large
num-ber of zero observations is important. However a comparison of the results in Table 2 with those in Tables A1 and A2 reveals that the estimated coe¢ cient of the lagged diaspora variable is strikingly robust across estimation methods. Therefore, we focus on Table 2 in discussing the implications of our results.
Migration costs, as captured by bilateral distance and linguistic proximity vari-ables, are found to exert signi…cant e¤ects on the migration ‡ows whereas Schengen agreement seems to favor migration of highly skilled workers. Besides those pre-dictable results, the e¤ect of diasporas on the migration ‡ows is quite important with a positive and signi…cant coe¢ cient. In the case with both destination and origin dummies, this coe¢ cient lies between 0.62 and 0.77. Note that the speci…cation used in (10-11) is similar to that of a -convergence model. A positive coe¢ cient for the lagged diaspora implies that there is no sign of convergence in the size of bilateral stocks of migrants, even when controlling for country …xed e¤ects (capturing popula-tions, individual domestic policies and economic conditions that in‡uence incentives to migrate). This is probably due to the fact that migration to the North, especially from the South, sharply increased during the nineties. Since our period of interest is 1990-2000, our results clearly illustrate that country pairs with large initial diasporas exhibit higher growth rates compared to pairs with smaller diasporas.
As expected, OLS leads to an underestimated coe¢ cient due to the exclusion of zero observations and the related selection bias. Methods that account for those zero values lead to slightly higher estimates. The estimated coe¢ cient is almost the same in the Heckman two-step and Poisson regressions, emphasizing the robustness of the results. It is also quite similar whether we include an instrument in the selection equation of the two-step Heckman approach (Table A1)14.
14With diplomatic representation used as an instrument in the selection equation, we get a
coef-…cient of 0.660 for the impact of diaspora instead of 0.699 in the benchmark regressions. Note that the di¤erence is not exclusively due to the estimation method since the use of diplomatic represen-tation causes a loss of additional observations (190 origin countries instead of 195 in the benchmark regressions).
T a b le 2 . D e te r m in a n ts o f m ig r a ti o n ‡ o w s b y sk il l le v e l : O L S a n d H e c k m a n r e g r e ss io n s (1 / 2 ). (1) (2) (3) (4) (5) (6) (7) (8) T ot al T otal T otal T ot al Lo w-s k ill Lo w-ski ll Hi gh -skil l High-s k ill Lagg ed d ia sp 0.62 0 0.616 0. 699 0.83 1 0.7 78 1.192 0.62 5 0.728 (34. 35)*** (26.60 )*** (4 3.91)* ** (23. 44)*** (22. 25)*** (6.90 )*** (44. 57)*** (28.29 )*** Col li n k s 0.33 1 0.278 0. 127 -0. 051 0.1 53 -1.69 9 0.16 9 -0.0 23 (2. 45)** (2.14) ** (1.10) (0. 29) (0. 64) (2.05) ** (1. 72)* (0.16 ) language 0.38 8 1.026 0. 496 1.05 6 0.3 22 1.413 0.68 3 1.373 (5. 20)*** (10.02 )*** (6 .48)** * (8. 34)*** (2. 18)** (3.23) *** (10. 29)*** (13.22 )*** Log( d ist) -0.408 -0 .139 -0.4 48 -0.095 -0.613 0.05 7 -0.341 0.0 04 (9. 04)*** (2.48 )** (1 0.69)* ** (1. 63) (7. 40)*** (0.31 ) (9. 58)*** (0.0 8) Sc he ngen 0.16 8 0.065 0. 277 0.59 9 -0.081 1.15 4 0.59 8 0.493 (1. 19) (0.33 ) (2 .02)** (2.5 6)** (0. 28) (1.31) (5. 23)*** (2.71 )*** Immig. p ol 0.0 35 0. 035 0.0 15 -0.338 (7. 85)*** (6.71)** * (0. 87) (3. 33)*** So cial exp -0.290 0.175 2.4 11 0.2 36 (2. 25)** (1.28) (3. 22)*** (6. 98)*** P o p at de st 0.3 21 0. 109 -0.131 0.0 33 (9. 66)*** (2.30)* * (0. 83) (7. 51)*** W ages at de st 0.0 28 0. 040 -0.020 0.0 69 (3. 70)*** (4.51)** * (0. 75) (9. 32)*** Cons tan t 3.75 0 -4.9 54 2. 365 -6. 119 1.3 88 -17.0 84 0.19 6 -6.7 01 (6. 92)*** (3.96 )*** (4 .02)** * (5. 07)*** (1. 20) (2.99)* ** (0. 36) (6.32) ***
T a b le 2 . D e te r m in a n ts o f m ig r a ti o n ‡ o w s b y sk il l le v e l : O L S a n d H e c k m a n r e g r e ss io n s (2 / 2 ) (1) (2) (3) (4) (5) (6) (7) (8) T ot al T ot al T otal T ota l Lo w-s k ill L o w -ski ll Hig h -skil l High-s k ill Obse rv ations 3608 3091 57 60 4992 5760 4992 5760 4992 Dest d um Y es Y es Y es Y es Y es Y es Y es Y es Or ig du m y es No y es No y es No y es y es Me tho d OL S O LS Hec k m a n H ec kman Hec k m a n He ckman Hec k m a n Hec kman Mills rat io -1 .19 1.92 2.0 9 1.01 1.4 3 1.11 (9. 35)*** (7.65) *** (6. 70)*** (10.6) *** (8. 90)*** (8.7 5)*** R-s q u a red 0.89 0.7 6 Abs o lu te v alues of rob ust t sta tistics in p a ren the ses * signi… can t a t 10%; ** si gn i… can t at 5%; ** * signi… can t at 1%
Extracting the explained partial sum of squares using the results in column (1), we …nd that diaspora e¤ects explain more than 71% of the observed variability in migration ‡ows and over 80% of the explained variability of the model. This is a rather high level given that the …t of the regression is quite high, with R2 amounting
to 89%. Columns (5) and (6) report the results for the low-skill migrants while columns (7) and (8) report the results for the high-skill ones. The diaspora e¤ect is higher for low-skill migrants as predicted in our model. This is due to the fact a large diaspora lowers the advantage higher levels of human capital generate in lowering migration and visa costs. The di¤erential impact of diasporas on low-skill migration is again highly robust to alternative speci…cations (i.e. with and without destination country dummies) and to alternative estimation methods. A Wald test on the di¤erence of coe¢ cients of 1 between low and high-skilled migrants (columns
5 and 7) shows that this di¤erence is statistically signi…cant at the 5% level. Note that the e¤ects of distance and linguistic proximity are also higher for low-skilled than for the high-skilled migrants. The latter result re‡ects the fact that linguistic proximity increases the degree of transferability of skills and the ease of entry into the labor market for the low-skilled migrants.
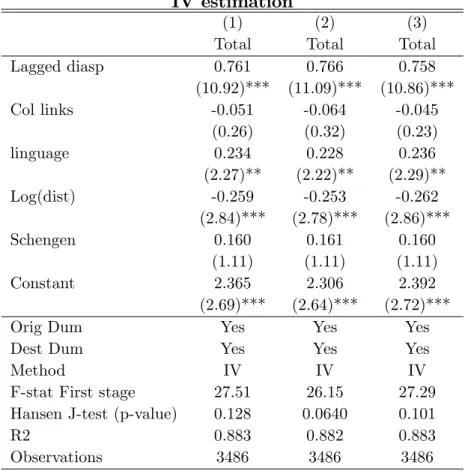
Table 3 presents the instrumental variable estimates of equation (11) with three di¤erent sets of instruments. All sets pass the F-stat test for the strength of instru-ments and the Hansen J-test of no correlation with the error term at the 5% level. The results of the IV estimation lead to very similar coe¢ cients for the impact of the diaspora on the migration ‡ows. The decrease in signi…cance is mainly caused by the increase in uncertainty due to the instrumentation procedure. Nevertheless, the quantitative and statistical signi…cance of the diaspora remains. Therefore, we conclude that the strong e¤ect of diasporas documented in OLS regressions is robust to the various econometric problems including selection bias and correlation of the diaspora with unobserved factors of the ‡ows.
Table 3. Determinants of migration ‡ows : IV estimation
(1) (2) (3)
Total Total Total
Lagged diasp 0.761 0.766 0.758 (10.92)*** (11.09)*** (10.86)*** Col links -0.051 -0.064 -0.045 (0.26) (0.32) (0.23) linguage 0.234 0.228 0.236 (2.27)** (2.22)** (2.29)** Log(dist) -0.259 -0.253 -0.262 (2.84)*** (2.78)*** (2.86)*** Schengen 0.160 0.161 0.160 (1.11) (1.11) (1.11) Constant 2.365 2.306 2.392 (2.69)*** (2.64)*** (2.72)***
Orig Dum Yes Yes Yes
Dest Dum Yes Yes Yes
Method IV IV IV
F-stat First stage 27.51 26.15 27.29
Hansen J-test (p-value) 0.128 0.0640 0.101
R2 0.883 0.882 0.883
Observations 3486 3486 3486
Absolute values of robust t statistics in parentheses * signi…cant at 10%; ** signi…cant at 5%; *** signi…cant at 1%
Instrument sets forMij in all columns include a dummy for bilateral guest worker
agreement and a proxy for diaspora size in 1960. In column (1) , the proxy is computed as
ln(popi immstj=distij) Conf1i;In column (2) , the proxy is computed as
ln(popi immstj=distij) Conf2i;in column (3), the proxy is computed as
ln(popi immstj=distij) (conf1i+Conf2i):
5.2
Impact on selection
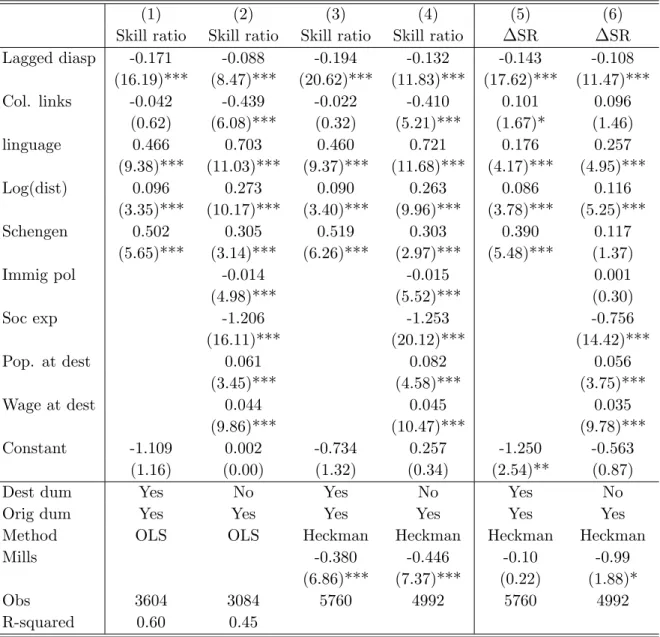
The next question is on the determinants of the selection and the human capital (educational) composition of migrants and the speci…c role of diasporas in this process. Columns (1) to (4) in Table 4 report the results of the estimation of equations (12) and (13) for the skill ratio whereas columns (5) and (6) are estimated for the change in the skill ratio. Columns (1) and (2) are obtained using OLS whereas results in columns (3) to (6) are obtained with the Heckman two-step procedure without instruments.
Table 4. Impact of diaspora on selection (ratio high-skill/low-skill) level and change: OLS and Heckman
(1) (2) (3) (4) (5) (6)
Skill ratio Skill ratio Skill ratio Skill ratio SR SR
Lagged diasp -0.171 -0.088 -0.194 -0.132 -0.143 -0.108 (16.19)*** (8.47)*** (20.62)*** (11.83)*** (17.62)*** (11.47)*** Col. links -0.042 -0.439 -0.022 -0.410 0.101 0.096 (0.62) (6.08)*** (0.32) (5.21)*** (1.67)* (1.46) linguage 0.466 0.703 0.460 0.721 0.176 0.257 (9.38)*** (11.03)*** (9.37)*** (11.68)*** (4.17)*** (4.95)*** Log(dist) 0.096 0.273 0.090 0.263 0.086 0.116 (3.35)*** (10.17)*** (3.40)*** (9.96)*** (3.78)*** (5.25)*** Schengen 0.502 0.305 0.519 0.303 0.390 0.117 (5.65)*** (3.14)*** (6.26)*** (2.97)*** (5.48)*** (1.37) Immig pol -0.014 -0.015 0.001 (4.98)*** (5.52)*** (0.30) Soc exp -1.206 -1.253 -0.756 (16.11)*** (20.12)*** (14.42)*** Pop. at dest 0.061 0.082 0.056 (3.45)*** (4.58)*** (3.75)*** Wage at dest 0.044 0.045 0.035 (9.86)*** (10.47)*** (9.78)*** Constant -1.109 0.002 -0.734 0.257 -1.250 -0.563 (1.16) (0.00) (1.32) (0.34) (2.54)** (0.87)
Dest dum Yes No Yes No Yes No
Orig dum Yes Yes Yes Yes Yes Yes
Method OLS OLS Heckman Heckman Heckman Heckman
Mills -0.380 -0.446 -0.10 -0.99
(6.86)*** (7.37)*** (0.22) (1.88)*
Obs 3604 3084 5760 4992 5760 4992
R-squared 0.60 0.45
Robust t statistics in parentheses
* signi…cant at 10%; ** signi…cant at 5%; *** signi…cant at 1%
Results in Table 4 show that the selection of migrants is also in‡uenced by a large set of variables. Bilateral varaibles such as linguistic proximity, distance, the Schengen agreement and wage di¤erentials favor the selection of high-skilled migrants. On the contrary, non-selective immigration policies and generous social expenditures lower the educational mix of the migrants which is in line with the results in Cohen and Razin (2008). More importantly, large diasporas exert a strong negative impact on the skill ratio of migration ‡ows and attract low-skill migrants. Once again, this e¤ect is robust to alternative speci…cations (presence or absence of destination dummies),
estimation methods (OLS and Heckman). More importantly, this strong result is maintained when we use the change in the skill ratio between 1990 and 2000 as the dependent variable instead of thelevel of the skill ratio.
From the results in column (1), we …nd that diaspora e¤ects explain respectively 47% and 78% of the total and explained variability of the selection ratio in 2000. These numbers suggest that, compared to economic or other selection variables, di-aspora e¤ects are rather important. As stated earlier, the didi-aspora e¤ect is com-plemetary to the generosity of family reunion programs. The size of the diaspora e¤ect will be smaller in the absence of .reuni…cation programs in the destination country and will be limited to lowering of migration costs through the network ef-fects. These results imply that education-based selective migration policies are likely to have only moderate impact in countries hosting large diasporas unless the extent of family reuni…cation programs are curtailed.
Table 5 reports the results of the IV estimation for the skill ratio of migration ‡ows. Columns (1) through (3) look at the impact on the level of the ratio while Columns (4) through (6) investigate the impact on its change. Similar to the analysis of migration ‡ows, we consider three di¤erent sets of instruments and the IV results con…rm the negative impact of diasporas on the educational composition of migrant ‡ows from the previous table.
5.3
Concentration
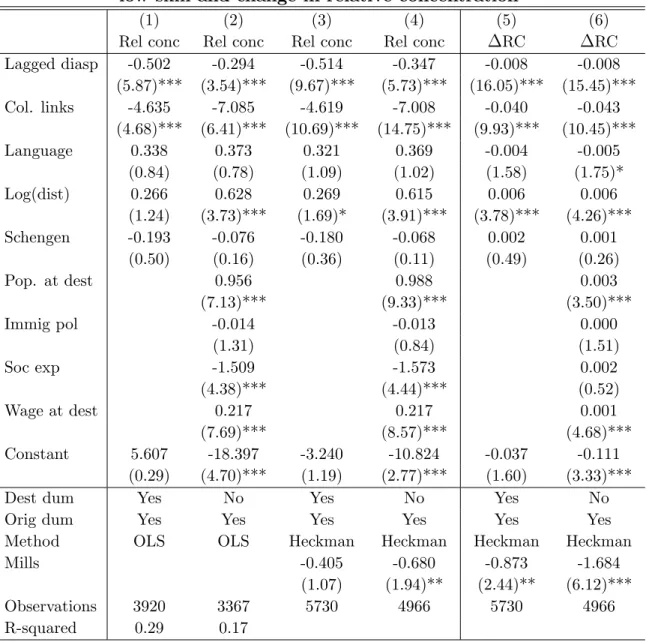
Our last question is on the determinants of the relative concentration of migrants of di¤erent skill levels and the role diasporas play. The structure of Table 6 is similar to the that of Table 4. Colonial links tend to favor a higher concentration of low-skill migrants compared to high-skill ones, while distance exerts the opposite e¤ect. Once again, diaspora e¤ects are found to be important for explaining the concentration levels and the e¤ect is robust to alternative speci…cations, alternative estimation methods. And the results also hold for the change in the relative concentration index between 1990 and 2000.
T a b le 5 . Im p a c t o f d ia sp o r a o n se le c ti o n (l o g h ig h -s k il l/ lo w -s k il l r a ti o ): IV e st im a ti o n (1) (2) (3) (4) (5) (6) Log-skil l rati o Log-skil l rati o Log-skil l rati o LSR LSR LSR Lagg ed diasp -0.218 -0.207 -0.215 -0.215 -0. 203 -0.212 (3. 01)*** (2. 78)*** (2. 95)*** (3. 50)*** (3.22) *** (3. 44)*** Col li n k s 0.0 92 0.0 68 0.0 85 0.2 77 0.249 0.2 70 (0. 52) (0. 37) (0. 48) (1. 82)* (1.61) (1. 77)* li n guage 0.4 69 0.4 59 0.4 66 0.2 38 0.226 0.2 35 (5. 41)*** (5. 20)*** (5. 37)*** (3. 24)*** (3.04) *** (3. 19)*** Log( d ist) 0.0 57 0.0 67 0.0 60 0.0 16 0.028 0.0 19 (0. 75) (0. 87) (0. 79) (0. 25) (0.43) (0. 30) Sc he ngen 0.5 36 0.5 36 0.5 36 0.4 14 0.415 0.4 14 (6. 38)*** (6. 38)*** (6. 38)*** (6. 08)*** (6.09) *** (6. 08)*** Cons tan t -0.468 -0.573 -0.501 -0.450 -0. 567 -0.481 (0. 42) (0. 50) (0. 44) (0. 59) (0.73) (0. 63) Or ig Dum Y es Y es Y es Y es Y es Y es Dest Du m Y es Y es Y es Y es Y es Y es Me tho d IV IV IV IV IV IV F-stat Fi rst st age 30. 16 29. 49 30. 07 30. 16 29.49 30. 07 Hanse n J-te st (p-v a lu e) 0.9 74 0.2 44 0.8 12 0.5 74 0.562 0.7 47 R2 0.5 99 0.6 00 0.5 99 0.5 06 0.509 0.5 06 Obse rv ations 3486 3486 3486 3486 3486 3486 Abs o lu te v alues of rob ust t sta tistics in p a ren the ses * signi… can t a t 10%; ** si gn i… can t at 5%; ** * signi… can t at 1% In st ru m en t se ts fo r M ij in a ll co lu m n s in cl u d e a d u m m y fo r b il a te ra l g u es t-w o rk er a g re em en ts a n d a p ro x y fo r d ia sp o ra si ze in 1 9 6 0 . In co lu m n (1 ) , th e p ro x y is co m p u te d a s ln ( pop i im mst j =d is tij ) C on f 1i : In co lu m n (2 ) , th e p ro x y is co m p u te d a s ln ( pop i im mst j =d is tij ) C on f 2i ; in co lu m n (3 ), th e p ro x y is co m p u te d a s ln ( pop i im mst j =d is tij ) ( con f 1i + C on f 2i ) :
Table 6. Explaining relative concentration between high-skill and low-skill and change in relative concentration
(1) (2) (3) (4) (5) (6)
Rel conc Rel conc Rel conc Rel conc RC RC
Lagged diasp -0.502 -0.294 -0.514 -0.347 -0.008 -0.008 (5.87)*** (3.54)*** (9.67)*** (5.73)*** (16.05)*** (15.45)*** Col. links -4.635 -7.085 -4.619 -7.008 -0.040 -0.043 (4.68)*** (6.41)*** (10.69)*** (14.75)*** (9.93)*** (10.45)*** Language 0.338 0.373 0.321 0.369 -0.004 -0.005 (0.84) (0.78) (1.09) (1.02) (1.58) (1.75)* Log(dist) 0.266 0.628 0.269 0.615 0.006 0.006 (1.24) (3.73)*** (1.69)* (3.91)*** (3.78)*** (4.26)*** Schengen -0.193 -0.076 -0.180 -0.068 0.002 0.001 (0.50) (0.16) (0.36) (0.11) (0.49) (0.26) Pop. at dest 0.956 0.988 0.003 (7.13)*** (9.33)*** (3.50)*** Immig pol -0.014 -0.013 0.000 (1.31) (0.84) (1.51) Soc exp -1.509 -1.573 0.002 (4.38)*** (4.44)*** (0.52) Wage at dest 0.217 0.217 0.001 (7.69)*** (8.57)*** (4.68)*** Constant 5.607 -18.397 -3.240 -10.824 -0.037 -0.111 (0.29) (4.70)*** (1.19) (2.77)*** (1.60) (3.33)***
Dest dum Yes No Yes No Yes No
Orig dum Yes Yes Yes Yes Yes Yes
Method OLS OLS Heckman Heckman Heckman Heckman
Mills -0.405 -0.680 -0.873 -1.684
(1.07) (1.94)** (2.44)** (6.12)***
Observations 3920 3367 5730 4966 5730 4966
R-squared 0.29 0.17
Robust t statistics in parentheses