Towards Robust Service Compositions in the Context of
Functionally Diverse Services
Florian Wagner
∗The University of Tokyo
[email protected]
Benjamin Klöpper
† National Institute of Informatics[email protected]
Fuyuki Ishikawa
National Institute of Informatics[email protected]
Shinichi Honiden
The University of Tokyo National Institute of
Informatics
[email protected]
ABSTRACT
Web service composition provides a means of customized and flexible integration of service functionalities. Quality-of-Service (QoS) optimization algorithms select services in order to adapt workflows to the non-functional requirements of the user. With increasing number of services in a work-flow, previous approaches fail to achieve a sufficient relia-bility. Moreover, expensive ad-hoc replanning is required to deal with service failures. The major problem with such se-quential application of planning and replanning is that it ig-nores the potential costs during the initial planning and they consequently are hidden from the decision maker. Our ba-sic idea to overcome this substantial problem is to compute a QoS optimized selection of service clusters that includes a sufficient number of backup services for each service em-ployed. To support the human decision maker in the service selection task, our approach considers the possible repair costs directly in the initial composition. On the basis of a multi-objective approach and using a suitable service selec-tion interface, the decision maker can select composiselec-tions in line with his/her personal risk preferences.
Categories and Subject Descriptors
H.3.4 [Systems and Software]: [Distributed systems]; H.3.5 [On-line Information Services]: [Web-based services]
General Terms
Reliability, Measurement
Keywords
Service computing, QoS-aware service composition, Multi-objective optimization, Robustness
∗The work of Florian Wagner is partially supported by the
KDDI Corporation.
†Benjamin Kl¨opper is a visiting researcher and scholarship
holder of the (DAAD)
Copyright is held by the International World Wide Web Conference Com-mittee (IW3C2). Distribution of these papers is limited to classroom use, and personal use by others.
WWW 2012, April 16–20, 2012, Lyon, France. ACM 978-1-4503-1229-5/12/04.
1.
INTRODUCTION
1.1
Background
In Service-Oriented Architectures (SOA), service providers offer services that in many cases perform the same task but with varying Quality-of-Service (QoS) levels. QoS-aware service selection algorithms can be used to optimize the QoS of a given workflow during runtime. These algorithms select for each task one service, by taking, e.g., the price and re-liability of the resulting workflow into consideration. More-over, the user may also specify constraints on the QoS of the workflow. Since the search space is exponential, heuristic algorithms are employed to compute solutions in a feasible amount of time.
1.2
Goals
Our main goal is to support the human decision maker in selecting a service composition that best fits his/her needs in an open service environment. We intend to compute QoS optimized compositions that can sustain a certain number of service failures. For that purpose, we need an extended QoS model that takes services failures into account. In the following, we outline the resulting subgoals in more detail.
1.2.1
Sufficient reliability (Goal
G1)
Services failures may occur for various reasons, e.g., hard-ware failures or obsolete registry information. As the num-ber of services in a workflow grows, the reliability of the workflow decreases significantly. Let us consider, for in-stance, a fixed reliability of 95% for each service. A small workflow containing ten of these services has a reliability of less than 60%; a workflow containing 25 such services has a reliability of less than 30%.
The utility of a workflow has often been computed by ag-gregating the reliability with other QoS attributes, such as the price, by using a simple additive weighting scheme. Con-sequently, the algorithms might sacrifice reliability in order to optimize other QoS attributes. Moreover, even if relia-bility is the primary objective, the current approaches are not sufficient to maintain it at a feasible level. In particular, selection approaches that use skyline queries to prune the search space [2] exclude potential backup services before the selection phase.
For that reason, ad-hoc replanning algorithms have to be used to replace failed services with backup services. How-ever, sometimes a service cannot be replaced, e.g., if the constraints are very tight and only this services can be em-ployed at a certain stage of the workflow.
1.2.2
Improved QoS model (
G2)
Moreover, the current selection algorithms ignore the po-tential additional costs and longer response times of em-ploying backup services selected by ad-hoc replanning algo-rithms. For that purpose, the QoS model needs to cover the probabilistic nature of the QoS of the workflows in order to facilitate computations to predict the expected outcome as well as the outcome in the best and worst cases.
1.2.3
Support of functionally diverse services (
G3)
It is unlikely that services sharing the same purpose will have identical interfaces. Similar services developed and offered by different service providers would naturally have slightly different functional interfaces; one may have more input parameters, while another may have output param-eters with a different type. Moreover, we expect that the number of publicly accessible web services will increase dra-matically from current approx. 28,0001 due to the emer-gence of Cloud Computing. By including functionally di-verse services, selection algorithms would have more services to choose from and more potential backup services would be able to be employed.
For the above reasons, we claim that selection algorithms must take the functionality of the services into consideration. Consequently, certain links between services might be invalid in a workflow composition, and selections would be unusable if they included such a link. Moreover, local optima are more likely in this scenario, leading to poorer results from heuristic algorithms that explore the search space in a more or less random manner.
1.2.4
Assisting the user in selecting a solution (
G4)
Since multiple valid solutions might be computed, the user should be able to choose among them intuitively. By com-paring solutions with each other, their impact on the other attributes should be visualized when one QoS attribute is increased.
1.3
Contributions
To reach these goals, we devised a multi-objective opti-mization algorithm that leverages background knowledge to discover robust QoS-optimized service selections in an open service environment. The algorithm takes the costs of po-tential service failures into account and ranks solutions on the basis of the risk preferences of the decision maker.
Specifically, we present the following contributions in this paper:
1. We discuss the consequences of including functionally diverse services in the selection process. In address-ing GoalG3, we evaluate and compare state-of-the-art multi-objective optimization algorithms.
2. We present our own selection algorithm that is based on a genetic algorithm. It leverages background knowl-edge on the functionalities of the services to find robust valid service selections efficiently (GoalG1 andG3). 1according to www.seekda.com (accessed November 2011)
3. Our QoS model takes the reliability of services into account and enables to compute the expected outcome of adding backup services to a composition. For each service we introduce the expected QoS values and the QoS in the best and worst case. This way, the user may choose a service selection based on his/her risk preferences (GoalG2).
4. Finally, we present a graphical tool that helps the user to find a service selection that best fits his/her needs. The user inputs QoS and risk preferences, and the tool ranks the sorted solutions and provides a means to compare them (GoalG4).
In our previous work [21], we evaluated the benefits of employing background knowledge on service functionality for QoS-aware service selection with single objectives. We compared our algorithm with a genetic algorithm in a dif-ferent problem setting from the one of the current study. In this paper, we describe an advanced repair operation, pro-vide a detailed description of the algorithm and introduce a new QoS model to consider possible repair costs. Moreover, we compare our algorithm with various multi-objective op-timization algorithms. In [20, 22], we evaluated functional clustering in the context of service planning. The clustering algorithm could only be applied to scenarios where the back-ground type hierarchy is known. Moreover, in the following we present ways to merge clusters.
The rest of the paper is structured as follows: in the next section we present the preliminaries of service composition and multi-objective optimization. Section 2 covers related work. We present our approach in Section 4 and evaluate it in Section 5. Section 6 concludes this paper.
2.
PRELIMINARIES
First, we describe QoS-aware service composition in the context of functionally diverse services. Next, we discuss multi-objective optimization and describe some of the re-lated approaches.
2.1
QoS-aware Service Composition
2.1.1
Services
Aservice Sprovides a reusable functionality that is spec-ified in a service description document. These descriptions define the required input and provided output parameters of the service, abbreviated asS.I andS.O. Usually, the inter-face descriptions are written in WSDL. Semantic annotation languages such as SA-WSDL can be used to further spec-ify the parameter types of the service in order to facilitate logical reasoning on the parameters.
Apart from that, service-level agreements (SLA) docu-ments that are published by the service provider describe the QoS attributes of a service. They include, for instance, the price, response time, and claimed reliability of the ser-vice, written asSprice, Stime andSrel. For a detailed clas-sification of QoS measures, please refer to [17].
2.1.2
Service Compliance
In order to connect a serviceSto a serviceS′,Shas to pro-vide an output parameterS.Othat can be further processed byS′
. If semantic annotations are provided, a logical rea-soner exploits a background type hierarchy to check whether an outputo∈S.Ois compatible with an inputi∈S′
that case, the type ofois the same type or a subtype ofi. If only the WSDL documents are given, the check is done on the data-structural level by comparing names and basic types. On the basis on the above considerations, we define a relationcombinableas follows
Definition 1 (Functional compliance). Two services
S andS′
arecombinable, written asS→S′ iff. ∃o∈S.O .∃i∈S′.I . o∼i
where the relation∼denotes type compatibility.
To execute a service, all inputs have to be provided by other services or the user.
2.1.3
Workflows
A workflow provides a control flow for two or more ser-vices. Aworkflow templatecontainsservice tasks instead of actual services. A task describes an abstract functionality that can be performed by an actual service. To associate services to a task, either the functional interface of the ser-vices is compared with the functional requirements of the task or the services are collected based on e.g. informal descriptions. The authors of [3] propose that providers reg-ister their services at service communities. In this way, they indicate which functionality is to be carried out by their services.
In the end, a set of functionally related services, each hav-ing its own QoS attributes, is associated with the task. Se-lection algorithms select for each task of a workflow one ac-tual service such that the QoS of the workflow are optimized. The set of selected services is calledservice selection.
Figure 1 shows an example workflow template and a pos-sible service selection.
S11S12 S13 S41S42 S43 S21S22 S51S52 S31 TaskT1 TaskT2 TaskT4 TaskT3 TaskT5
Figure 1: Workflow template with service tasks (white cir-cles) and a corresponding selection (dark grey circir-cles)
Services can be executed in parallel by using either an AND fork or a XOR fork.
2.1.4
QoS Optimization
The QoS vector Q of the workflow is computed on the basis of the types of QoS attributes and the control flow of the workflow. A detailed description of this aggregation can be found in [4, Table 1]. Many related approaches simplify the QoS optimization problem by treating it as a single-objective optimization problem (SOO). For that purpose, the components of the obtained QoS vectorQare aggregated into a single valueσby applying e.g. a weighted sum. SOO algorithms optimizeσand try to meet the QoS constraints.
2.2
Multi-objective Optimization
In contrast to SOO algorithms, multi-objective optimiza-tion (MOO) algorithms treat every component of Qas an objective. Consequently, only a partial-ordering on the so-lutions exists and it is defined by the dominates relation.
Definition 2 (Dominate relation). A solutionW
dominates solutionW′, written asW ≻W′, iffW: 1. violates fewer constraints thanW′, or 2. violates as many constraints asW′ and
∀n i=1W.Qi≥W ′ .Qi ∧ ∃k . W.Qk> W ′ .Qk
In the QoS-aware service selection scenario, a selection W
dominates another selectionW′ in two cases: eitherW vio-lates fewer QoS constraints thanW′ or it violates as many constraints and yields better or equal results in all QoS di-mensions and yields one better result than W′ in one di-mension. The outcome of a MOO algorithm is a set of non-dominated solutions, also called pareto-optimal solutions:
Definition 3 (Pareto optimality). Given a solution setW. The solution setWP ⊆ W is called pareto-optimal with respect toWiff:
∀WP ∈ WP .¬∃W ∈ W. W ≻WP
The algorithm cannot judge whether one solution from the pareto-set is better than another one. Instead, the user ul-timately selects a solution that best fits his/her preferences. If any constraint is violated, the solution is invalid.
Several possible indicators exist to compare MOO algo-rithms; we shall use the hypervolume HV [27]. The HV of a solution set W means the hypervolume in the objective space that is dominated byW (cf. Fig. 2).
W1
W2
W3
W4
Figure 2: The hypervolume (grey area) of the pareto front
{W1,W2, andW3}, dominating solutionW4
In order to compare multiple algorithms, we merge the non-dominated fronts of all algorithms into a maximum front
Wmax. The solutions of this front are not dominated by any
solution computed by the algorithms. The HV ratio ofWis then computed by:
HV(W)
HV(Wmax)
If optimization algorithms are used to solve the service se-lection problem, each task becomes a decision variable, hav-ing the index of the currently selected service as a value. A na¨ıve approach to compute a solution is to reduce the MOO problem to an SOO problem. The SOO algorithm solves the modified problem multiple times, using various weights, with the goal of computing a huge variety of solutions. In the following, we will discuss in brief several algorithms that are customized to the MOO problem. For details, please refer to the original studies. The presented algorithms yield the best results in our problem setting, as shown in Section 5.
2.2.1
NSGA-II
The non-dominated sorting genetic algorithm II (NSGA-II) [5] employs a fast sorting algorithm to assign genomes to the right front. Genomes of the first front are not domi-nated by any other genome, genomes from the second front are only dominated by genomes from the first front, etc. Af-ter identifying all fronts, the algorithm tries to preserve the diversity among genomes by using a crowded comparison approach.
2.2.2
IBEA
Zitzler and K¨unzli describe the indicator-based evolution-ary algorithm (IBEA) in [26]. It uses a binevolution-ary quality indi-cator to compare two potential solutions sets, providing an extension to the original dominates relation. The fitness of an individual is computed by using the indicator to compare it with the rest of the population.
2.2.3
GDE3
The Generalized Differential Evolutionary [10] algorithm (GDE3) provides an MOO extension for the DE algorithm. It uses an initial random seed and applies select, mutate, and crossover operations. The magnitude of the mutate op-eration decreases as the evolution proceeds. It also uses the notion of crowdedness in a slightly modified version than is used it the NSGA-II algorithm.
2.2.4
OMOPSO
The particle swarm optimizer OMOPSO [18] defines an extended notion ofleader. In SOO, a leader dominates the other particles of a PSO, influencing their motion through the objective space. Since multiple leaders may exist in MOO, the authors also employ the crowding factor in or-der to decide which leaor-ders are kept in case too many exist.
3.
RELATED WORK
QoS-aware Service Selection.
Since the problem of finding the optimal service selec-tion [25] is NP-hard, heuristic algorithms [4] have been in-vestigated as a means of computing near-optimal solutions. To improve the performance of service selection, some ap-proaches attempt to prune the search space. In [1], global QoS-constraints are split up into local constraints for each single service task. Subsequently, the configuration with the locally best services is selected. In [2], services that are not part of the skyline, which may also include backup services, are removed. Moreover, their definition of dominance [2, Definition 3] is not sufficient in our setting, since services that are not part of the skyline might be part of the optimal solution, e.g. especially in cases where only few functionally valid solutions exist.
Multi-objective Optimization in Service Selection.
Genetic algorithms have been successfully used for multi-objective optimization; see, e.g. [19, 23]. These approaches consider several QoS attributes based on a classical QoS model as an objective function of the optimization problem. Thus, it is not possible to use the risk profile of the various feasible compositions.
The authors of [24] employ a multi-objective stochastic program to take probabilistic QoS values into account.
Al-though they consider the worst-case scenarios of QoS, they do not consider service failures.
Reliability and Replanning.
The previous approaches all rely on ad-hoc replanning when a service failure occurs, as described in for instance [12]. The authors use semantic service discovery on the service registry to compensate service failures, requiring semantic annotation to find suitable services.
In [14], a replanning scope is determined and extended to compensate service failures efficiently. If no suitable service exists or if the QoS attributes of the backup services are not sufficient, the execution of the workflow fails. In contrast to such ad-hoc algorithms, our approach considers service failures beforehand, taking the individual reliability of each service into consideration. This way, robust workflows are created in the initial planning phase.
Jaeger et al. [8] aggregate redundant services and execute them in parallel in order to optimize the response time and reliability. For that purpose, they propose three replacement patterns. In our study, however, we tried to avoid unneces-sary service invocations in order to minimize the costs.
QoS Models.
The most common QoS model for service selection is pre-sented in [4, 17]. Several QoS attributes are characterized and methods to aggregate the QoS are provided.
In [9], a probabilistic QoS model is provided to compute the expected case of the QoS values. The authors apply this model for predicting the average QoS of the workflow when it is executed a number of times. The computed QoS of both models are only valid if there are no service crashes.
A failure-aware model is presented in [11]. This model takes into account additional failure recovery times. The authors infer the QoS by collecting past execution logs. In our study, we incorporate the reliability of a service in the computation of the expected QoS a priori.
Functionally Diverse Services.
Regarding functionally diverse services, the matching qual-ity of the service links is incorporated into the utilqual-ity func-tion in [13]. The authors balance the compliance with the QoS values, not evaluating whether the computed solution is executable. In our approach we consider the functional compliance as a hard constraint, requiring selections to fully satisfy the requested inputs of all used services.
In [7] the authors investigate the gap between the concep-tual and data-structural level of service composition. They claim that even if the conceptual types of the parameters of two services are compatible, the WSDL implementation may still be incompatible. They focus on automatic composition and do not take QoS-attributes into account.
Clustering in Service Composition.
The use of clustering prior to the selection phase is de-scribed e.g. in [15]. The authors use a k-nearest neighbor algorithm to arrange the services in QoS clusters, without taking functional compliance into account. The authors of the EASY project [16] arrange services in a functionality graph in order to facilitate an efficient service discovery. They define service compliance in a different way from ours and do not consider QoS attributes.
4.
APPROACH
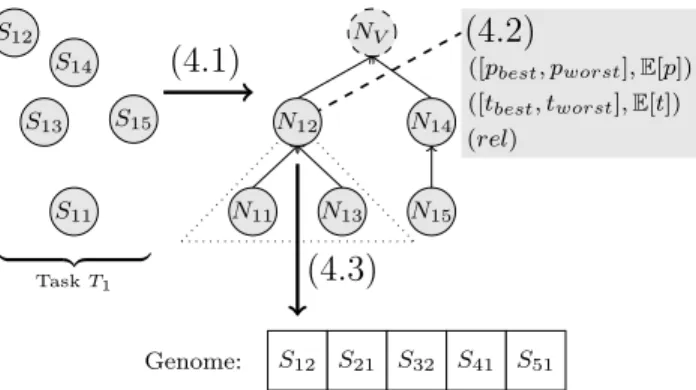
Our approach is illustrated in Fig. 3. First, we describe the method for clustering web services (step 4.1 in the fig-ure). This method detects backup services for each service by arranging the services in a functionality graph. Next, we introduce our modified QoS model that takes backup ser-vices into account (step 4.2). Finally, we describe our MOO algorithm SHUURI (step 4.3) that employs this graph and the model, and show a graphical interface that helps users to select a service selection that best fits their needs.
S11 S12 S13 S14 S15 N11 N13 N12 NV N14 N15 S12 S21 S32 S41 S51 Genome:
(4.1)
(4.2)
([pbest, pworst],E[p]) ([tbest, tworst],E[t]) (rel)(4.3)
| {z } TaskT1Figure 3: Overview of our approach. The backup services ofS12are contained in the dotted triangle
4.1
Functional Clustering
4.1.1
Initial Functionality Graph
In the first phase, we detect services that can be easily replaced and yield a good QoS by arranging services into a directed-acyclic graph offline. For that purpose, we detect the services that each service can connect to by examining the connected tasks and the combinable relation. Subse-quently, all services from the same tasks are compared with each other. Figure 4 shows an example clustering of a service task. S13 S12 S11 S23 S22 S21 TaskT1 TaskT2 (a) Service compliance
N12
N11 N13
ClusterC1 (b) Clustering ofT1 Figure 4: Clustering of the services of TaskT1 from Fig. 1 by considering TaskT2. ServiceS12can be replaced in every service composition byS11andS13 since both can connect toS22as well.
Each service is represented by a node in the graph. If two services can be connected to the same services, the nodes of
these services are merged. Otherwise, if a serviceS can be connected to more services than a serviceS′, then these two services are connected with a directed edge. Every node has an input list IL and output list OL to keep track of all services its corresponding service S can be connected to. Moreover, each node has two additional lists SC and
OL. N.SC contains the services of N and all services of its subcluster, i.e. the backup services. N.OLcontains the services that all services from its subcluster can connect to, in other words, the union of theOL sets of the subcluster services.
4.1.2
Cluster Unification
The functional clustering arranges services in a graph to guide the repair process. However, in our algorithm, cluster fragments may occur in workflow tasks and these fragments can hinder repairs. To illustrate this idea, let us add services
S14,S15,S24, andS25to the example shown in Fig. 4. The set of compatible of the services of Task T1 are shown in Table. 1.
ServiceS combinable with S11 {S21, S22, S24}
S12 {S22, S24}
S13 {S22, S23, S24}
S14 {S24, S25}
S15 {S21, S24, S25}
Table 1: Extended scenario of Fig. 1, leading to a scattered cluster
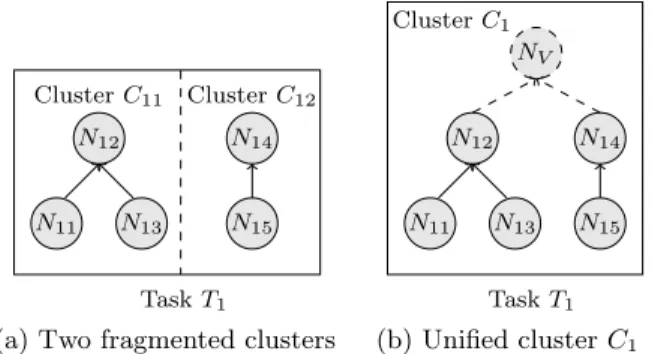
In this scenario, the servicesS14andS15 become an iso-lated cluster even though they belong to the same task as
S11,S12, andS13(cf. Fig. 5a).
In order to merge such cluster fragments, we add virtual services to the repository that subsume the functionalities of the fragments (cf. Fig. 5b). In this way, the repair operation can traverse all services from the same task. In the given example, let us assume that we mergeN12andN14. We add a serviceNV whose IL and OL sets are the intersections of
the corresponding sets in the child nodes.
We iterate this process until we have only one root node left. The root nodes are selected with a greedy approach; i.e., the sizes of the unified IL and OL test sets are max-imized in each node. Therefore, each virtual service can guarantee that it can be used with a larger number of re-lated services. In the end, all services are in the same cluster and reachable from each other.
The clustering is performed offline, so only the repair op-eration is added to the runtime of the algorithm.
4.1.3
Determining backup services
After computing the final clusters, a set of backup services is detected for each cluster and sub-cluster root. If service
S fails during execution of the workflow, any service from the subcluster of S can be employed to replace S. In the following, we show how to determine which service is to be executed by computing an execution order for the backup services.
First, the services of each subcluster are arranged in QoS fronts. Starting with the first front, the distance to the cluster root is computed for each service. The execution order for the backup services is determined by selecting the
N14
N12
N11 N13 N15
TaskT1
ClusterC11 ClusterC12
(a) Two fragmented clusters
N14 N12 N11 N13 N15 NV TaskT1 ClusterC1 (b) Unified clusterC1 Figure 5: Unifying two clustersC11andC12toC1by intro-ducing a virtual service nodeNV
services with the shortest distance to the original cluster root service. In our example, the execution order of N12 could be: S12→S13→S11.
If a service fails, the services from the ordering are used to replace the service. The number of backup services depends on the reliability of services. Our experiences indicated that three backup services are sufficient in most cases.
4.2
Extended QoS Model
As discussed in Section 2.1.3 the QoS attributes of the workflow are computed by aggregating the QoS of the em-ployed services. Since in our approach a list of services is selected instead of single services, we apply a modified QoS model. This model helps us to predict the expected outcome of executing a particular service selection.
For each node, the reliability is computed by taking the reliabilities of the service and the backup services into con-sideration:
Nrel= 1− Y S∈cluster(N)
(1−Srel)
For the price and response time, three values are com-puted: the best-case value, worst-case value, and the value in the expected case. The best-case refers to the one where the first service that was selected at the beginning can be executed successfully. In other words, the value corresponds to the QoS value of the cluster root. In the worst-case all services in the execution order except for the last service fail. In that case, the prices and response times respectively are summed up for all services.
Finally, the expected case takes reliability into account. For instance, the price of a cluster node is computed using the following formula:
E[Nprice] = S1price | {z } Price in case 1 · S1rel |{z} Probability of case 1 + + S1price+S2price | {z } Price in case 2 · (1−S1rel)·S rel 2 | {z } Probability of case 2 + +. . .
The expected value of the response time of a cluster node is computed in the same way. We employed seven objectives in the service selection phase:
• Price: [pbest, pworst],E[p]
• Response time: [tbest, tworst],E[t] • Reliability: rel
Table 2 lists the QoS of the three example services and re-sulting QoS of the cluster nodes.
4.3
The SHUURI Algorithm
We developed a MOO algorithm, called SHUURI, to com-pute approximate pareto-optimal solutions efficiently. This algorithm is based on the NSGA-II algorithm (cf. Sect. 2.2.1), but uses customizations and an additional repair operation that leverages background knowledge to discover valid selec-tions.
4.3.1
Evolution of the genomes
First, an initial random population is generated. Then, mutate, crossover, repair, and select operations are per-formed in each iteration. The mutate operation uses func-tional clustering with a certain probability. Instead of pick-ing a random service for substitutpick-ingS, a service from the subcluster ofSis chosen. In this way, valid links toSare pre-served after performing the mutate operation. Apart from that, SHUURI uses a uniform crossover operator.
4.3.2
Repair operation
After applying the mutate and crossover operations, an additional repair operation is applied to genomes that con-tain an invalid link between two services. This operation is performed with a probability Prep. Experiments on MOO
problems show that a good balance could be had with aPrep
of 33%, as was the case in previous experiments with SOO. Given the functional clustering, the algorithm searches se-lectively in order to repair an invalid link instead of replacing services in a more or less random manner. Algorithm 1 is the pseudo code of the repair operation.
Algorithm 1:Repair operation
1 foreachCellc∈invalidCells(g)do 2 SetS:=c.SC;
3 foreachServiceS .∃Service link l= (S, c)do
4 S :=S ∩S.OL;
5 end
6 if S 6=∅ then
7 Setcand:=newSet;
8 foreachServiceS′∈T′ where
∃tl∈tlinks . tl= T′
, T(c)do
9 if S ∩S′.OL 6=∅then cand:=cand∪S′;
10 end
11 foreachServiceS′′
∈c.SCdo
12 if S ∩S′′.SC6=∅then cand:=cand∪S′′;
13 end
14 g′
:=g.replace c, selectSubstitute(cand);
15 else
16 if c6=Rootthen
17 g′
:=g.replace c, c.getRandomP arent();
18 end
19 end
20 end
First, the set S is initialized with the subcluster of an invalid cell of a genome g (line 2). A cell is invalid if its
Service QoS Aggregated Cluster QoS
Service Price Time Rel. Node Price: [pbest, pworst],E[p] Time: [tbest, tworst],E[t] Rel.
S11 2$ 290ms 70% N11 [2,2],2$ [290,290],290ms 70%
S12 3$ 240ms 30% N12 [3,10],5.5$ [240,710],481ms 83%
S13 5$ 180ms 20% N13 [5,5],5
$ [180,180],180ms 20% Table 2: Example QoS values for the scenario of Fig. 1
selected service has an invalid link to another service. Next, the union of the output listsOLis computed (line 4) for all ingoing links to this service.
As described above, if this intersection is not empty, the link can be repaired by replacing a service with ones found by descending the functionality graph. We compute the list of candidates by checking whether possible preceding ser-vices (line 9) or serser-vices from the subcluster (line 12) can be employed. Finally, a random service is selected in line 14.
If the intersection in line 6 is empty, no child service ofcor its connected services can repair the invalid link. Therefore, we ascend the graph by selecting a random parent node in line 17 and try to repair the genome in the next iteration.
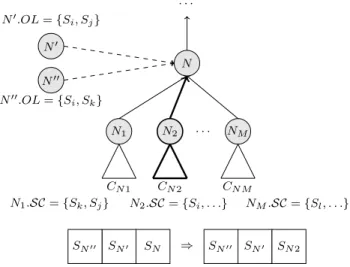
Figure 6 visualizes how the repair operation traverses the functionality graph. The links of the two incoming services
SN′ and SN′′, represented by nodes N
′
and N′′, are both invalid. To judge whether the links can be repaired by de-scending the graph, the union N′
.OL∪N′′
.OL = {Si} is
compared with the SC sets of the subclusters. Since only
N2.SCcontains serviceSi, the original serviceSNis replaced
bySN2 N N′′ N′ N1 N2 NM SN SN′ SN′′ SN′′ SN′ SN2 . . . . . . ⇒ CN1 CN2 CN M N1.SC={Sk, Sj} N2.SC={Si, . . .} NM.SC={Sl, . . .} N′.OL ={Si, Sj} N′′.OL={S i, Sk}
Figure 6: Selecting a subcluster to repair an invalid link betweenSN and its two incoming servicesSN′ andSN′′
4.4
Composition Selection Interface
After the pareto-optimal set of solutions has been com-puted, the graphical interface is used to select a solution. The user initially defines his/her preferences regarding the QoS attributes (price, response time, and reliability). More-over, the user may provide a risk value, indicating whether he/she is risk loving, risk neutral, or risk averse, cf. Fig. 7. A high risk loving preference favors the best-case values of
price and response time. Otherwise, the ordering focuses on the worst-case values.
On the basis of these selections, the tools present an or-dered list of solutions and a spiderweb diagram where the user may compare solutions (cf. Fig 10). In this way, the user may balance different solutions and mark solutions for later comparisons.
Figure 7: The settings dialog in which the user chooses his/her QoS and risk preferences
5.
EVALUATION
We evaluated how well MOO algorithms perform in the problem setting of functionally diverse services by using our extended QoS model. We examined the quality of the solu-tions found, i.e. whether the objectives were optimized and constraints were met. Hence, this evaluation was of whether the QoS model from goalG2 also reaches goalG3.
Moreover, we were interested in whether the algorithms could achieve sufficient reliability depending on the work-flow length and average service compliance. The average service compliance denotes the probability that a service can be connected to another one. Services with low com-pliance exhibit high functionally diversity. This evaluation addresses goalsG1 andG3.
We have employed the jMETAL 3.1 framework [6] which provides 15 multi-objective optimization algorithms. We compared SHUURI these other algorithms on the basis of the hypervolume indicator and reliability they achieved. For the sake of readability, we shall only discuss the results of the top-five approaches in the following.
The services and workflows were randomly generated and each task had 20 alternative services. The parameter types
10 20 30 40 50 0 0.2 0.4 0.6 0.8 1 Workflow length HV rat io NSGA-II SHUURI IBEA GDE3 PSO
(a) Varying workflow lengths
0.2 0.3 0.4 0.5 0.6 0.7 0.8 0 0.2 0.4 0.6 0.8 1
Average service compatibility
HV rat io NSGA-II SHUURI IBEA GDE3 PSO
(b) Different service compatibilities Figure 8: Comparing the hypervolume ratio
10 20 30 40 50 0 0.2 0.4 0.6 0.8 1 Workflow length Rel iabi li ty NSGA-II SHUURI IBEA GDE3 PSO
(a) Varying workflow lengths
20 30 40 50 60 70 80 0 0.2 0.4 0.6 0.8 1
Average service compatibility
Rel iabi li ty NSGA-II SHUURI IBEA GDE3 PSO
(b) Different service compatibilities Figure 9: Evaluating the reliability of the computed selection
were associated with random concepts of the SSUMO ontol-ogy. The QoS of the services were randomly generated ex-pect for the price, which was partially random and partially anti-correlated to the other QoS parameters. We evaluated every test case 100 times and limited the runtime of each al-gorithm to 5000 ms. We applied random constraints on the response time and price. Depending on the scenario, the algorithms optimized three or seven objectives, had to meet QoS constraints, and compute a functionally valid selection.
5.1
Comparing the Hypervolume Ratio
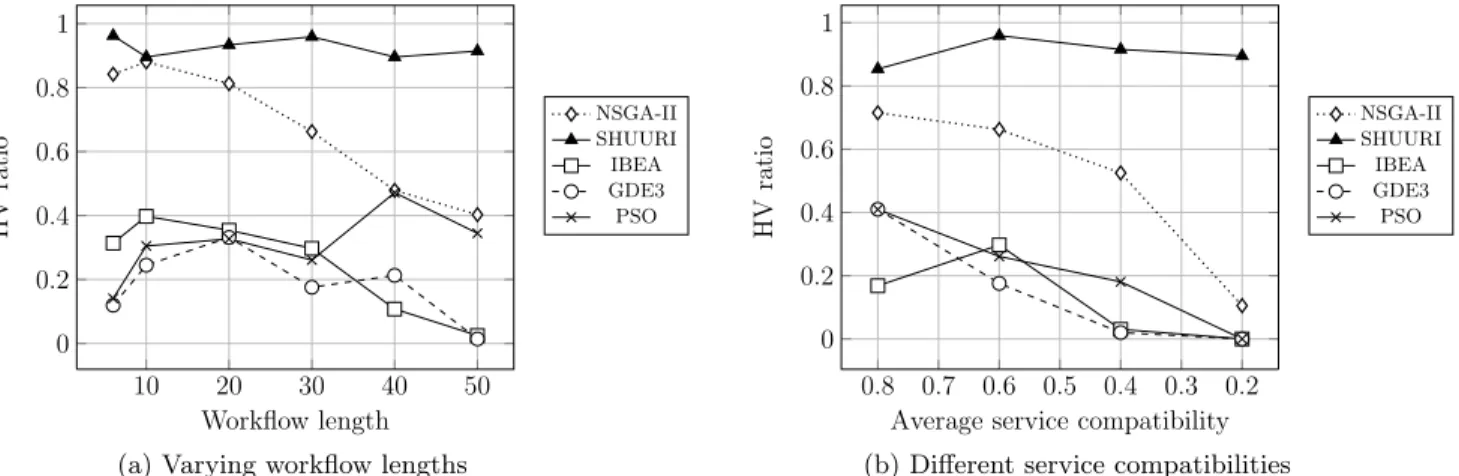
In the first experiment we computed for each algorithm the ratio between the hypervolume of its computed first front and the hypervolume of the merged fronts of all al-gorithms (cf. Section 2.2). All alal-gorithms used the modified QoS model of Section 4.2, employing the functionality graph to evaluate the expected reliability of the workflow.
Figure 8a shows the results for various workflow lengths and an average service compliance of 60%. SHUURI achieved the best results and the difference to the other algorithms became more apparent as the workflow length increased.
In the next experiment, we compared test sets with vary-ing average service compliance, usvary-ing a workflow of length 30. The lower the average service compliance was, the more
difficult it became to discover valid selections. SHUURI yielded the best results regardless of the service compliance. In summary, SHUURI had a constant HV ratio of ap-prox. 90%, whereas the other algorithms had a decreasing HV ratio as the problem size grew. We concluded that the random explorations of the search space performed by the other heuristic algorithms were not sufficient for computing a good approximation of the pareto-front. Since our algo-rithm leveraged background knowledge efficiently, it discov-ered feasible solutions in a selective way, leading to a better approximation of the pareto-optimal set.
5.2
Comparing the reliability
In the next experiment, we evaluated the reliability of the solutions. Each service reliability was randomly generated in a range between 95% and 100%. SHUURI employed the modified QoS model, whereas the other algorithms used the common one in which the algorithms neglect backup ser-vices and replace serser-vices ad-hoc; i.e., after computing a selection, backup services are aggregated for each service. We compared the reliabilities of the top-ten solutions.
As in the previous experiments, we varied the workflow lengths (cf. Fig. 9a), and the average service compliance was 40%. SHUURI yielded the best reliability with increasing
workflow length, whereas the other optimization algorithms had increasingly insufficient reliability.
In the next experiment (cf. Fig. 9b) we modified the ser-vice compliance, and used a workflow with a fixed length of 30. Using test sets with low service compliance, the relia-bility of all algorithms decreased, but SHUURI’s selections still had the highest reliability.
On the basis of these results, we concluded that SHU-URI combined with the extended QoS model significantly increases the reliability of the selections. The other algo-rithms tend to select services having a good reliability but cannot be replaced by other services. In cases where only few backup services exist, the algorithms compute selections that do not have sufficient reliability. SHUURI, on the other hand, is at least able to sustain a reliability of approx. 80%.
5.3
GA Convergence
The last experiment evaluated the convergence of the two genetic algorithms, NSGA-II and SHUURI, depicted in Fig. 11. We used the average HV ratio of the merged front of ten test runs, allowing each algorithm 200 iterations. The workflow length of was 30, and the service compliance was 60%. SHU-URI required a few more iterations to achieve the same HV ratio as NSGA-II but it converged to a higher value.
0 50 100 150 200 0 0.2 0.4 0.6 0.8 1 Generations HV rat io SHUURI NSGA-II
Figure 11: Convergence of NSGA-II and SHUURI
6.
CONCLUSION
We discussed our approach to supporting decision mak-ers in finding robust, QoS optimized service compositions in an open service environment. Our approach takes func-tionally diverse services into account that are a consequence of such an environment. This results in a larger number of backup services, thus increasing the robustness of the result-ing workflows. We developed a new QoS model that helps to predict the resulting QoS of a workflow by considering service failures during the initial selection phase. For each service, we compute a set of possible backup services before-hand and evaluate the QoS of this selection.
We compared our selection algorithm, which is based on a multi-objective genetic algorithm with other state-of-the-art MOO algorithms. The computed solution set of our algo-rithm contains solutions with higher quality and reliability as the problem size grows.
Finally, we presented a graphical interface that enables the decision maker to compare and choose a solution that best fits his/her needs. He/she provides his/her preferences and risk attitude and receives an ordered list of pareto-optimal selections.
As a next step, we plan to apply our approach in ser-vice planning [22] that computes workflow templates. Com-bining both approaches we can provide a flexible and QoS optimized solution for composing workflows automatically.
Moreover, we intend to extend our approach to consider inter-service-dependent QoS attributes. In this way, the time and performance of preceding services can be taken into consideration.
7.
REFERENCES
[1] M. Alrifai and T. Risse. Combining Global Optimization with Local Selection for Efficient QoS-aware Service Composition. InProceedings of the 18th International Conference on World Wide Web, (WWW), New York, NY, USA, 2009. ACM.
[2] M. Alrifai, D. Skoutas, and T. Risse. Selecting Skyline Services for QoS-based Web Service Composition. In
Proceedings of the 19th International Conference on World Wide Web, (WWW), New York, NY, USA, 2010. ACM.
[3] B. Benatallah, M. Dumas, Q. Z. Sheng, and A. H. H. Ngu. Declarative composition and peer-to-peer provisioning of dynamic web services. InProceedings of the 18th International Conference on Data Engineering (ICDE), 2002.
[4] G. Canfora, M. Di Penta, R. Esposito, and M. L. Villani. An Approach for QoS-aware Service Composition based on Genetic Algorithms. In
Proceedings of the Conference on Genetic and Evolutionary Computation (GECCO), 2005.
[5] K. Deb, A. Pratap, S. Agarwal, and T. Meyarivan. A Fast and Elitist Multiobjective Genetic Algorithm: NSGA-II.IEEE Transactions on Evolutionary Computation, 6:182–197, 2002.
[6] J. J. Durillo and A. J. Nebro. jMetal: A Java Framework for Multi-Objective Optimization.
Advances in Engineering Software, 42:760–771, 2011. [7] F. Ishikawa, S. Katafuchi, F. Wagner, Y. Fukazawa,
and S. Honiden. Bridging the Gap Between Semantic Web Service Composition and Common
Implementation Architectures.IEEE International Conference on Services Computing (SCC), 2011. [8] M. C. Jaeger and H. Ladner. Improving the QoS of
WS Compositions Based on Redundant Services. In
Proceedings of the International Conference on Next Generation Web Services Practices (NWESP). IEEE Computer Society, 2005.
[9] A. Klein, F. Ishikawa, and B. Bauer. A Probabilistic Approach to Service Selection with Conditional Contracts and Usage Patterns. InProceedings of the 7th International Joint Conference on
Service-Oriented Computing (ICSOC), Berlin, Heidelberg, 2009. Springer-Verlag.
[10] S. Kukkonen and J. Lampinen. GDE3: The third Evolution Step of Generalized Differential Evolution. InIEEE Congress on Evolutionary Computation (CEC), 2005.
[11] N. B. Lakhal, T. Kobayashi, and H. Yokota. A Failure-Aware Model for Estimating and Analyzing the Efficiency of Web Services Compositions. In
Proceedings of the Pacific Rim International
Figure 10: Graphical interface, comparing a solution with good reliability and response time and another, cheaper solution
[12] M. Laukkanen and H. Helin. Composing workflows of semantic web services. InProceedings of the Workshop on Web-Services and Agent-based Engineering, 2003. [13] F. L´ecu´e, A. Delteil, and A. L´eger. Optimizing Causal
Link Based Web Service Composition. InProceedings of the 18th European Conference on Artificial Intelligence (ECAI), pages 45–49. IOS Press, 2008. [14] K.-J. Lin, J. Zhang, and Y. Zhai. An efficient
approach for service process reconfiguration in SOA with End-to-End QoS constraints. In B. Hofreiter and H. Werthner, editors,(CEC), pages 146–153. IEEE Computer Society, 2009.
[15] N. B. Mabrouk, S. Beauche, E. Kuznetsova, N. Georgantas, and V. Issarny. QoS-aware Service Composition in Dynamic Service Oriented Environments. InProceedings of the 10th
ACM/IFIP/USENIX Intl. Conf. on Middleware, 2009. [16] S. B. Mokhtar, D. Preuveneers, N. Georgantas,
V. Issarny, and Y. Berbers. EASY: Efficient semantic service discovery in pervasive computing environments with QoS and context support.Journal of Systems and Software, 81(5):785–808, 2008.
[17] J. O’Sullivan, D. Edmond, and A. H. M. ter Hofstede. What’s in a Service? Distributed and Parallel
Databases, 12(2/3):117–133, 2002.
[18] M. Reyes and C. Coello Coello. Improving PSO-based Multi-objective Optimization Using Crowding, Mutation andǫ-dominance. In C. Coello, A. Hern´andez, and E. Zitler, editors,Third International Conference on Evolutionary
MultiCriterion Optimization (EMO), volume 3410 of
LNCS, pages 509–519. Springer, 2005.
[19] H. Wada, P. Champrasert, J. Suzuki, and K. Oba. Multiobjective Optimization of SLA-Aware Service Composition. InProceedings of the 2008 IEEE Congress on Services - Part I, (SERVICES),
Washington, DC, USA, 2008. IEEE Computer Society.
[20] F. Wagner, F. Ishikawa, and S. Honiden. Achieving Constraint Compliance in QoS-aware Service Planning. InProceedings of the 2nd Intl. Joint Agent Workshop and Symposium (iJAWS), 2011.
[21] F. Wagner, F. Ishikawa, and S. Honiden. Applying QoS-aware Service Selection on Functionally Diverse Services. InICSOC Workshop on Non-Functional Properties and SLA Management in Service-Oriented Computing (NFPSLAM-SOC), Lecture Notes in Computer Science, 2011.
[22] F. Wagner, F. Ishikawa, and S. Honiden. QoS-Aware Automatic Service Composition by Applying
Functional Clustering.IEEE International Conference on Web Services (ICWS), 2011.
[23] J. Wang and Y. Hou. Optimal Web Service Selection based on Multi-Objective Genetic Algorithm. In
Proceedings of the 2008 International Symposium on Computational Intelligence and Design (ISCID), Washington, DC, USA, 2008. IEEE Computer Society. [24] W. Wiesemann, R. Hochreiter, and D. Kuhn. A
Stochastic Programming Approach for QoS-Aware Service Composition. InProceedings of the 2008 Eighth IEEE International Symposium on Cluster Computing and the Grid (CCGRID), pages 226–233, Washington, DC, USA, 2008. IEEE Computer Society. [25] L. Zeng, B. Benatallah, M. Dumas, J. Kalagnanam,
and Q. Z. Sheng. Quality Driven Web Services Composition. InProceedings of the 12th International Conference on World Wide Web (WWW), 2003. [26] E. Zitzler and S. K¨unzli. Indicator-based Selection in
Multiobjective Search. InProceedings of the
Conference on Parallel Problem Solving from Nature (PPSN), 2004.
[27] E. Zitzler and L. Thiele. Multiobjective Optimization Using Evolutionary Algorithms - A Comparative Case Study. InProceedings of the Conference on Parallel Problem Solving from Nature (PPSN), 1998.