Kent Academic Repository
Full text document (pdf)
Copyright & reuse
Content in the Kent Academic Repository is made available for research purposes. Unless otherwise stated all content is protected by copyright and in the absence of an open licence (eg Creative Commons), permissions for further reuse of content should be sought from the publisher, author or other copyright holder.
Versions of research
The version in the Kent Academic Repository may differ from the final published version.
Users are advised to check http://kar.kent.ac.uk for the status of the paper. Users should always cite the published version of record.
Enquiries
For any further enquiries regarding the licence status of this document, please contact: [email protected]
If you believe this document infringes copyright then please contact the KAR admin team with the take-down information provided at http://kar.kent.ac.uk/contact.html
Citation for published version
Santos, Valeria and Otero, Fernando E.B. and Johnson, Colin G. and Osorio, Fernando and Toledo,
Claudio (2016) Exploratory Path Planning Using the Max-Min Ant System Algorithm. In:
2016 IEEE Congress on Evolutionary Computation, 24-29 July 2016, Vancouver, Canada.
DOI
https://doi.org/10.1109/CEC.2016.7744327
Link to record in KAR
http://kar.kent.ac.uk/55108/
Document Version
Author's Accepted Manuscript
Exploratory Path Planning Using the Max-Min Ant
System Algorithm
Val´eria de C. Santos, Fernando S. Os´orio
and Cl´audio F. M. Toledo
Institute of Mathematics and Computer Sciences University of S˜ao Paulo
S˜ao Carlos, Brazil
Email:{valeriac, fosorio, claudio}@icmc.usp.br
Fernando E. B. Otero
and Colin G. Johnson
School of Computing University of Kent Canterbury, United Kingdom
Email:{F.E.B.Otero, C.G.Johnson}@kent.ac.uk
Abstract—In the path planning problem for autonomous mo-bile robots, robots have to plan their path from the start position to the goal. In this paper, we investigate the application of the MMAS algorithm to the exploratory path planning problem, in which the robots should explore the environment at the same time they plan the path. Max-min ant system is an ant colony optimization algorithm that exploits the best solutions found. In addition, to analyze the quality of solutions obtained, we also analyze the traveled distance spent by robots in the first iteration of the algorithm. The environment is previously unknown to the robots, although it is represented by a topological map, that does not require precise information from the environment and provides a simple way to execute the navigation of the path. Thus, the paths are represented by a sequence of actions that the robots should execute to reach the goal. The navigation of the best solution found was implemented in a realistic robotic simulator. The proposed algorithm provides a very good performance in relation to a genetic algorithm and the well-known A* algorithm that deal with this problem.
I. INTRODUCTION
The path planning problem for autonomous mobile robots is a task in which the robots must plan the path from start position and reach the goal. In exploratory path planning, the environment is unknown by the robots. Therefore, they have to plan the path as they discover the environment. Furthermore, the robots should be able to execute the path safely, avoiding collisions with obstacles.
In essence, there are two kinds of maps to represent the environment: metric and topological. Metric maps represent detailed information from the environment, such as coor-dinates and angles. Therefore, the path is composed by a sequence of points that the robots should follow precisely. On the other hand, the main objective of topological maps is to represent the structure of the environment, the relative position among characteristic points.
Topological maps can be represented by a graph, in which the nodes are characteristic points of the environment and the edges represent the navigability among them. We adopted the topological map representation since it does not require precise information from the environment: we can represent the path as a sequence of actions that the robot should execute (e.g., turn right, go straight), considering the current characteristic point.
According to [1], heuristic algorithms that implement search in the solution space can be classified as instance-based or model-based. The instance-based algorithms generate new candidate solutions using the current solution or the cur-rent population of solutions, such as genetic algorithms. The model-based search algorithms generate candidate solutions using a parameterized probabilistic model, which is updated according to previous solutions, allowing the search to con-centrate in regions containing high quality solutions.
Ant Colony Optimization (ACO) is a well established model-based search technique [1]. ACO is a metaheuristic inspired by the foraging behavior of ants. Ants build their path to the goal by a probabilistic choice to move to a neighbor node. The probabilistic choice is based on pheromone de-posited by other ants and on the heuristic function. Then, ants move backward in a deterministic way, depositing pheromone in the graph. The amount of pheromone depends on the quality of solutions. Thus, artificial ants take two important roles of generating solutions and updating the parameters of the model. Ant System (AS) was the first ACO algorithm applied to the traveling salesman problem (TSP) [2]. As the AS did not achieve good performance when compared to state-of-art algorithms for TSP problem, other improvements of the AS, such as the Max-Min Ant System (MMAS), were proposed [3][4]. MMAS provides four main modifications to AS: (i) it exploits the best tours found, in which just the ant that finds the best global solution or the best solution of an iteration is allowed to deposit pheromone; (ii) it limits the possible range of pheromone trail values to an interval; (iii) the pheromone trails are initialized to the upper pheromone trail limit in order to increase the exploration of tours at the start of the search; (iv) pheromone trails are reinitialized each time the system approaches stagnation.
Most works applying ACO to the path planning problem adopt the metric map (e.g., occupation grid) to represent the environment. Consequently, the path is represented by a sequence of points that the robots should follow precisely to reach the goal, which requires robust localization algorithms. As aforementioned, we adopt a topological map, which just requires an approximated representation of the environment and provides a simpler way to execute the navigation of the
path.
In this paper, we propose the application of a Max-Min Ant System algorithm to the exploratory path planning problem for autonomous mobile robots in a topological map. The results show that the MMAS is a promising approach to quickly reach the goal (in relation to the traveled distance spent by the robots) and to optimize the path. The main original contribution of this paper is the proposition of a mobile robot path planning algorithm adopting MMAS, using a topological environment representation. The generated path is based on topological map and can be executed by a sequence of reactive behaviors, like the navigation method proposed by [5] and [6]. This paper is organized as follows: in Section II, related work is presented; Section III presents the max-min ant system algorithm; in Section IV, the experiments and results are discussed and in Section V, the conclusion and future work are presented.
II. RELATEDWORK
Many heuristic and meta-heuristic algorithms have been ap-plied to the path planning problem, such as genetic algorithms, simulated annealing, particle swarm intelligence, ant colony optimization, among others. Further information about these approaches can be found in [7]. This paper addresses an ACO algorithm applied to the path planning problem for mobile robots. In this section, similar recent studies about this subject are presented.
A robot navigation algorithm for dynamic unknown envi-ronments based on an improvement ant-based algorithm was proposed in [8]. Two bidirectional groups of scout ants cooper-ate with each other to find a local optimal static navigation path within the visual domain of the robot. In the robot navigation ant algorithm, which is based on principles of scout ants during the food search process, the global target position is mapped to a sub-goal. Then, robots plan a static local navigation path using the multi-scout ants cooperation (MSAC) algorithm. The environment is represented by a metric map, such as a set of grid cells. According to the authors, the robot navigation ant algorithm is very fast and could generate optimal or near-optimal, collision free paths in complex, unknown, dynamic environments. Although they explained that the visual domain of robots is based on their sensors, they calculated this region based on the grid map; no robotic simulator or realistic sensors were used.
The MSAC algorithm was applied to moving target inter-ception with a fast local path planning algorithm in [9]. The algorithm allows the global path to be recomputed when a change is detected in the trajectory of the target. The intercep-tion point is the sub-goal, then the MSAC algorithm is used to plan the local navigation path. As in [8], the environment is represented by a set of grid cells. The experiments showed that the robot could successfully intercept the moving target.
An approach to solve the problem of path planning for mobile robots based on Simple Ant Colony Optimization Meta-Heuristic (SACO-MH) is presented in [10]. The authors named the algorithm as SACOdm, in whichdis distance and
m is memory. The decision making process is influenced by the distance between the source and target nodes. The memory is used for the ants to remember the visited nodes, which are temporarily marked as obstacles. The selection of optimal path uses a Fuzzy Inference System, that considers the length of the path and the difficulty for navigation. The environment is represented by a matrix of interconnected nodes, such that each node can be marked as free or occupied (obstacle). The algorithm was evaluated in the ACO Test Center simulator, also proposed by the authors.
An ACO algorithm was applied to the path planning prob-lem of robots in dynamic environment in [11], in which two schemes for the reinitialization of pheromone were compared. The purpose of the work is to find the collision-free shortest path, if it exists, between an initial and a final point in a grid map. The dynamic environment was simulated with obstacles of different shapes and lengths which were put in the environment after the optimal solution was found in the original one. According to the simulation results, the algorithm was able to replan the optimal path in the dynamic environment.
A method that combines Cellular Automata (CA) and Ant Colony Optimization for path planning is presented in [12]. The method creates collision-free paths for every robot of a team and, at the same time, keeps their formation. The CA is a grid structure which is updated in that method by ACO to generate collision free paths. The authors created a simulation environment to evaluate the algorithm and it was also implemented in Webots [13], a real world simulation envi-ronment. The experiments showed that the proposed algorithm was effective at creating collision free paths.
A heterogeneous feature ant colony optimization algorithm for the path planning problem for robots was presented in [14]. The authors defined two types of ants: Ant A, dedicated to exploration and Ant B, dedicated to exploitation. They manage the number of each kind of ants to control the convergence rate of the algorithm. The environment is represented by a grid map model, in which a grid can be an available or an obstacle grid. The maps used in the experiments are complex in relation to the number of obstacles and the proposed algorithm could find good solutions. However, the authors do not mention how a robot can navigate in these maps. The algorithm also presented better solutions in a shorter period of time when compared to classical ACO algorithms.
An exploratory path planning method based on genetic algorithms for autonomous mobile robots was proposed in [15]. In that scenario, paths are constructed using the evo-lutionary process, such that robots do not previously know the environment. They start at same position and have to reach the goal as fast as possible. A genetic algorithm was applied to generate the sequence of actions that the robots need to execute to reach the goal. At the beginning, a set of actions are generated randomly. The robots execute those actions, then their fitness are evaluated. The fitness function is based on the traveled distance and the euclidean distance to the goal. Individuals are selected by tournament to reproduce. Then, a
new sequence of actions are generated applying crossover and mutation operators. When a generated action is not possible to be executed (e.g., the robot has to turn right but it just possible turn right or go straight), a different action is randomly chosen among the possible ones. The proposed GA was compared with A* algorithm considering the distance traveled by the robots. The average performance of the GA is better than A* and the smaller distances traveled of the solutions found by GA executions are always better than the solutions returned by A* algorithm. This GA approach is used as a benchmark in this paper.
In this paper, the Max-Min Ant System Algorithm is used to find optimal or near-optimal path between the start position of the robots and the goal. The main contribution of this paper is the application of the algorithm in a topological map, which provides a simple way to control the robot navigation during the path. The path consists of a sequence of actions, such that a robot just needs to identify the moment of executing each one. Most works using a grid representation do not present how the path would be executed in a real world. If the path is composed by a sequence of points, the robot would need a localization algorithm to execute this. Furthermore, based on the study proposed in [15], we also adopt a topological environment representation and analyze the traveled distance by the ants in the first iteration of the algorithm. This approach can be applied in a search and rescue task, in which multiple robots need to reach the target quickly and come back to the source point.
III. THE PROPOSED APPROACH BASED ONMMAS In this paper, we propose an approach based on the MMAS algorithm, in which the robots have to search for an optimal path from start position to the goal. In order to compare our results with the GA approach proposed in [15], we also analyze the traveled distance spent by the ants to find the goal in the first iteration of the algorithm.
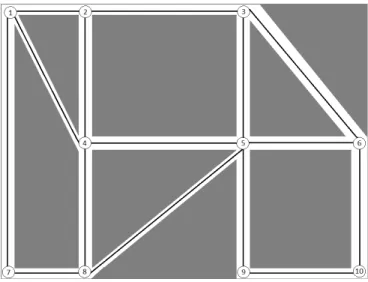
The max-min ant system was executed in a graph, extracted from a maze map, as illustrated in Figure 1. The characteristic points of the map are the nodes in the graph and the edges represent the navigability among these points. Each node has an approximated coordinate of its position, where the exact distances are not relevant as long as the relative distance among nodes are. For example, the distance between nodes 1 and 7 is bigger than the one between nodes 1 and 2. When an ant is in a node, it can access the neighbor nodes, simulating the sensor in a real environment.
The path generated by the algorithm is converted into a sequence of actions that the robots should execute to reach the goal. For this kind of map, the possible actions are: 0 -go west, 1 -go northwest, 2 -go north, 3 -go northeast, 4 -go east, 5 -go southeast, 6 -go southand 7 -go southwest. The actions depend on the robot current position and orientation.
The steps of the MMAS algorithm can be followed in Algorithm 1. Line1 indicates the initialization step, in which all ants are positioned in the same start point. As proposed in the MMAS algorithm, pheromone trails are initialized with
Fig. 1. An example of a map and its correspondent graph.
a large amount of pheromone on all edges. After the first iteration, this amount will be set as the upper pheromone trail limit.
Algorithm 1 MMAS algorithm 1: initialization();
2: pathgb← ∅;
3: while (stop criteria is not reached)do
4: pathib ← ∅;
5: fori←1 to numberOfAntsdo
6: pathi←constructP ath(); 7: localSearch(pathi);
8: if quality(pathi)> quality(pathib)then
9: pathib←pathi; 10: end if
11: end for
12: pheromoneEvaporation();
13: pheromoneU pdate();
14: ifquality(pathib)> quality(pathgb)then
15: pathgb←pathib; 16: end if
17: end while
18: return pathgb;
In the construction phase, lines4−11, each ant constructs the path pathi from the start to the goal position. In each step of the construction phase, an ant k in the current node i calculates the probability to move to a neighbor node j, except the predecessor of node i. For example, in the map in Figure 1, if the current node is 3 and the ant comes from node 2, the feasible nodes to move are nodes 5 and 6. The predecessor node just can be an option in a dead end, where the only option is turn around.
The probability pk
ij of an ant k to move from node i to node j is given by Equation 1 [4], where τij is the amount of pheromone in the edge that links nodesi andj; ηij is the heuristic value to move from nodeitoj;αandβ defines the
influence of the pheromone trail and the heuristic information, respectively;Nk
i is the set of neighbors of cityi. pk ij = [τij]α[ηij]β P l∈Nk i[τil] α[ηil]β,ifj ∈N k i (1)
The heuristic function adopted in this study is the inverse of the euclidean distance between the current and the goal node (ηij = 1/dij), such that this calculation is based on the approximated coordinates of the topological map. During the construction phase, the traveled distance by each ant is calculated in the first iteration, in order to compare the results with the GA approach proposed in [15].
This approach can still generate loops in the paths because there is no control over nodes previously visited, apart from the current previous node. To cope with this, a local search procedure (line 7) to remove loops is applied after ants reach the goal. In this procedure, the loops are identified by repeated nodes in the same path. Thus, the ants go back to the start position, depositing pheromone in improved paths. The best solution found after the construction phase is kept in pathib variable (lines 8−10).
After that, the pheromone evaporation step (line 12) is exe-cuted according to Equation 2, whereρis the evaporation rate. Evaporation rate plays an important role in the convergence speed of the algorithm. As higher is this value, quicker the convergence is reached, but suboptimal solutions can be found.
τij= (1−ρ)τij (2)
After the evaporation, ants go back to the start position, depositing pheromone to reinforce the created path. This is the pheromone update step (line13). MMAS algorithm proposes that just the ant which found the best path during an iteration or during the whole execution deposits pheromone. In this problem, we use the best path during an iteration to explore more the space search. The pheromone update is defined in Equation 3, where ∆τbest
ij = 1/Cbest andCbest is the length of the best solution of an iteration. If the best solution of an iteration is this one found, it is kept in the pathgb variable (lines 14−16). At the end, all ants follow the same path in the backward step and the traveled distance is added to each ant.
τij =τij+ ∆τbest
ij (3)
In MMAS, values of the pheromone on each edge in the trail is limited by a range to avoid stagnation.τmaxis the maximum pheromone trail value, that is defined as 1/ρCbs, where Cbs is the length of the best solution found in the whole execution of the algorithm. The lower pheromone trail is set to τmin=
τmax/a, where ais a parameter [4][2].
The process is repeated until the stop criteria is satisfied. We adopt two stop criteria: the best solution is not improved by a fixed number of iterations or a maximum number of iterations is reached. The algorithm returns the best solution pathgb found (line18). Experiments and results are discussed in the next section.
IV. EXPERIMENTS ANDRESULTS
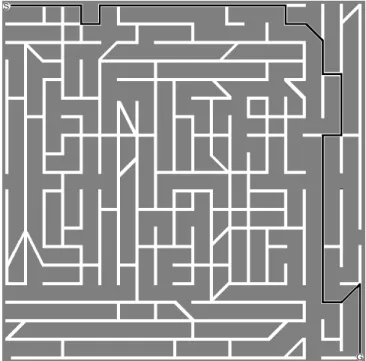
In this section, we present the experimental setup and results of our proposed algorithm. Furthermore, we compare our results with the ones obtained by a genetic algorithm [15], subsequently referred to as the GA approach. We used the same map used to evaluate the GA approach from [15] to evaluate our proposed MMAS algorithm, illustrated in Figure 2. S1 and G1 are adopted as initial and final point,
respectively. The algorithm was run 100 times in this map, the same number of times as the GA algorithm.
Fig. 2. The map used to evaluate the MMAS performance, extracted from [15]. The highlighted black line shows the optimal path for this map.
In the following Tables I and II,first goalrefers to the best traveled distance spent by the ant that reached the goal first in the first iteration of the algorithm from all executions;avg first goalis the average of thefirst goalin all executions;avg travel dist bestis the average of the traveled distance spent by the ant that found the best solution in all executions during the whole running of the ACO; avg dist it refers to the average of the traveled distance spent by each ant in one iteration; percentagerefers to how many times the algorithm found the optimal solution among 100 executions; andavg best path is the average of the best solutions found by the algorithm.
Table I shows the analysis of the first stop criteria: the best solution is not improved by a number of iterations. The other parameters of the algorithm were defined as: maximum iteration number = 1000; α = 1; β = 0.1; number of ants = 20,a= 10. Maximum iteration number is the second stop criteria, α andβ are parameters of Equation 1, a is used to define the lower pheromone trail.
The number of iterations has no influence on the first iteration. The higher the number of iterations, the higher is the traveled distance to find the best solution, although better
solutions are found. The average distance per iteration also shows that better solutions are found as higher is the number of iterations. Based on these results, we have chosen to fix the number of iterations to 50 since it provides a good trade-off between the quality of the solution and the average traveled distance compared to other values.
In the next experiment, we investigate the influence of num-ber of ants. Table II shows the results of the experiments. The other parameters of the algorithm were defined as: maximum iteration number =1000;α= 1;β = 0.1; number of iterations =50;a= 10. Using a larger number of ants does not improve substantially the best first goaltime for an ant reach the goal, but it improves the avg first goal. It interesting to note that using more ants the average traveled distance to find the best solution decreases. This suggests that the higher the number of ants, the easier is to find the optimal solution because of their collaborative work. From five ants,avg distance per iteration value is almost the same, i. e., the ants spent approximately the same distance to leave their start position and reach the goal. Moreover, with five ants, this average value is smaller than the average of best values reached by the GA approach, as can be observed in the first row in Table III.
As higher is the number of ants, the MMAS could improve the quality of solutions. By using100ants, the optimal solution was always found. Despite this observation, we fixed number of ants as 20 since it provided the smallest value of the average distance per iteration and it is the same value used as the population size in the GA approach, which makes the comparison between MMAS and the GA approach fair.
In [15], the authors evaluated their proposed GA in a scenario where the robots should reach the goal as soon as possible, based on the lowest traveled distance from each run of the algorithm. They also compared their results with the A* algorithm [16], a well-known search heuristic [17]. In the A* algorithm, each node is evaluated to be expanded, according to the functionf(n) =g(n)+h(n).g(n)is the real cost to leave the start position and reach the current node n andh(n)is a heuristic function that estimates the cost to leave the current node nand reach the goal.
Table III shows the results of the A* algorithm, GA ap-proach and MMAS algorithm for different start and goal points in the map illustrated in Figure 2.S-Grefers to the start and the goal points; best path dist shows the traveled distance spent by the A* algorithm to find the optimal solution and reach the goal; worst path dist shows the best traveled distance of 100 executions of the GA algorithm;avg best fitnessshows the worst traveled distance of 100 executions of the GA algorithm; avg best fitnessshows the average of the best traveled distance of 100 executions of the GA algorithm.first goalandlastshow the best and worst traveled distance to the MMAS algorithm to find the goal; avg first goalshows the average of the best traveled distance in the first iteration of 100 executions of the MMAS algorithm andavg dist itshows the average of traveled distance spent by each ant per iteration.
We can observe that the ACO algorithm spent the smallest traveled distances to reach the goal at the first iteration for
different start and goal positions. Even the worst distances are much lower than the results achieved by GA approach. The average of the best distance is also much better than the GA approach. The average distance per iteration shows that, on average, the ACO spent the smaller distance to reach the goal compared to the A* and the GA algorithms.
The algorithms were also evaluated in two other maps, with trap, illustrated in Figures 3 and 4. These maps have a trap since the path in the middle of the map seems shorter, considering the euclidean distance, but it has no connection with the goal point. Table IV presents the A*, GA and MMAS algorithms on these maps.
As can be seen, the MMAS could reach the goal in the first iteration spending a lower traveled distance than the GA approach in both maps. This result is unexpected into a trap since MMAS uses the euclidean distance to the goal as heuristic, as the A* algorithm, MMAS also could fall in trap, mainly in the first iteration, when the pheromone amount is the same for all edges. But even being the same amount, the influence of the pheromone in the probabilistic choice helped the algorithm to balance the decision of the next node, during the construction phase. The MMAS also obtained better results in the average of the first goal than the average of the best traveled distance obtained by GA and the traveled distance spent by A* algorithm. Moreover, the MMAS could find the optimal solution in all executions in these maps.
Fig. 3. Map 2, extracted from [15].SandGare the start and goal positions. The highlighted black line shows the optimal path for this map.
The navigation of the best path obtained in the map il-lustrated in Figure 2, between S1 and G1, was executed in
the Player/Stage, a realistic robotic simulator [18], using a Pioneer P3-AT robot with a180◦
SICK Lidar sensor. The path provided by our approach could be represented by a sequence
TABLE I
ANALYSIS OF NUMBER OF STEPS IN THE STOP CRITERIA. Number
of steps First goal Avg first goal Avg travel dist best Avg dist it Percentage Avg best path 5 1424.54 4762.11±1773.90 144288.83±80948.04 17625.68±1998.52 10% 1205.31±63.64 10 1618.13 4585.44±1607.36 210664.12±102608.24 14705.20±1353.40 31% 1164.64±72.22 20 1427.88 4667.01±1848.38 249341.84±128513.64 12257.86±961.51 42% 1161.34±70.74 30 1836.58 4588.88±1416.40 302796.47±171794.79 11279.91±996.36 47% 1151.78±62.28 50 1765.57 4741.35±1906.60 372306.82±206199.95 10048.43±693.50 56% 1136.22±57.86 100 1634.46 4545.71±1863.68 621405.83±522241.55 8991.95±462.52 72% 1118.07±45.17 TABLE II
ANALYSIS OF NUMBER OF ANTS. Number
of ants
First
goal Avg first goal Avg travel dist best Avg dist it Percentage Avg best path 1 3288.25 31507.21±23980.87 815297.95±504828.20 15670.93±2406.07 0 1258.38±46.60 5 2412.07 9205.97±4596.54 406735.76±254652.78 10453.24±1031.97 6% 1216.92±51.68 10 1648.65 6635.75±3524.54 332228.36±205154.26 10133.92±772.10 25% 1175.57±64.33 20 1487.06 4702.57±1801.84 389604.33±239650.44 10065.26±675.70 60% 1132.06±59.33 30 1742.55 4354.05±1805.32 318430.24±180433.27 10097.23±586.22 78% 1115.26±46.14 40 1369.32 3968.88±1310.82 313190.23±180117.21 10114.84±515.35 90% 1103.53±34.13 50 1498.35 3377.00±1134.47 294487.96±156961.04 10141.91±421.27 95% 1097.39±18.20 100 1527.82 3049.75±681.70 187401.35±79433.51 10182.05±221.74 100% 1093.27 TABLE III
RESULTS OFA*, GAANDMMASALGORITHMS FOR DIFFERENT START AND GOAL POSITIONS SHOWED INFIGURE2.
A* GA MMAS
S-G Path dist Best path dist
Worst
path dist Avg best fitness First goal Last goal Avg first goal Avg dist it 1-1 45280.79 2274.31 45071.13 14408.04±7694.13 1487.06 11140.33 4702.57±1801.84 10065.26±675.70 1-2 32131.09 1754.73 44286.19 13644.98±8741.68 1286.81 9376.22 4762.40±1901.44 8921.65±314.44 1-3 51457.50 2258.97 42198.94 15843.37±8803.28 1352.34 12442.80 5055.63±2377.28 9687.88±442.94 2-1 13620.92 1704.65 32323.74 8024.73±6317.97 1379.28 9053.54 3392.73±1458.43 8596.14±666.91 2-2 32450.60 1652.06 40425.91 9622.97±6706.14 1556.17 12724.38 4462.96±1875.78 10260.56±712.98 2-3 30934.27 2377.52 38511.96 12056.61±7443.25 1613.36 13864.48 5071.99±2336.05 10687.96±744.64 3-1 34728.54 1963.24 36969.64 11576.61±6227.41 1727.32 9516.46 4359.05±1570.80 10583.75±0.59 3-2 48322.65 2072.22 46529.57 10244.78±7284.58 1694.27 16885.51 5040.17±2535.35 10422.69±883.81 3-3 64915.37 2904.60 59931.26 13821.54±10146.31 1419.51 18481.61 5276.38±2868.52 11244.90±874.20 TABLE IV
RESULTS OFA*, GAANDMMASALGORITHMS FOR THE MAPS2AND3 (FIGURES3AND4).
A* GA MMAS
Map Path dist Best path dist
Worst
path dist Avg best fitness First goal Last goal Avg first goal Avg dist it 2 85697.93 1681.84 40019.44 10040.29±7310.81 1471.31 14437.46 3755.42±2376.22 12487.02±744.63 3 63137.15 2751.85 68972.28 20278.02±15441.98 2036.38 26634.66 6425.56±4339 13132.97±593.21
of actions, as proposed by [6]. In the navigation of this path, the robot starts walking in a corridor. When it detects a change of state, i. e., when the robot leaves the corridor, the next action is activated. The state recognizer described in [19] was applied to identify when the robot state changes, based on the sensors of the robot. The robot does not have previous information about the environment, it just knows the sequence of actions it should execute. The sequences of actions are: go east, go west,go east,go straight,go straight,go straight,go west,go straight,go east,go west,go straight,go straight,go east,go west,go straight,go straight,go straight,go east,go west,go east,go straight,go west,go east,go west,go east,go west, go east,go straight andgo west.
V. CONCLUSIONS
In this paper we investigated the application of the the min-max ant system algorithm applied to the exploratory path planning problem for autonomous mobile robots. The path was planned based on a topological map and the robots do not previously have information about the environment. In order to compare our proposed MMAS algorithm against a GA algorithm, we evaluated the traveled distance spent by the ants to reach the goal in the first iteration of the algorithm. The results showed that the MMAS approach is much more effective in this task. Moreover, the MMAS could find optimal solutions for all maps evaluated, including the maps with traps. As future research directions, we intend to improve the results of the algorithm to find the optimal solution more times and do a more analytical comparison among the other
Fig. 4. Map 3, extracted from [15].SandGare the start and goal positions. The highlighted black line shows the optimal path for this map.
algorithms from the literature. We will also improve the navigation control method to allow the robots to identify the possible states in a map automatically. Furthermore, we will execute simulations with all robots in the environment.
An extension of the current algorithm to deal with dynamic environment is a research direction worth further exploration.
ACKNOWLEDGMENT
The authors would like to thank CNPq (project ID 159573/2013-0) and CAPES (project ID 99999.003520/2015-03) for their support.
REFERENCES
[1] M. Zlochin, M. Birattari, N. Meuleau, and M. Dorigo, “Model-based search for combinatorial optimization: A critical survey,” Annals of Operations Research, vol. 131, no. 1, pp. 373–395.
[2] T. St¨utzle and H. H. Hoos, “Max-min ant system,” Future Gener. Comput. Syst., vol. 16, no. 9, pp. 889–914, jun 2000.
[3] T. St¨utzle,Local search algorithms for combinatorial problems - analy-sis, improvements, and new applications., ser. DISKI. Infix, 1999, vol. 220.
[4] M. Dorigo and T. St¨utzle, Ant Colony Optimization. Scituate, MA, USA: Bradford Company, 2004.
[5] D. O. Sales, F. S. Os´orio, and D. F. Wolf, “Topological autonomous navigation for mobile robots in indoor environments using ann and fsm,” inI CBSEC: Conferˆencia Brasileira em Sistemas Embarcados Cr´ıticos, S˜ao Carlos, Brasil, 2011.
[6] V. C. Santos, D. O. Sales, C. F. M. Toledo, and F. S. Os´orio, “A hybrid ga-ann approach for autonomous robots topological navigation,” in Proceedings of the 29th Annual ACM Symposium on Applied Computing, ser. SAC ’14. New York, NY, USA: ACM, 2014, pp. 148–153. [7] E. Masehian and D. Sedighizadeh, “Classic and heuristic approaches in
robot motion planning a chronological review,” inProc. World Academy of Science, Engineering and Technology, 2007, pp. 101–106. [8] Q. Zhu, J. Hu, W. Cai, and L. Henschen, “A new robot navigation
algorithm for dynamic unknown environments based on dynamic path re-computation and an improved scout ant algorithm,” Applied Soft Computing, vol. 11, no. 8, pp. 4667 – 4676, 2011.
[9] Q. Zhu, J. Hu, and L. Henschen, “A new moving target interception algorithm for mobile robots based on sub-goal forecasting and an improved scout ant algorithm,”Applied Soft Computing, vol. 13, no. 1, pp. 539 – 549, 2013.
[10] M. P. Garcia, O. Montiel, O. Castillo, R. Sep´ulveda, and P. Melin, “Path planning for autonomous mobile robot navigation with ant colony opti-mization and fuzzy cost function evaluation,”Applied Soft Computing, vol. 9, no. 3, pp. 1102 – 1110, 2009.
[11] M. Brand, M. Masuda, N. Wehner, and X.-H. Yu, “Ant colony opti-mization algorithm for robot path planning,” inComputer Design and Applications (ICCDA), 2010 International Conference on, vol. 3, June 2010, pp. V3–436–V3–440.
[12] K. Ioannidis, G. Sirakoulis, and I. Andreadis, “Cellular ants: A method to create collision free trajectories for a cooperative robot team,”Robotics and Autonomous Systems, vol. 59, no. 2, pp. 113 – 127, 2011. [13] O. Michel, “Webots: Professional mobile robot simulation,”Journal of
Advanced Robotics Systems, vol. 1, no. 1, pp. 39–42, 2004.
[14] Y. Yao, Q. Ni, Q. Lv, and K. Huang, “A novel heterogeneous feature ant colony optimization and its application on robot path planning,” in Evolutionary Computation (CEC), 2015 IEEE Congress on, May 2015, pp. 522–528.
[15] V. C. Santos, C. F. M. Toledo, and F. S. Os´oorio, “An exploratory path planning method based on genetic algorithm for autonomous mobile robots,” inEvolutionary Computation (CEC), 2015 IEEE Congress on, May 2015, pp. 62–69.
[16] P. Hart, N. Nilsson, and B. Raphael, “A formal basis for the heuristic de-termination of minimum cost paths,”Systems Science and Cybernetics, IEEE Transactions on, vol. 4, no. 2, pp. 100–107, July 1968. [17] S. J. Russell and P. Norvig,Artificial Intelligence: A Modern Approach,
2nd ed. Pearson Education, 2003.
[18] T. H. Collett, B. A. MacDonald, and B. P. Gerkey, “Player 2.0: Toward a practical robot programming framework,” inProc. of the Australasian Conf. on Robotics and Automation (ACRA), Sydney, Australia, dec 2005. [19] V. C. Santos, C. F. M. Toledo, and F. S. Os´orio, “A hybrid approach for path planning and execution for autonomous mobile robots,” in Proceedings of 2nd Brazilian Symposium on Robotics and 11th Latin American Robotics Symposium. ACM, 2014, pp. 124–129.
![Fig. 2. The map used to evaluate the MMAS performance, extracted from [15]. The highlighted black line shows the optimal path for this map.](https://thumb-us.123doks.com/thumbv2/123dok_us/10951961.2983711/5.918.474.839.277.645/evaluate-mmas-performance-extracted-highlighted-black-shows-optimal.webp)
![Fig. 4. Map 3, extracted from [15]. S and G are the start and goal positions.](https://thumb-us.123doks.com/thumbv2/123dok_us/10951961.2983711/8.918.81.445.72.439/fig-map-extracted-s-g-start-goal-positions.webp)
