1999, Vol. 91, No. 4,684-689 0022-0663/99/S3.00
Types of Visual-Spatial Representations and Mathematical
Problem Solving
Mary Hegarty and Maria Kozhevnikov
University of California, Santa BarbaraAlthough visual-spatial representations are used extensively in mathematics and spatial ability is highly correlated with success in mathematics education, research to date has not demonstrated a clear relationship between use of visual-spatial representations and success in mathematical problem solving. The authors distinguished 2 types of visual-spatial representa-tions: schematic representations that encode the spatial relations described in a problem and pictorial representations that encode the visual appearance of the objects described in the problem. Participants solved mathematical problems and reported on their solution strategies. The authors were able to reliably classify their visual-spatial representations as primarily schematic or primarily pictorial. Use of schematic spatial representations was associated with success in mathematical problem solving, whereas use of pictorial representations was negatively correlated with success. Use of schematic representations was also significantly correlated with one measure of spatial ability. The research therefore helps clarify the relationship between visual imagery, spatial ability, and mathematical problem solving.
Visual imagery refers to the ability to form mental representations of the appearance of objects and to manipu-late these representations in the mind (Kosslyn, 1995). Most researchers agree that such visual representations are impor-tant in mathematics education because they enhance an intuitive view and an understanding in many areas of mathematics (e.g., Krutetskii, 1976; Usiskin, 1987). There is a significant relationship between spatial ability and achieve-ment in mathematics (e.g., Battista, 1990). However, the wide use of visual images by students is not always effective in problem solving and can lead to erroneous solutions (e.g., Lean & Clements, 1981; Presmeg, 1992). In this study, we clarify the relationship between visual imagery, spatial ability, and mathematical problem solving by identifying two different types of visual-spatial representations used in solving mathematical problems—schematic and pictorial representations—and by showing that they are differentially related to success in mathematical problem solving.
Visual-Spatial Representations in Mathematical Problem Solving
There is extensive research in mathematics showing a correlation between spatial ability and mathematical perfor-Mary Hegarty and Maria Kozhevnikov, Department of Psychol-ogy, University of California, Santa Barbara.
This research was conducted while Mary Hegarty was at the Educational Research Centre, St. Patrick's College, Dublin, Ire-land, and is based on her thesis, submitted to University College, Dublin. We thank Anne McKenna, who supervised the thesis, the pupils of St. Patrick's Boys National School, Drumcondra, who participated in the study, and their teachers.
Correspondence concerning this article should be addressed to Mary Hegarty, Department of Psychology, University of Califor-nia, Santa Barbara, California 93106-9660. Electronic mail may be sent to [email protected].
mance (e.g., Battista, 1990; McGee, 1979; Sherman, 1979; Smith, 1964). For example, Sherman (1979) reported that the spatial ability factor was one of the main factors significantly affecting mathematical performance. This cor-relation increases with the complexity of mathematical tasks (see Kaufmann, 1990, for a review).
Other investigations have focused on the mental processes used in solving mathematical problems, particularly the role of diagrams and visual-spatial images in mathematical problem solving. In these studies, students reported their solution processes after solving problems or while solving problems. On the basis of such studies, Krutetskii (1976) concluded that individuals can be classified into three groups according to how they process mathematical information. The first group consists of verbalizers, who prefer verbal-logical rather than imagery modes when attempting to solve problems; the second group, visualizers, involves those who prefer to use visual imagery; and the third group, mixers, con-tains individuals who have no tendency one way or the other.
Following the Krutetskii model, Moses (1980), Suwar-sono (as cited in Lean & Clements, 1981), and Presmeg (1986a, 1986b, 1992) recognized that individuals could be placed on a continuum with regard to their preference for using visual imagery while solving mathematical problems. The authors of these studies defined mathematical visuality as the extent to which a person prefers to use visual imagery or diagrams when attempting mathematical problems. Suwar-sono developed an instrument to measure an individual's level of visuality—the Mathematical Processing Instrument (MPI), which has been used extensively in further research on this topic. A surprising result from this literature is that the wide use of visual images is not always effective and can sometimes lead to erroneous solutions of mathematical problems. Finding a negative correlation between mathemati-cal visuality and both spatial ability and mathematimathemati-cal performance, Lean and Clements (1981) concluded that 684
verbalizers outperform visualizers on both mathematical and spatial ability tests. On this point, Presmeg (1986a, 1986b) identified five kinds of imagery used by high school students in solving mathematical problems: (a) concrete pictorial imagery (pictures in the mind); (b) pattern imagery (pure relationships depicted in a visual-spatial scheme); (c) kines-thetic imagery, which involves hand movement and other gestures; (d) dynamic imagery, which involves dynamic transformations of geometric figures; and (e) memory of formulas, wherein visualizers typically imagine a formula written on a blackboard or in their notebooks.
Presmeg (1986a, 1986b, 1992) argued that the use of concrete pictorial imagery may focus the reasoning on ir-relevant details that take the problem solver's attention from the main elements in the original problem representation, whereas other kinds of imagery may play a more positive role. Presmeg ascribed the most essential role in mathemati-cal problem solving to pattern imagery, in which concrete details are disregarded and pure relationships are depicted. This kind of imagery was also identified by other researchers (Johnson, 1987; Krutetskii, 1976). However, none of these researchers examined the quantitative relationships between use of different types of imagery and mathematical problem solving, nor have they examined the relationship between spatial ability and use of different types of imagery.
In summary, although spatial ability correlates positively with mathematics achievement, preference to process infor-mation visually correlates with neither mathematical perfor-mance nor spatial ability tests. These results have cast doubt on the usefulness of classifying students as visualizers or verbalizers, and as a consequence, the number of educa-tional studies related to the visualizer-verbalizer cognitive style has declined rapidly over the past decade.
in tasks tapping visual aspects of imagery while showing normal performance in tests of spatial imagery.
We argue that a dissociation between visual and spatial imagery also exists in individual differences in imagery— some individuals are especially good at pictorial imagery (i.e., constructing vivid and detailed visual images), whereas others are good at schematic imagery (i.e., representing the spatial relationships between objects and imagining spatial transformations). We consider spatial ability as a subset of imagery abilities, related to schematic imagery and not related to pictorial imagery (Poltrock & Agnoli, 1986).
The focus of this research is to identify how spatial and visual imagery abilities affect problem solving in mathemat-ics. We first hypothesize that use of schematic spatial imagery in solving mathematical problems is associated with better performance, whereas use of pictorial imagery is associated with poorer performance in problem solving because it takes the problem solver's attention from the main relationships in the problem statement. Second, we hypoth-esize that spatial ability is positively associated with use of schematic imagery but not with use of pictorial imagery. Finally, to test the alternative hypothesis that use of sche-matic imagery is related to general intelligence, rather than spatial ability specifically, we include measures of verbal and nonverbal general intelligence.
Method
Participants
Thirty-three boys in sixth class (sixth grade) in an all-boys primary school in Dublin, Ireland, took part in this study. The mean age of the participants was 12 years, 1 month (range = 11 years, 6 months-13 years, 1 month).
Types of Visual Imagery Ability
The current research differentiates between two different visual imagery abilities identified in cognitive psychology and neuroscience research. This research suggests that visual imagery is not general and undifferentiated but com-posed of different, relatively independent visual and spatial components (e.g., Farah, Hammond, Levine, & Calvanio, 1988; Kosslyn, 1995; Logie, 1995). Visual imagery refers to a representation of the visual appearance of an object, such as its shape, color, or brightness. Spatial imagery refers to a representation of the spatial relationships between parts of an object and the location of objects in space or their movement; further, spatial imagery is not limited to the visual modality (i.e., one could have an auditory or haptic spatial image). Cognitive studies have provided evidence for a dissociation between these two aspects of imagery. First, dual-task studies have shown that visual imagery tasks are impaired by concurrently viewing irrelevant pictures but not by moving one's arm, whereas spatial imagery tasks are impaired by arm movements but not by viewing irrelevant pictures (Logie, 1995). Furthermore, cognitive neuroscience studies (e.g., Farah et al., 1988) have demonstrated that following brain lesions, patients can be extremely impaired
Materials
The following measures were administered to the students: 1. The MPI consists of 15 problems, either taken from previous studies (Krutetskii, 1976; Lean & Clements, 1981) or composed specifically for the study. A pilot study had determined that these problems were of appropriate difficulty level for the students and that students used a variety of strategies to solve the problems, including use of diagrams and imagery and non-visual-spatial solutions. In the pilot study, the MPI gave internally consistent measures of problem solving success (Cronbach's a = .78) and solution strategy (i.e., tendency to use visual-spatial representa-tions [Cronbach's a = .72]).
The problems on the MPI were printed on cards. Each problem was followed by a set of questions, asked by the experimenter, about the strategy used to solve the problem. This method of questioning was adopted because we found that children of this age vary considerably in their ability to give concurrent verbal proto-cols while solving these types of problems. All students were asked all of the questions, unless they had already spontaneously provided the information asked in a question. The problems are presented in Appendix A, and sample accompanying questions are presented in Appendix B.
2. Verbal reasoning ability was measured by the Drumcondra Verbal Reasoning Test (DVRT; Educational Research Centre, 1968). This test was designed to measure general verbal intelli-gence and was developed as part of a large study of the effects of
standardized testing in Ireland (Kellaghan, 1976). It is made up of sections on analogies, the identification of words opposite in meaning to a given stimulus, the identification of concepts as belonging to a single category, and inductive and deductive reasoning. The DVRT is standardized for children aged 10 years to 13 years, with reliability estimates ranging from .94 to .98 for different ages.
3. The Ravens Progressive Matrices Test (Raven, 1958) was used as a measure of nonverbal reasoning. Each item on this test shows a 3 X 3 matrix of figures with one missing cell. The figures in each row and column differ by some rule or set of rules. The task is to induce these rules and apply them to choose the missing figure from a set of eight choices.
4. Spatial ability was measured by two tests, the Block Design subtest of the Wechsler Intelligence Scale for Children—Revised (WISC-R; Wechsler, 1976) and the Space subtest of the Primary Mental Abilities Test (PMA Space; Thurstone & Thurstone, 1947), which are characteristic of two different spatial abilities factors. In the Block Design test, participants are presented with a set of blocks that are white on some sides, red on some sides, and half red-half white on others. They are then presented with a picture of a two-dimensional red and white design. Their task is to arrange the blocks so that the design is shown. This test is characteristic of the spatial visualization factor (Carroll, 1993; Lohman, 1988). The PMA Space test is a mental rotation test. On each trial, participants are shown a standard figure on the left-hand side of the page and six comparison figures on the right-hand side of the page. Their task is to indicate whether each of six comparison figures is a planar rotation of the target figure (as opposed to its mirror image) as quickly and accurately as possible. This test is a measure of the spatial relations factor, also referred to as speeded rotation (Carroll,
1993; Lohman, 1988).
Procedure
The measures were administered in two group sessions and one session in which students were tested individually. In the group sessions, all students were tested at once in their classroom. In the first group session, the DVRT was administered, and in the second group session, the Ravens Progressive Matrices and the PMA Space subtest were administered, according to the standard instruc-tions for these instruments. Each session took approximately 1 hr.
In the individual session, each student was first administered the MPI. The 15 problems were printed on cards and presented in different orders, such that no more than 6 students received the problems in any order. When each problem was presented, the student was first allowed up to 3 min to solve the problem, although students often gave an answer in less than this time. During this time the experimenter did not speak except to encourage a student to attempt a problem, but the experimenter did note any diagrams the student drew or gestures the student made. When the student had answered the problem (or after 3 minutes, if the student did not complete the problem), the student was asked the strategy ques-tions about that problem (samples presented in Appendix B). Following the interviews, which were audiotaped, the students were administered the Block Design subtest of the WISC-R.
Scoring of Mathematical Processing Instrument
Four different measures were scored from responses on the MPI. The first score was the number of problems solved correctly. The second score was a measure of the extent to which the student used visual-spatial representations in solving the problems. Each stu-dent was given a score of 1 on each problem for which they reported use of a visual-spatial representation and 0 for each problem on which there was no evidence that they used such a
representation. The third and fourth scores measured the extent to which students' visual-spatial representations were schematic or pictorial. For each problem on which a person used a visual-spatial representation, the representation was scored as either primarily schematic or primarily pictorial. A visual-spatial representation was scored as primarily schematic if the student drew a diagram, used gestures showing the spatial relations between objects in a problem in explaining their solution strategy, or reported a spatial image of the relations expressed in the problem. For example, consider the responses to the following problems:
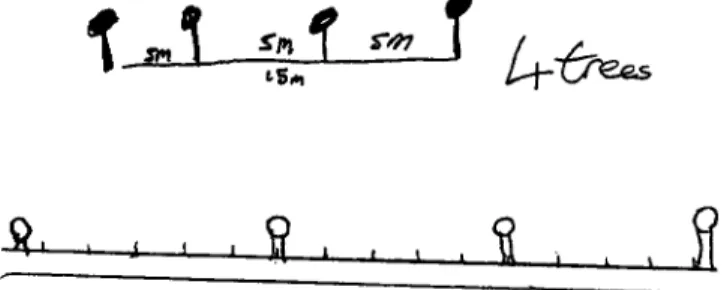
Problem 1: At each of the two ends of a straight path, a man
planted a tree, and then every 5 meters along the path he planted another tree. The length of the path is 15 meters. How many trees were planted?
Problem 11: A hitchhiker set out on a journey of 60 miles. He
walked the first 5 miles and then got a lift from a lorry [truck] driver. When the driver dropped him [off], he still had half of his journey to travel. How far had he traveled in the lorry? The following protocols for Problems 1 and 11, respectively, were scored as indicating primarily schematic imagery because the solver reported representing the essential spatial relations relevant to solving the problem (e.g., the distances between the trees or the length of the journey) and not the specific objects described in the problem:
"I had a [mental] picture of the path, not the trees, and it had something 5 meters along, not trees, just something." "No, I didn't see the lorry driver either. I just pictured 60 miles, it could have been 60 feet, 60 anything."
Diagrams always showed the spatial relations between objects in a problem. Sample diagrams drawn for Problem 1 are shown in Figure 1.
A visual-spatial representation was scored as primarily pictorial if the student reported an image of the objects or persons referred to in a problem, rather than the relations between these objects. For example, the following imagery reported in Problems 1 and 11, respectively, was scored as primarily pictorial:
"I just saw the man going along planting trees."
"No, I just imagined him outside his house with his hand out, hitchhiking."
If there was no evidence in the protocols that the relations between objects in a problem had been represented in an image, the representation was scored as pictorial. It was difficult to classify imagery of Problem 14 as either pictorial or schematic—most participants who reported imagery on this problem imaged a compass, which seems to have both pictorial (image of a compass) and schematic (representation of angles) qualities; hence, this problem was omitted from further analyses. We, serving as two independent raters, scored 20 of the participants' protocols, and the correlations between our overall ratings were .94 for the schematic
J
1
imagery score and .98 for the pictorial imagery score. We decided discrepancies by consensus. Fifteen of the protocols were also scored by a research assistant who was blind to the hypotheses of the study, and the correlations of these scores with the scores agreed on by us were .86 for pictorial imagery and .84 for schematic imagery.
Results
Means and standard deviations for the different measures are presented in Table 1. On average, students solved somewhat less than half of the problems correctly. In 4% of cases, an answer was not given to a problem within the 3 min allowed. Students reported or demonstrated visual—spatial solution strategies on more than half of the problems (7.75 of the 14 problems scored) and were more likely to use primarily pictorial imagery (5.75 of the 14 problems) than primarily schematic imagery (2.00 of the 14 problems). It is interesting that although the students were in the same class and had presumably received the same instruction in math-ematical problem solving, there was much variance in their solution strategies. For example, the number of problems on which students used pictorial representations ranged from 0 to 12, and the number of problems on which they used schematic spatial representations ranged from 0 to 11.
First, we consider the relationship between problem solving, the psychometric measures, and overall use of visual-spatial representations. The correlations between these measures are presented in Table 2. Note that there is no significant correlation between use of visual-spatial strate-gies and problem-solving success. This result is typical in studies of visual-spatial strategies in solving mathematical problems. Furthermore, none of the psychometric measures are positively associated with overall use of a visual-spatial strategy; in fact, this measure is significantly negatively associated with one of the spatial measures. As is to be expected, the psychometric tests were highly correlated with each other and with mathematical problem solving.
We now consider the relationship between the more specific measures of use of schematic and pictorial represen-tations, mathematical problem solving, and the psychomet-ric measures. Use of schematic spatial representations was negatively correlated with use of pictorial representations (r = — .46, p < .01). The correlations of these two measures with mathematical problem solving and the psychometric
Table 1
Descriptive Statistics for the Variables Measured
Table 2
Correlation Matrix (Including Overall Visual-Spatial Strategy Score)
Measure M SD
Mathematical processing instrument Mathematical problem solving Visual-spatial strategy Schematic representation Pictorial representation Psychometric measures
Drumcondra Verbal Reasoning Test Ravens Progressive Matrices Test Primary Mental Abilities Space Subtest WISC-R Block Design Subtest
6.58 7.76 2.00 5.76 113.58 39.76 15.90 33.27 2.75 3.43 2.87 3.60 11.77 8.37 10.74 12.02 Measure 1. VSS 2. Math 3. DVRT 4. RPMT 5. Space 6. Blocks 1 .05 -.02 -.04 -.41* .01 2 .76** .66** .52** .52** 3 .67** .65** .60** 4 .58** .68** 5 .50**
Note. VSS = visual-spatial strategy on the Mathematical
Process-ing Instrument; Math = mathematical problem solvProcess-ing on the Math-ematical Processing Instrument; DVRT = Drumcondra Verbal Reason-ing Test; RPMT = Ravens Progressive Matrices Test; Space = Primary Mental Abilities Space Subtest; Blocks = Wechsler Intelligence Scale for Children—Revised, Block Design Subtest.
*p < .05. **p < .01.
measures are presented in Table 3. As predicted, the pattern of correlations is very different for the two strategy mea-sures. First, use of schematic spatial representations is positively correlated with mathematical problem solving; however there is a marginally significant negative correla-tion of use of pictorial representacorrela-tions with mathematical problem solving (p = .056). These results are consistent with the interpretation that schematic spatial representations include the spatial relationships relevant to solving a prob-lem, whereas pictorial representations include details that are irrelevant to problem solution.
There was partial support for the hypothesis that use of schematic spatial representations is associated with high spatial ability. Use of schematic representations was associ-ated with spatial visualization ability, as measured by the Block Design test, but not with spatial relations (speeded rotation), as measured by the PMA Space test. The alterna-tive hypothesis that use of schematic representations is associated with general intelligence rather than spatial ability specifically was not strongly supported by the data—correlations of use of schematic representations with the reasoning measures were positive but nonsignificant. The correlations between use of pictorial imagery and the Table 3
Correlations of Pictorial and Schematic Representation Scores With Mathematical Problem Solving
and Psychometric Measures
Measure Math DVRT RPMT Space Blocks Schematic .48** .13 .21 - . 0 9 .36* Pictorial - . 3 4 - . 1 2 - . 2 0 - . 3 3 - . 2 7
Note. WISC-R = Wechsler Intelligence Scale for
Children-Revised.
Note. Schematic = schematic representation on the
Mathemati-cal Processing Instrument; Pictorial = pictorial representation on the Mathematical Processing Instrument; Math = mathematical problem solving on the Mathematical Processing Instrument; DVRT = Drumcondra Verbal Reasoning Test; RPMT = Ravens Progressive Matrices Test; Space = Primary Mental Abilities Space subtest; Blocks = Wechsler Intelligence Scale for Children— Revised, Block Design subtest.
psychometric measures were generally negative, although none reached statistical significance.
Discussion
In this study, we made a distinction between two types of visual-spatial representations used in mathematical problem solving—schematic representations that primarily encode the spatial relations described in a problem and pictorial representations that primarily encode the visual appearance of the objects or persons described. We showed that visual-spatial representations can be reliably classified into one of these types and that the types are differentially related to problem-solving success. Use of schematic representations is positively related to success in mathematical problem solving, whereas use of pictorial representations is nega-tively related to success in mathematical problem solving.
This research helps to explain why previous studies (e.g. Krutetskii, 1976; Lean & Clements, 1981; Presmeg, 1986a, 1986b, 1992) found no relationship between use of visual-spatial representations and mathematical problem solving. Characterizing students as visualizers and verbalizers is too general a classification. There are, in fact, two types of visualizers: schematic types, who are generally successful in mathematical problem solving, and pictorial types, who are less successful than schematic types.
In this study we also began to examine the relationship between use of types of visual-spatial representations and different spatial ability factors. Use of schematic imagery was associated with high spatial visualization ability, as measured by the Block Design test, but not with a test of spatial relations (the PMA Space test). Tests of spatial visualization, like the Block Design test, are the most complex tests of spatial ability, involving a sequence of spatial transformations of a spatial representation. Items vary in difficulty (e.g., number of spatial transformations to be imagined), and the limiting factor in performance on these tests is difficulty, which is in contrast to tests of spatial relations wherein the items are relatively easy and the limiting factor is speed (Carroll, 1993; Lohman, 1988). Spatial visualization has sometimes been interpreted as the ability to construct high quality representations that are resistant to decay when complex transformations are carried out on the representations (Lohman, 1988). The construction of schematic spatial representations in solving mathematical problems might also be thought of as the construction of high quality spatial representations, in that they represent the essential information relevant to solving the problem and omit superfluous details.
This research was carried out in an all-boys school. Given that there are well-documented sex differences in spatial ability, we might be concerned about the generality of the findings. However, sex differences in spatial and mathemati-cal ability do not emerge until puberty (McGee, 1979), so these differences are not observed in the age group studied in this research. Second, sex differences in spatial ability have been found primarily in tests of spatial relations and are not found in tests of spatial visualization (Linn & Peterson, 1985), which were most predictive of use of schematic representations in this study. Third, a recent study of physics
problem solving carried out with male and female college students replicated this research, showing that high spatial ability students constructed more schematic spatial represen-tations and low spatial ability students constructed more concrete pictorial images (Kozhevnikov, 1999). Therefore, we expect our results to generalize to other populations, although it is important to test this expectation empirically.
Our research clearly shows that some visual-spatial representations promote problem-solving success and others may present an obstacle to mathematical problem solving. Regardless of a student's spatial ability, it might be possible to teach students productive ways of representing problem information spatially. Instructing students to try to "visual-ize" mathematical problems will probably not be successful. Instead, instruction should encourage students to construct spatial representations of the relations between objects in a problem and discourage them from representing irrelevant pictorial details.
References
Battista, M. T. (1990). Spatial visualization and gender differences in high school geometry. Journal of Research in Mathematics
Education, 21, 47-60.
Carroll, J. (1993). Human cognitive abilities: A survey of the
factor-analytic studies. New York: Cambridge University Press.
Educational Research Centre. (1968). Drumcondra verbal
reason-ing test. Dublin, Ireland: Author.
Farah, M. J., Hammond, K. M., Levine, D. N., & Calvanio, R. (1988). Visual and spatial memory: Dissociable systems of representation. Cognitive Psychology, 20, 439-462.
Johnson, M. (1987). The body in the mind: The bodily basis of
meaning, imagination, and reason. Chicago: University of
Chicago Press.
Kaufmann, G. (1990). Imagery effects on problem solving. In P. J. Hampson, D. E. Marks, & J. T. E. Richardson (Eds.), Imagery:
Current developments (pp. 169-197). New York: Routledge.
Kellaghan, T. (1976). The Drumcondra verbal reasoning test. In O. G. Johnson (Ed.), Tests and measurement in child
develop-ment, II (Vol. 1, p. 68). San Francisco: Jossey-Bass.
Kosslyn, S. M. (1995). Mental imagery. In S. M. Kosslyn & D. N. Osherson (Eds.), Visual cognition: An invitation to cognitive
science (Vol. 2, pp. 267-296). Cambridge, MA: MIT Press.
Kozhevnikov, M. (1999). Students' use of imagery in solving
qualitative problems in kinematics. Unpublished doctoral
disser-tation, Israel Institute of Technology, Haifa, Israel.
Krutetskii, V. A. (1976). The psychology of mathematical abilities
in schoolchildren. Chicago: University of Chicago Press.
Lean, C , & Clements, M. A. (1981). Spatial ability, visual imagery, and mathematical performance. Educational Studies in
Mathemat-ics, 12, 267-299.
Linn, M., & Peterson, A. C. (1985). Emergence and characteriza-tion of sex differences in spatial ability: A meta-analysis. Child
Development, 56, 1479-1498.
Logie, R. H. (1995). Visuo-spatial working memory. Hillsdale, NJ: Erlbaum.
Lohman, D. (1988). Spatial abilities as traits, processes, and knowledge. In R. J. Sternberg (Ed.), Advances in the psychology
of human intelligence (Vol. 4, pp. 181-248). Hillsdale, NJ:
Erlbaum.
McGee, M. G. (1979). Human spatial abilities: Psychometric studies and environmental, genetic, hormonal, and neurological influences. Psychological Bulletin, 86, 889-918.
Moses, B. E. (1980, April). The relationship between visual
thinking tasks and problem-solving performance. Paper
pre-sented at the annual meeting of the American Educational Research Association, Boston, MA.
Poltrock, S. E., & Agnoli, F. (1986). Are spatial visualization ability and visual imagery ability equivalent? In R. J. Sternberg (Ed.),
Advances in the psychology of human intelligence (Vol. 3, pp.
255-296). Hillsdale, NJ: Erlbaum.
Presmeg, N. C. (1986a). Visualization in high school mathematics.
For Learning of Mathematics, 63, 42-46.
Presmeg, N. C. (1986b). Visualization and mathematical gifted-ness. Educational Studies in Mathematics, 17, 297-311. Presmeg, N. C. (1992). Prototypes, metaphors, metonymies, and
imaginative rationality in high school mathematics. Educational
Studies in Mathematics, 23, 595-610.
Raven, J. (1958). Standard progressive matrices. London: H. K. Lewis.
Sherman, J. A. (1979). Predicting mathematical performance in high school girls and boys. Journal of Educational Psychology,
71, 242-249.
Smith, M. (1964). Spatial ability: Its educational and social
significance. London: University of London Press.
Thurstone, L. L., & Thurstone, T. G. (1947). Primary mental
abilities. Chicago: Science Research Associates.
Usiskin, Z. (1987). Resolving the continuing dilemmas in school geometry. In M. M. Lindquist & A. P. Shulte (Eds.), Learning
and teaching geometry K-12 (pp. 17-31). Reston, VA: National
Council of Teachers of Mathematics.
Wechsler, D. (1976). Wechsler Intelligence Scale for
Children-Revised. San Antonio, TX: Psychological Corporation.
Appendix A
The Mathematical Problems on the Mathematical Processing Instrument 1. At each of the two ends of a straight path, a man planted a tree
and then every 5 meters along the path he planted another tree. The length of the path is 15 meters. How many trees were planted?
2. On one side of a scale there is a lkg weight and half a brick. On the other side there is one full brick. The scale is balanced. What is the weight of the brick?
3. A balloon first rose 200 meters from the ground, then moved 100 meters to the east, then dropped 100 meters. It then traveled 50 meters to the east, and finally dropped straight to the ground. How far was the balloon from its original starting point?
4. In an athletics race, Jim is four meters ahead of Tom and Peter is three meters behind Jim. How far is Peter ahead of Tom?
5. A square (A) has an area of 1 square meter. Another square (B) has sides twice as long. What is the area of B?
6. From a long stick of wood, a man cut 6 short sticks, each 2 feet long. He then found he had a piece of 1 foot long left over. Find the length of the original stick.
7. The area of a rectangular field is 60 square meters. If its length is 10 meters, how far would you have traveled if you walked the whole way around the field?
8. Jack, Paul and Brian all have birthdays on the 1st of January,
but Jack is one year older than Paul and Jack is three years younger than Brian. If Brian is 10 years old, how old is Paul?
9. The diameter of a tin of peaches is 10 cm. How many tins will fit in a box 30 cm by 40 cm (one layer only)?
10. Four young trees were set out in a row 10 meters apart. A well was situated beside the last tree. A bucket of water is needed to water two trees. How far would a gardener have to walk altogether if he had to water the four trees using only one bucket?
11. A hitchhiker set out on a journey of 60 miles. He walked the first 5 miles and then got a lift from a lorry driver. When the driver dropped him he still had half of his journey to travel. How far had he traveled in the lorry?
12. How many picture frames 6 cm long and 4 cm wide can be made from a piece of framing 200 cm long?
13. On one side of a scale there are three pots ofjamandalOOg weight. On the other side there are a 200 g and a 500 g weight. The scale is balanced. What is the weight of a pot of jam?
14. A ship was North-West. It made a turn of 90 degrees to the right. An hour later it made a turn through 45 degrees to the left. In what direction was it then traveling?
15. There are 8 animals on a farm. Some of them are hens and some are rabbits. Between them they have 22 legs. How many hens and how many rabbits are on the farm?
Appendix B
Sample Strategy Questions Asked by the Experimenter After a Problem Was Solved Have you ever done problems like this in class?
Did you try to remember how you had done those problems?
Did the answer to this problem just "hit" you like a bright idea, or did you have to think about it for a while? Can you explain how you worked it out?
[If no] Did you try to make a mental picture of the problem? Can you describe the mental picture?
Did you rely much on your diagram/mental picture when you were solving the problem?
Received August 10, 1998 Revision received January 5,1999 Accepted January 5, 1999